Podcast: Play in new window
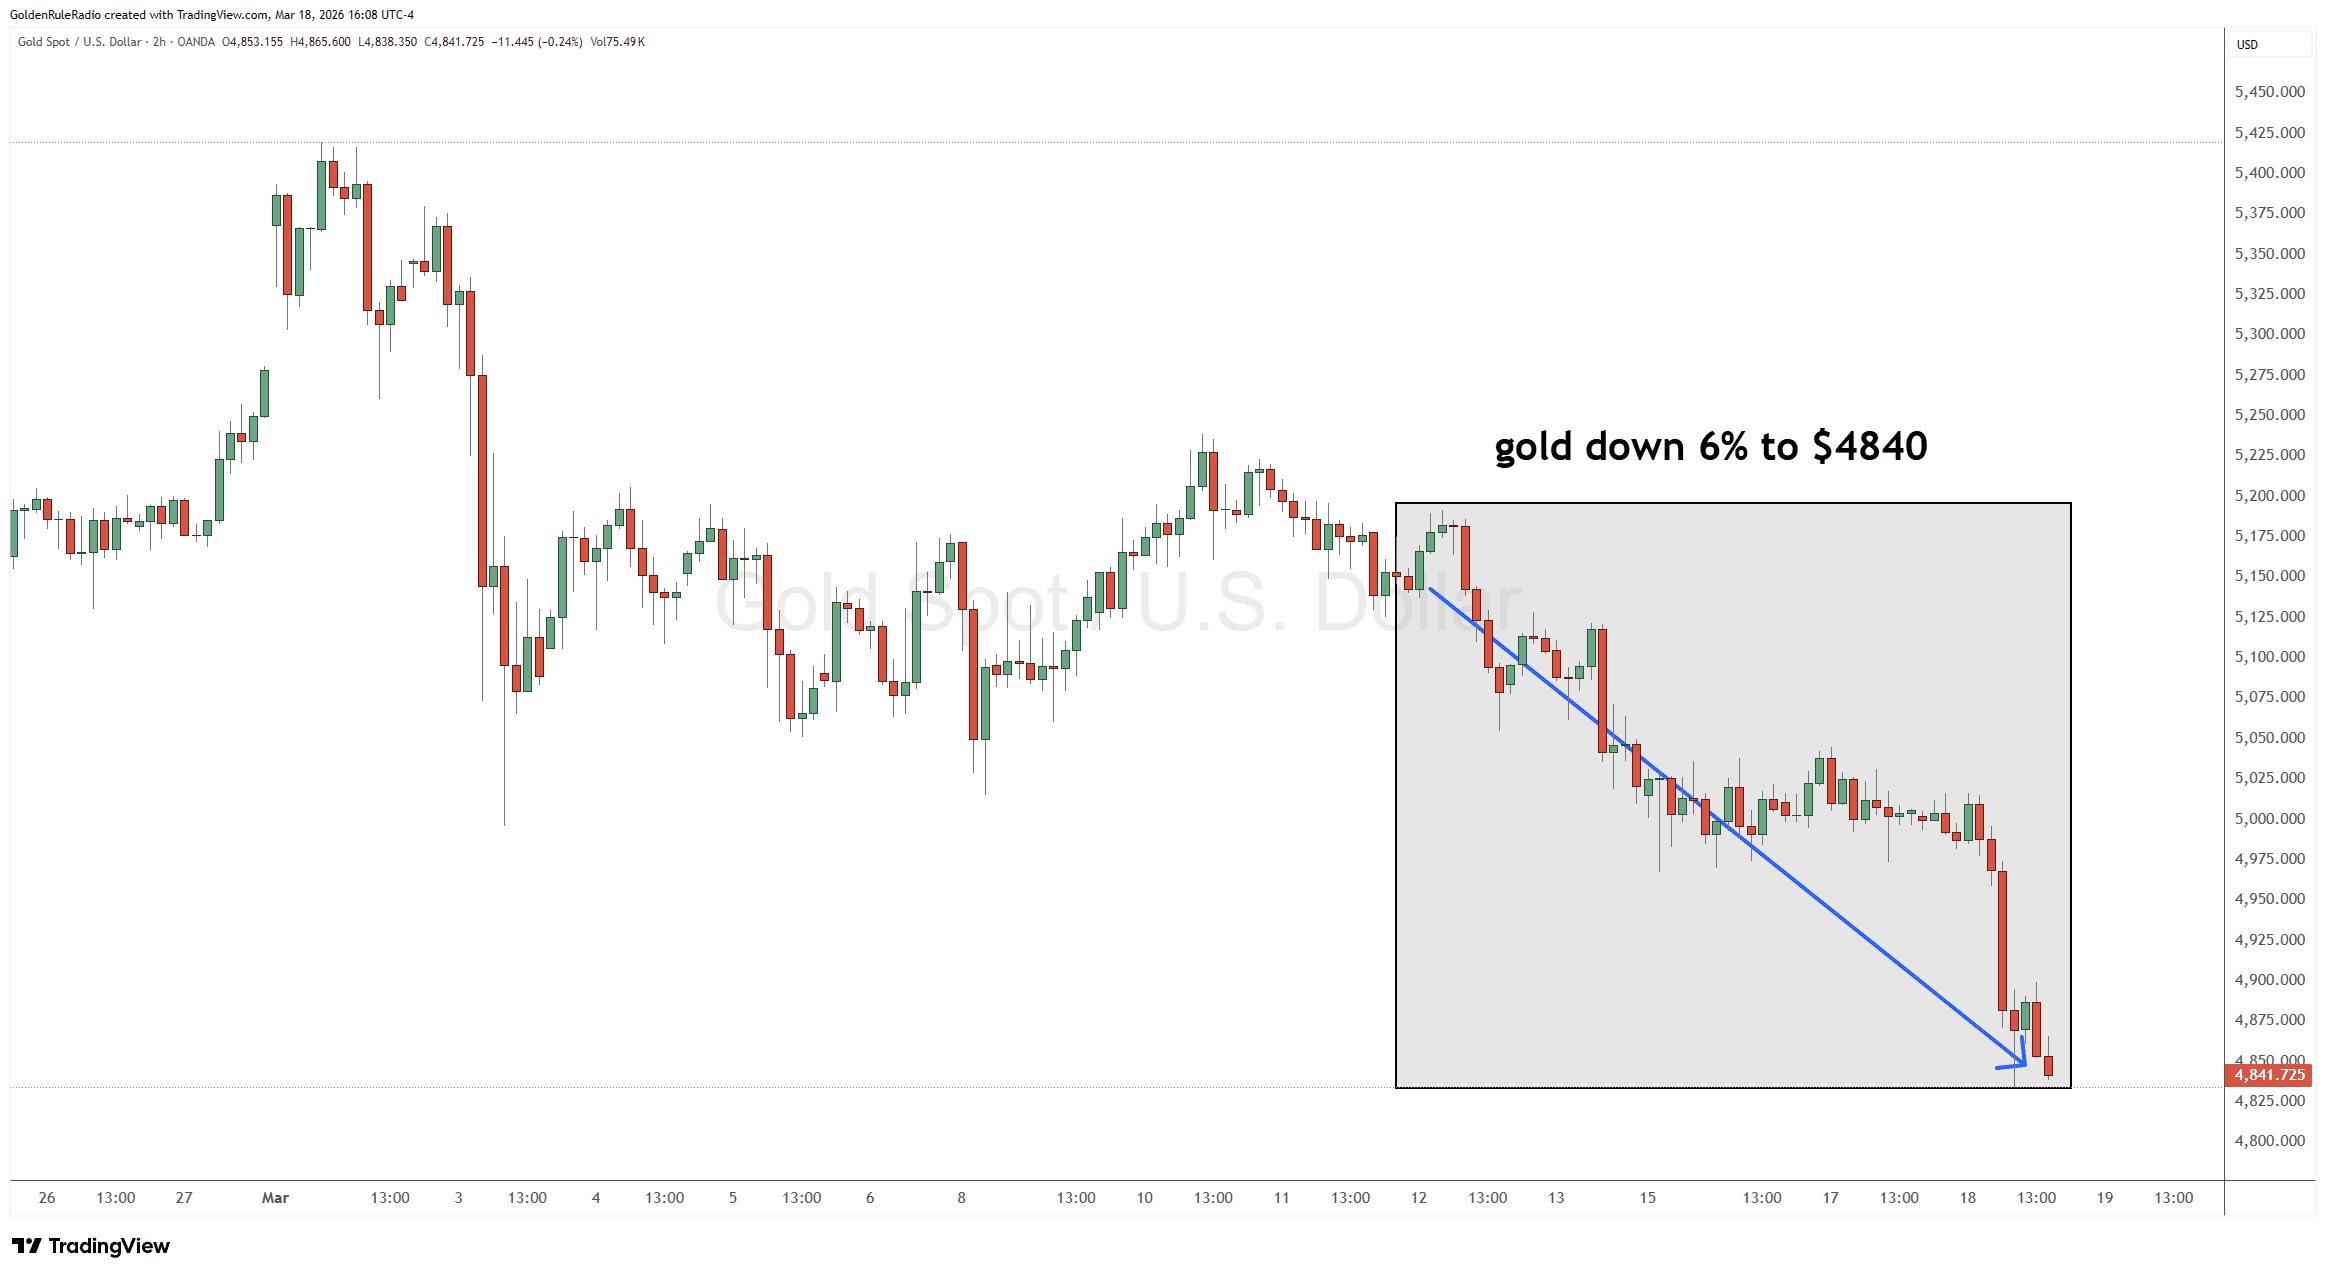
Metals markets pulled back this week as gold fell 6% and silver dropped to the bottom of its trading range with a 10% decline. Platinum and palladium both followed suit while also widening the gap between the two metals. As often happens when metals dip, the dollar index crept upwards and broke above the 100 level. Despite the slide seen in the metals markets, they all remain within longer-term trends and this dip offers up a buying opportunity before the bullish trends continue.
Let’s take a look at where the prices of precious metals stand as of Wednesday, March 18:
The price of gold is down 6%, currently sitting at $4,840.
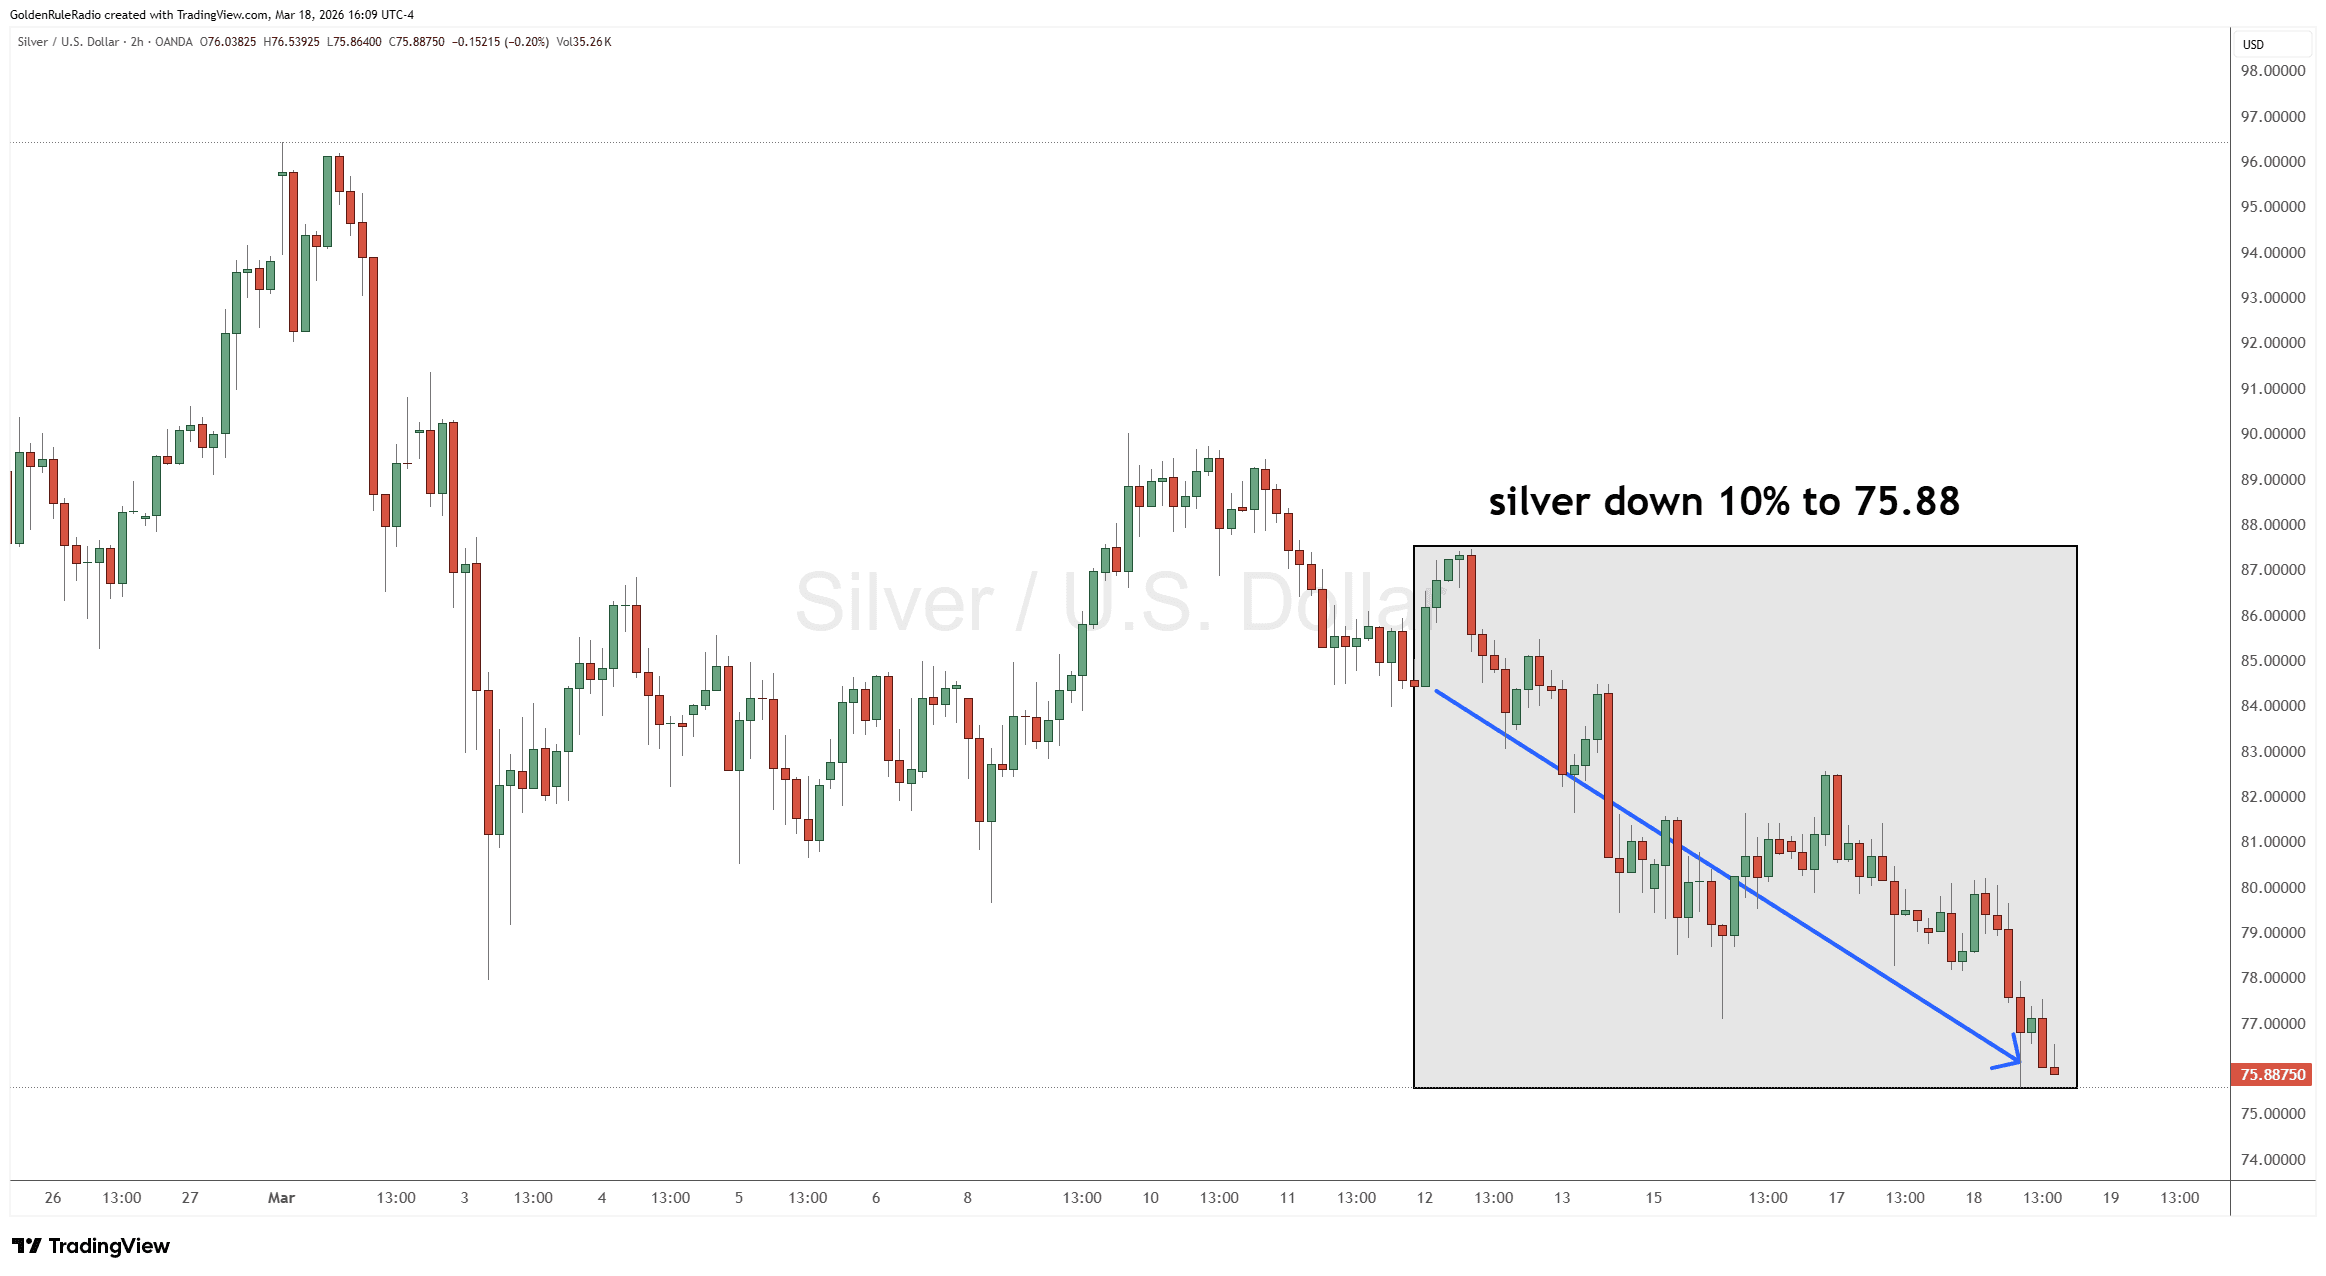
The price of silver is down 10%, sitting at $75.88. It is continuing its short-term slide down to the bottom of its trading range.
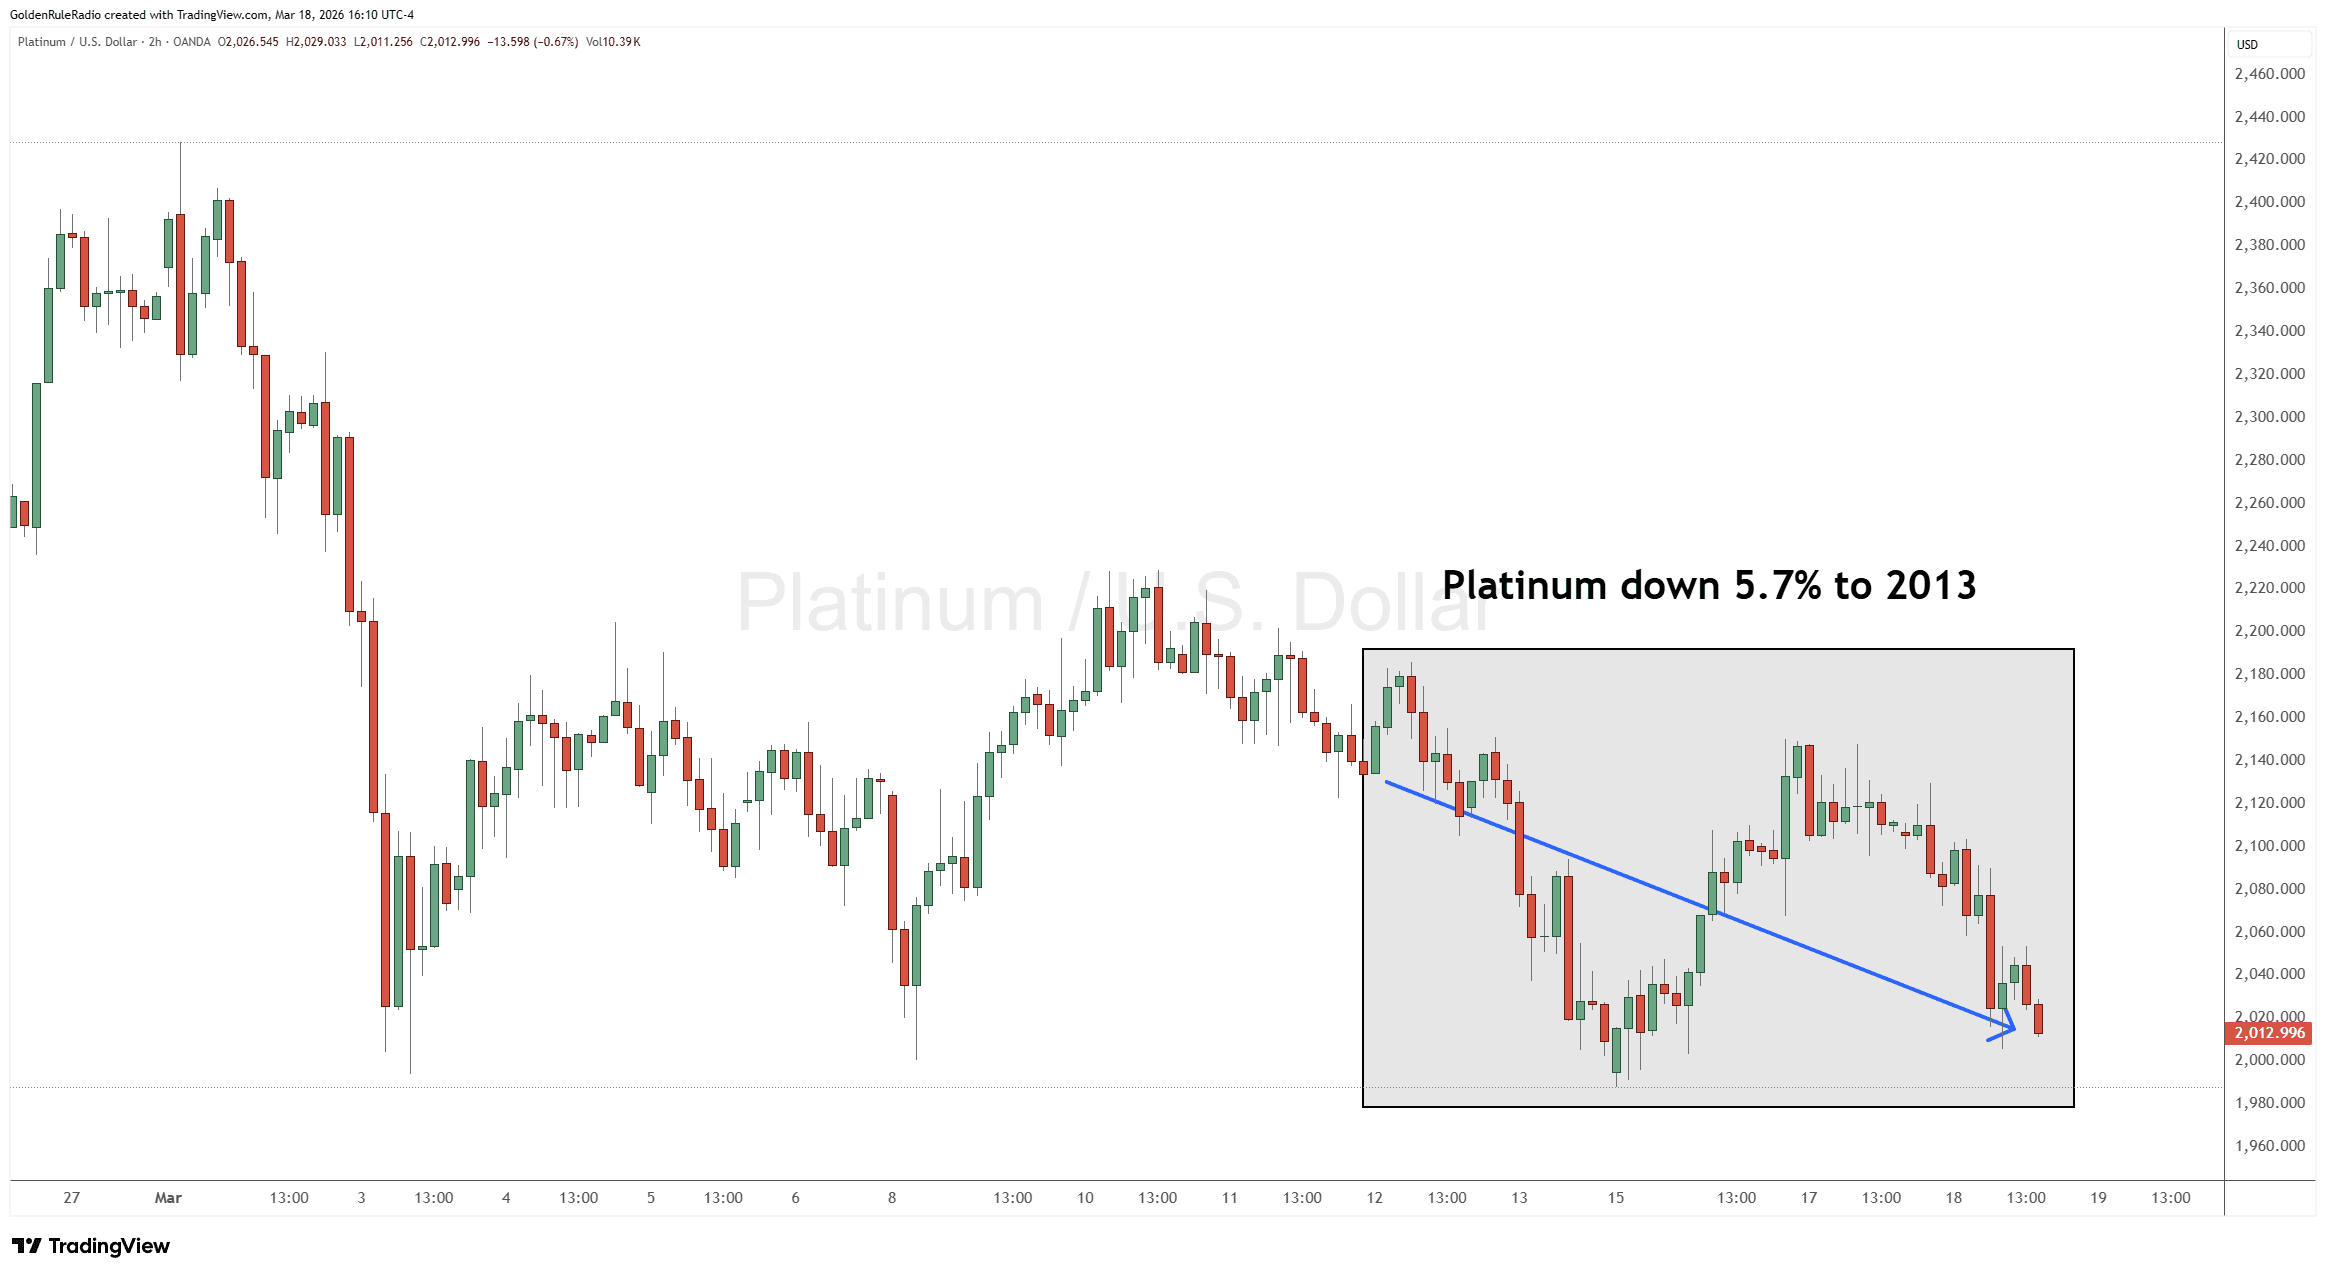
Platinum is down 5.7% sitting at $2,013.
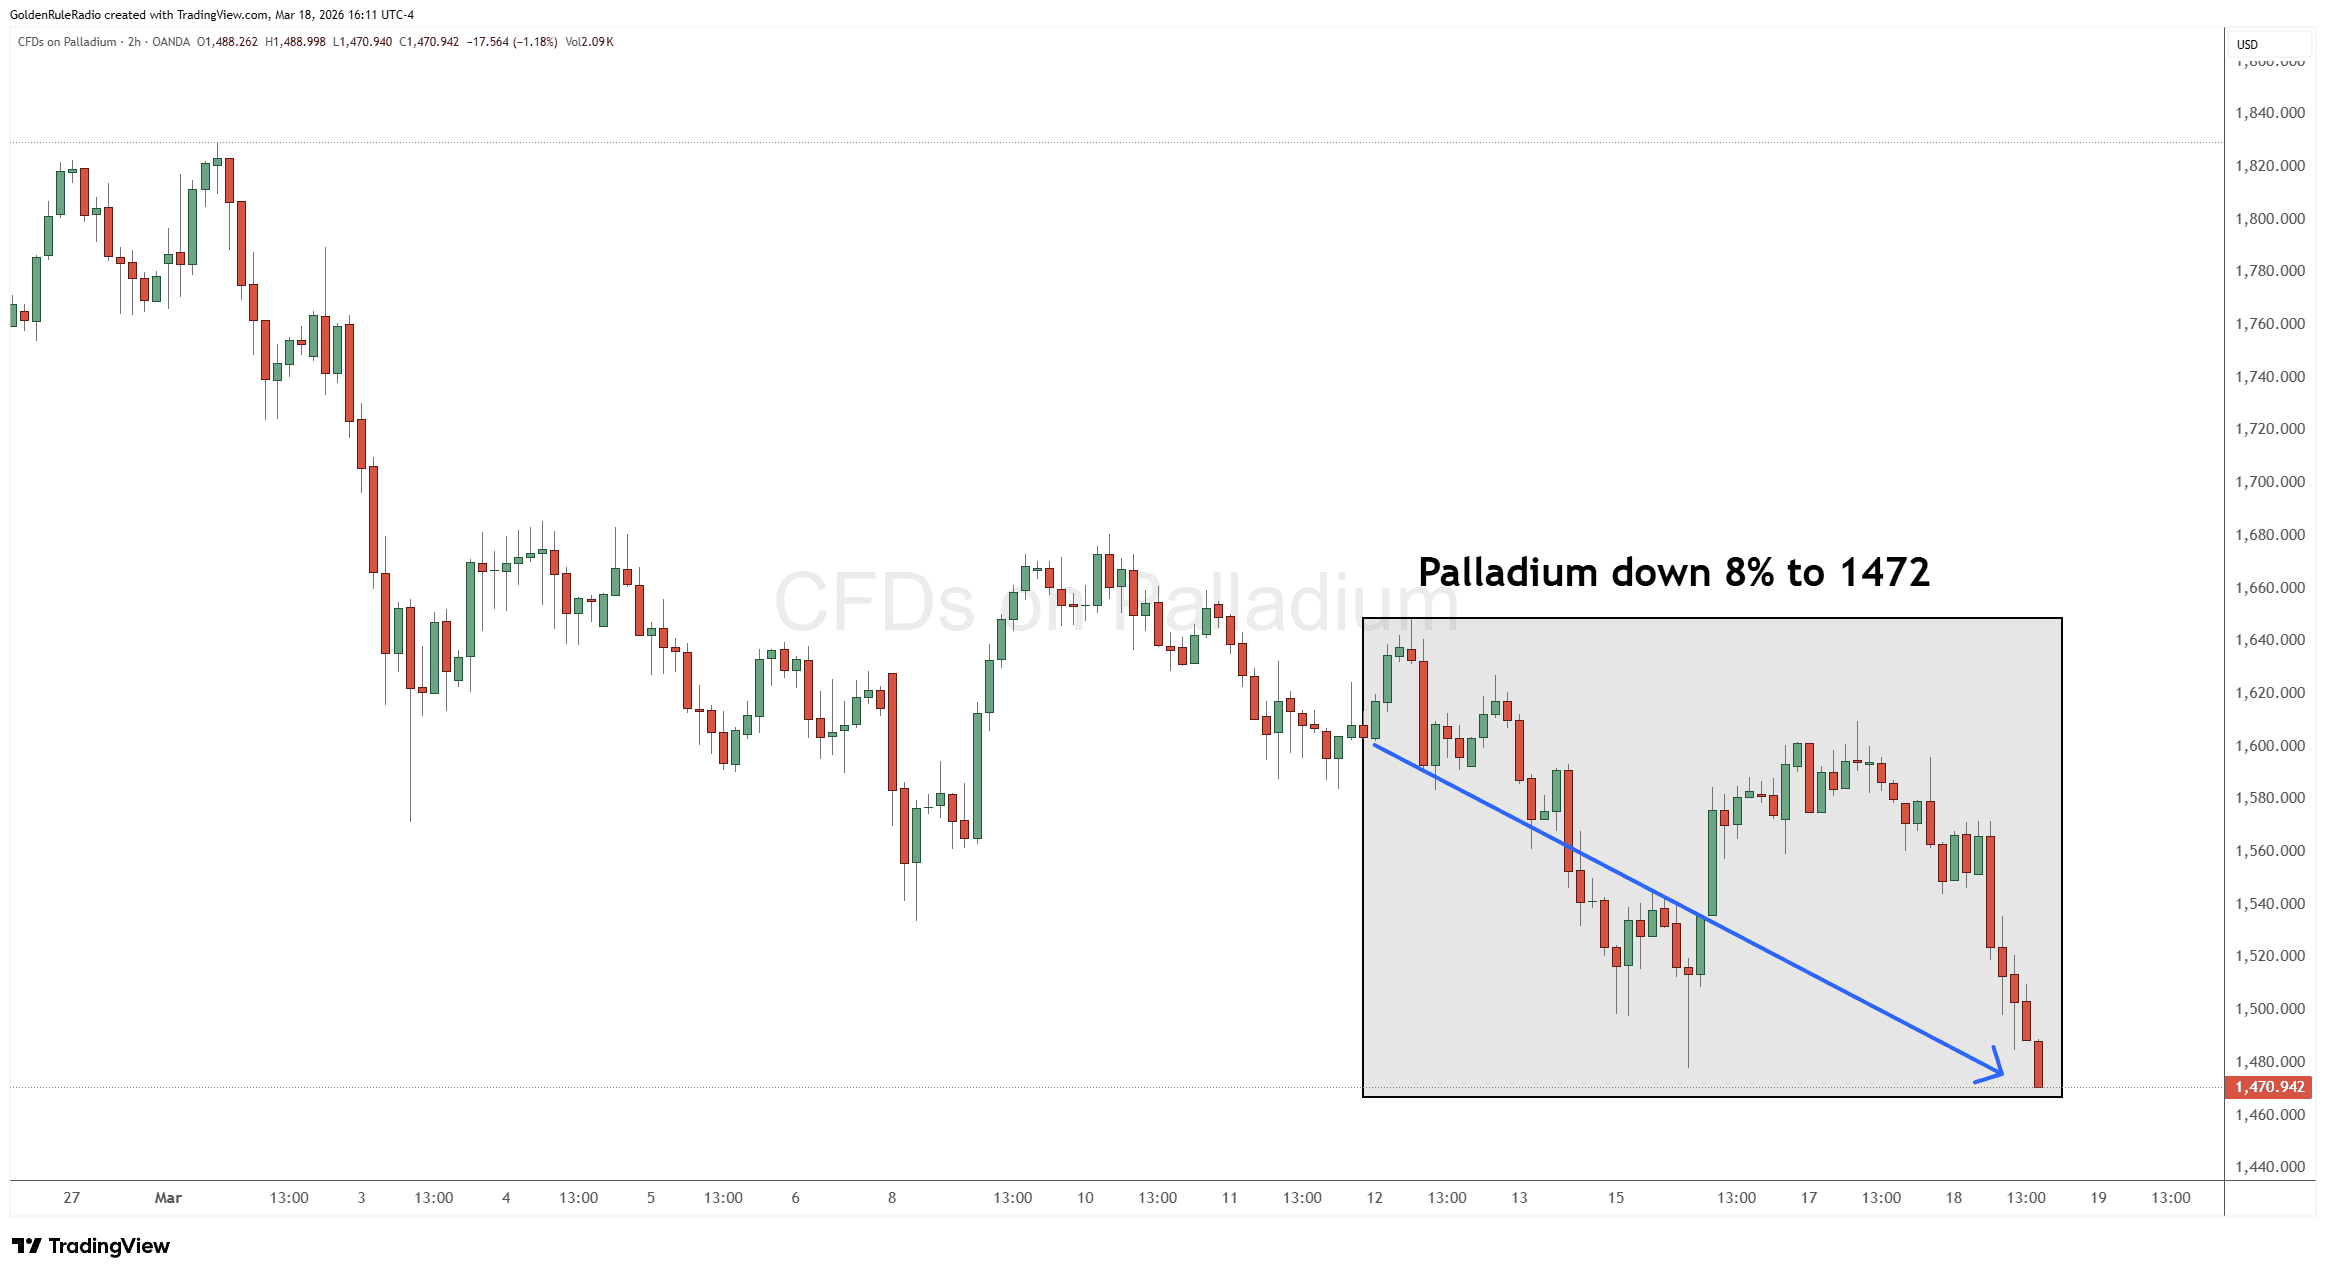
Palladium is down 8%, sitting at $1,472. That’s about $530 below its sister metal platinum.
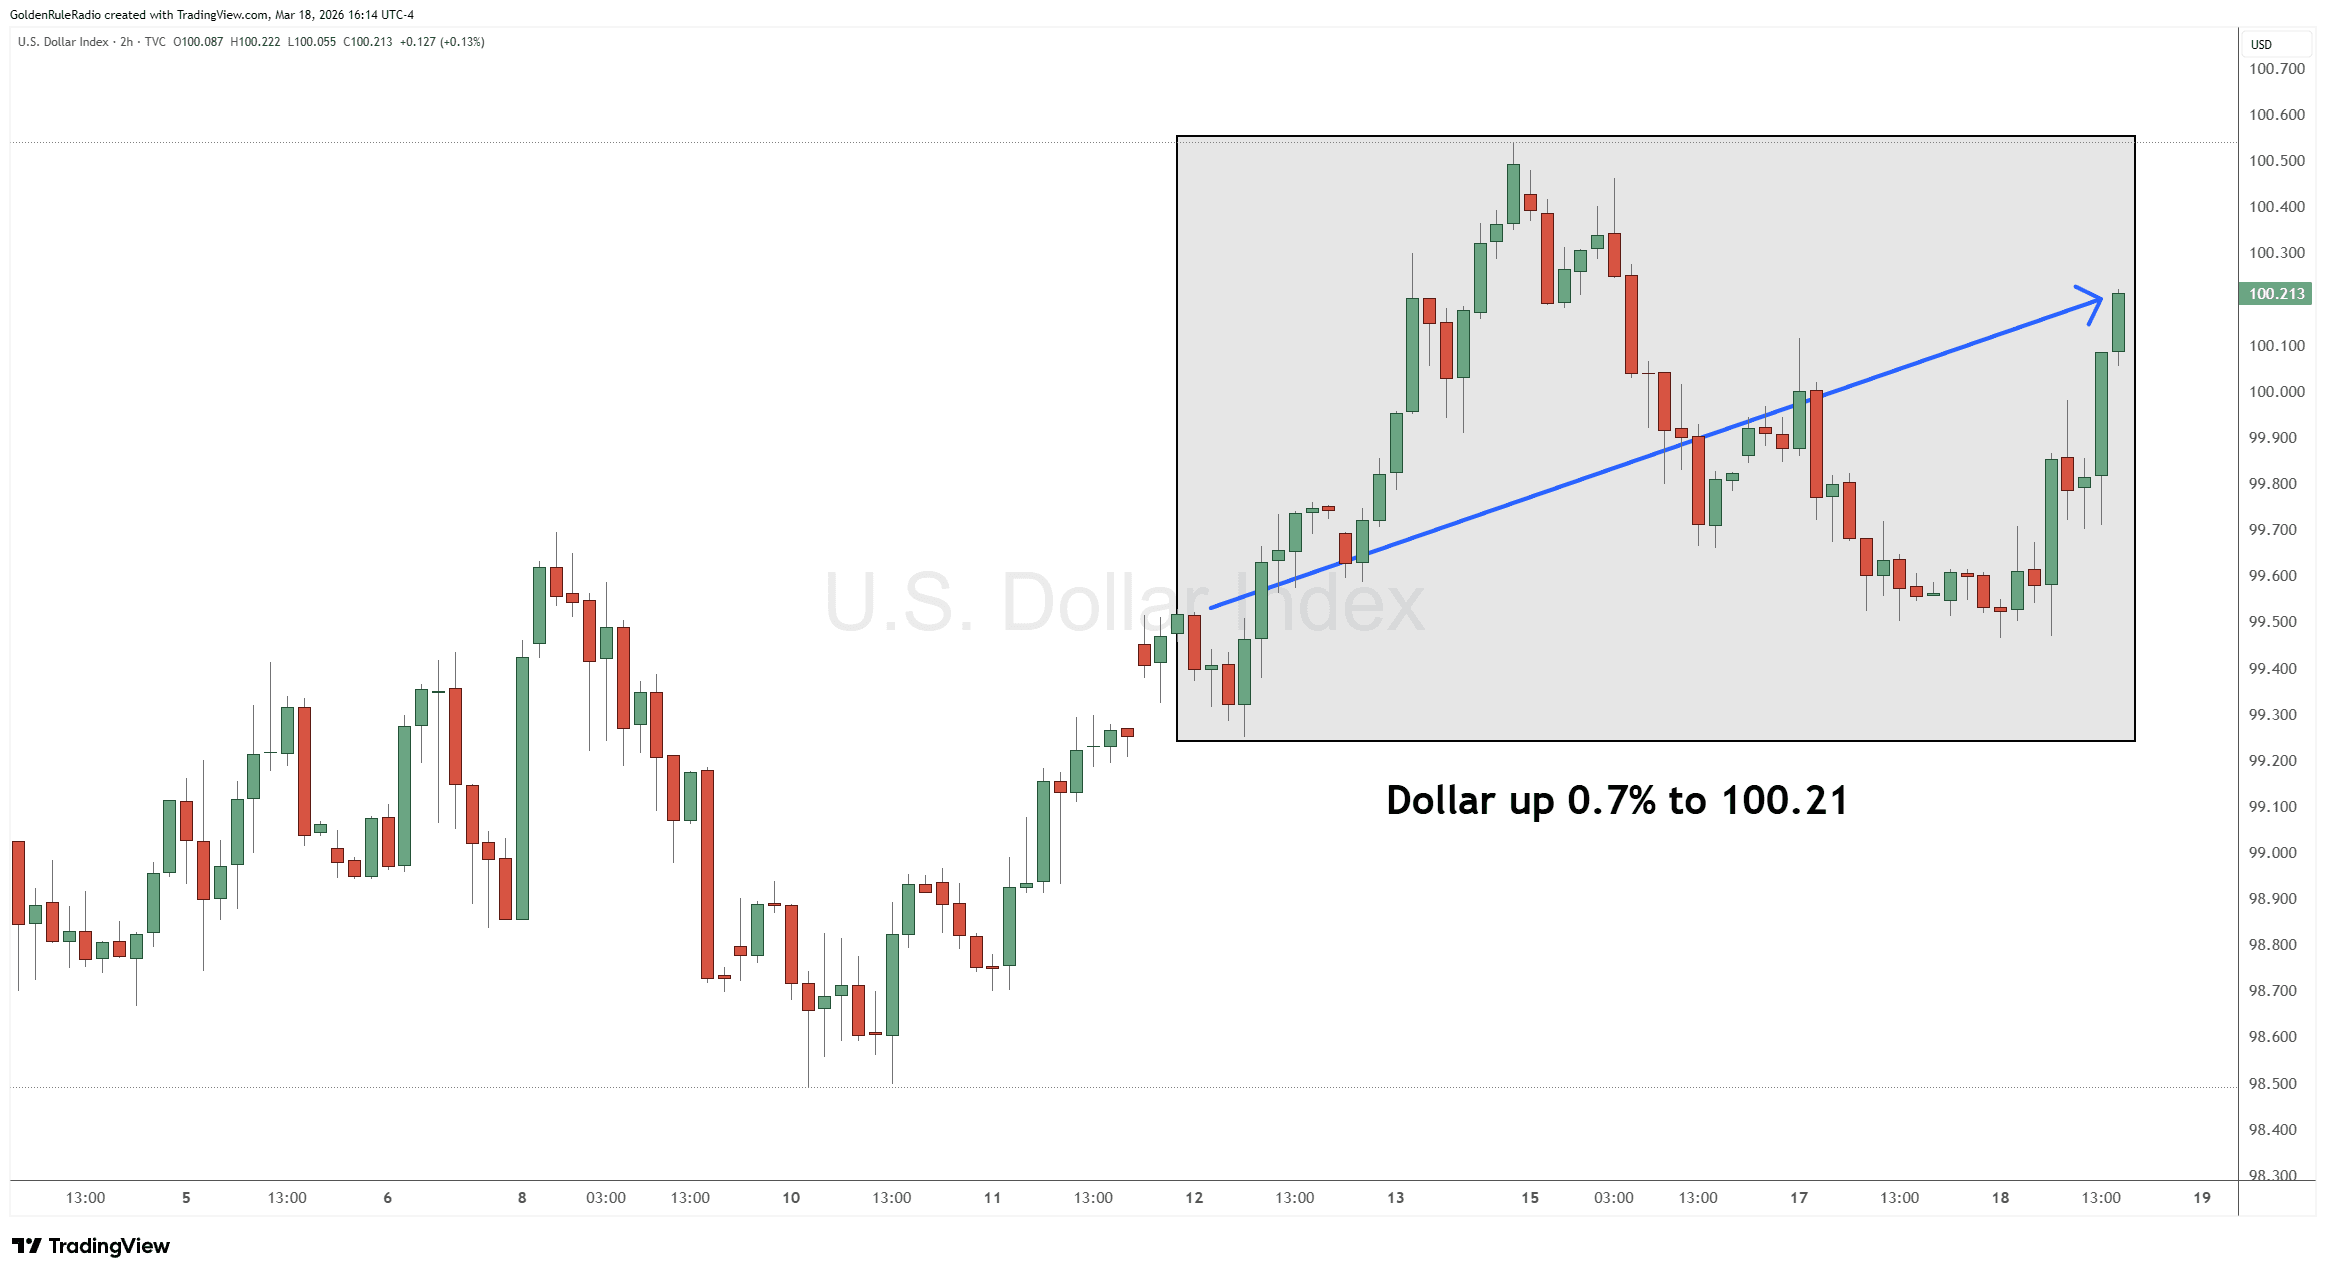
Taking a look over at the paper markets…
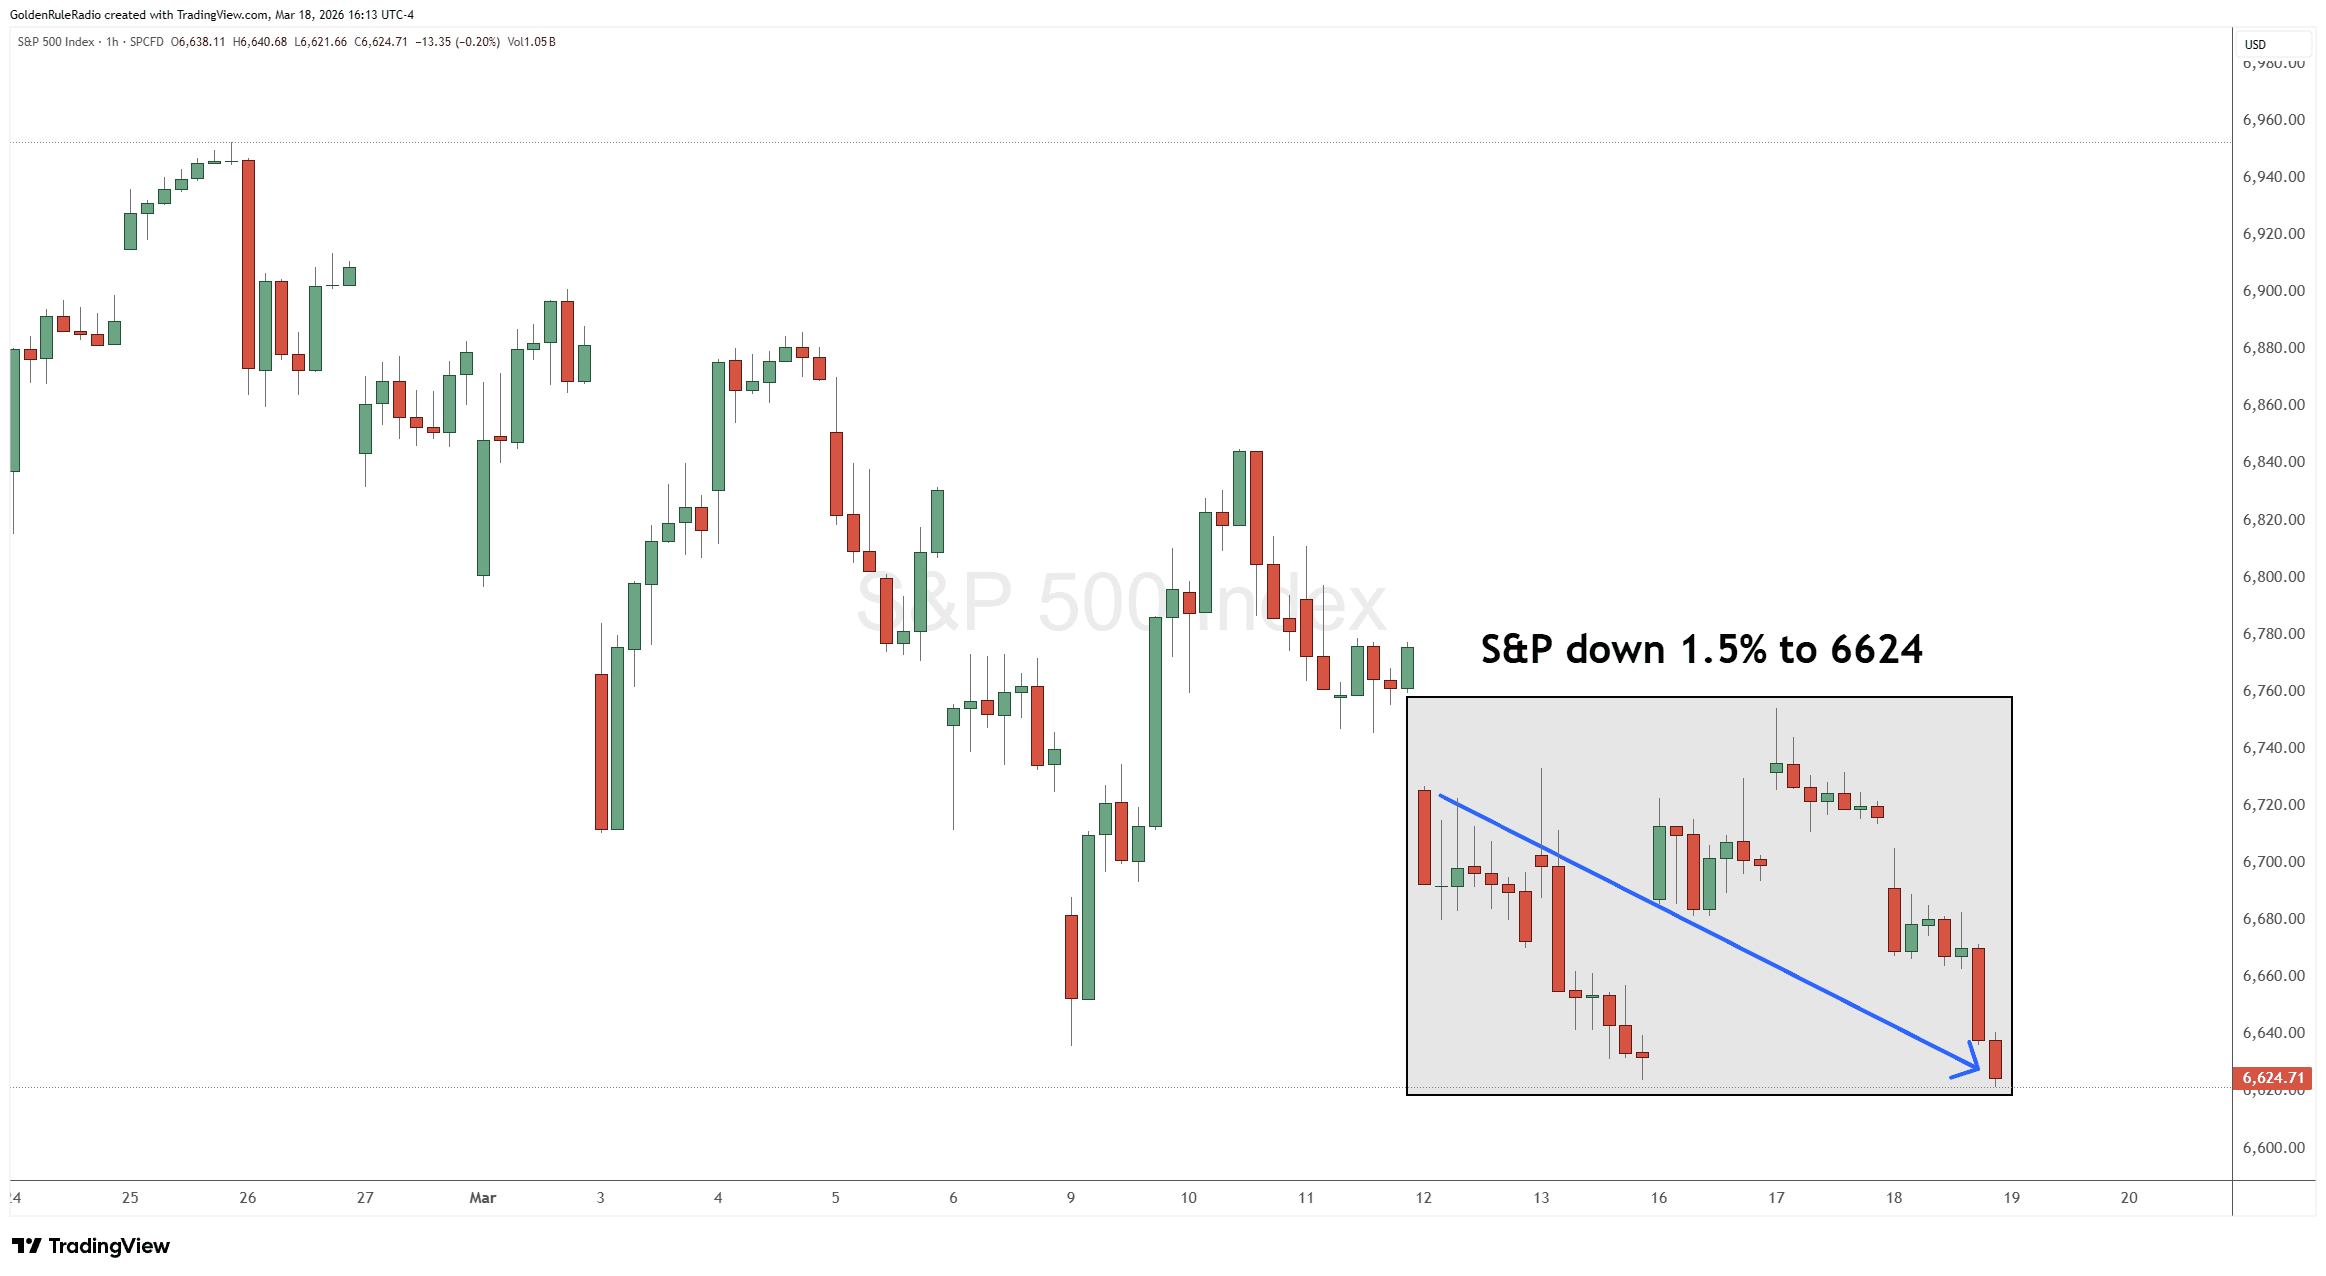
The S&P 500 is down 1.5% to 6,624 — which seems to be a running theme.
The US Dollar Index is up with everything else down, rising 0.7% and sitting at 100.21 from a week earlier.
Sharp Pullback in a Rising Bull Market
Over the last week, gold dropped about 6%, with most of that move—around 3.75%—hitting in a single trading day. Silver fell even harder, down about 10% to the mid‑$70s, again with roughly half of that decline occurring in one session as volatility spiked. Technically, gold has broken a short‑term rising channel but is still tracing a longer‑term uptrend that began near $3,300 last August, with potential “stair step” support zones in the mid‑4,000s and around prior highs near $4,300.
The key takeaway is this is a correction within a larger advance, not a reason to abandon core holdings. In past cycles, similar breaks inside bull markets have created some of the best entry and add‑on opportunities for long‑term holders who were willing to buy into weakness rather than chase strength.
Dollar Spike, Oil Surge
The immediate backdrop to the metals selloff is a sharp rally in the U.S. dollar index back above the psychologically important 100 level. The index jumped roughly 0.7% on the day and posted one of its bigger short‑term moves in recent months.
At the same time, crude oil surged around 4% in a single session, pushing back over $100 per barrel, amplifying concerns that the ongoing Iranian conflict and elevated energy prices could entrench stagflation. Historically, a stronger dollar tends to pressure gold in the short run, but persistent oil‑driven inflation and economic slowdown often ultimately favor hard assets over financial assets.
Why “Selling Gold Into Dollars” Is The Wrong Trade
Since 2020, M2 money supply has expanded by roughly 45%, or about $7 trillion. So each new dollar buys a little less of your real life every year — even if the dollar index looks “strong” versus other weakening currencies. Against that backdrop, cash, Treasurys, and richly priced equities all face the same problem: you’re holding claims on a system that keeps diluting itself.
When your portfolio is aligned with our investment “triangle” — roughly one‑third in gold (with some silver), one‑third in liquid assets, and one‑third in growth and income — it still argues for maintaining, and in pullbacks modestly increasing, core metals exposure rather than taking profits to sit in cash.
Mounting Private‑Sector Stress
Beneath the market headlines, the private economy is flashing stress signals. Auto loans 60‑plus days delinquent have roughly doubled since 2021, reaching around 6.9%. Credit‑card delinquencies 90‑plus days past due are now worse than at any time outside the 2008 financial crisis. Business bankruptcies are accelerating to levels only seen during the dot‑com bust, the global financial crisis, and the Covid shock, as companies that borrowed cheaply for years now face refinancing at much higher rates.
This combination is exactly why political pressure is building for lower rates and more liquidity. Lower nominal rates and more money creation might offer temporary relief, but they further undermine the long‑term purchasing power of the dollar, reinforcing the strategic case for holding real assets like physical gold and silver through the turbulence.
Corrections Before New Highs
The current downdraft in metals prices closely rhymes with what happened during the 2008 financial crisis and the 2020 Covid shock, when gold and silver were initially sold hard alongside equities only to reverse violently higher once the dust began to settle.
In 2008, gold dropped sharply during the liquidation phase, then went on to set new all‑time highs within roughly two years; in 2020, the timeline from panic selling to fresh highs compressed to mere months. Today, even after this week’s slide, gold remains up more than 11% year‑to‑date—a return that would have counted as an excellent full year not long ago.
Plan Your Next Buy
The team at McAlvany Precious Metals has a collective 75 years experience investing in the precious metals market. We are happy to speak with you about your precious metals investing goals on a no-obligation, complimentary consultation. Reach out to us at 800-525-9556.