Podcast: Play in new window
Gold’s violent late‑January selloff looks scary on a price chart, but the bull market is intact. Smart money is still accumulating, and this pullback is a rare chance to upgrade and add ounces on sale.
Let’s take a look at where precious metals stand as of Wednesday, February 4:
The price of gold is down 11%, sitting at $4,960. 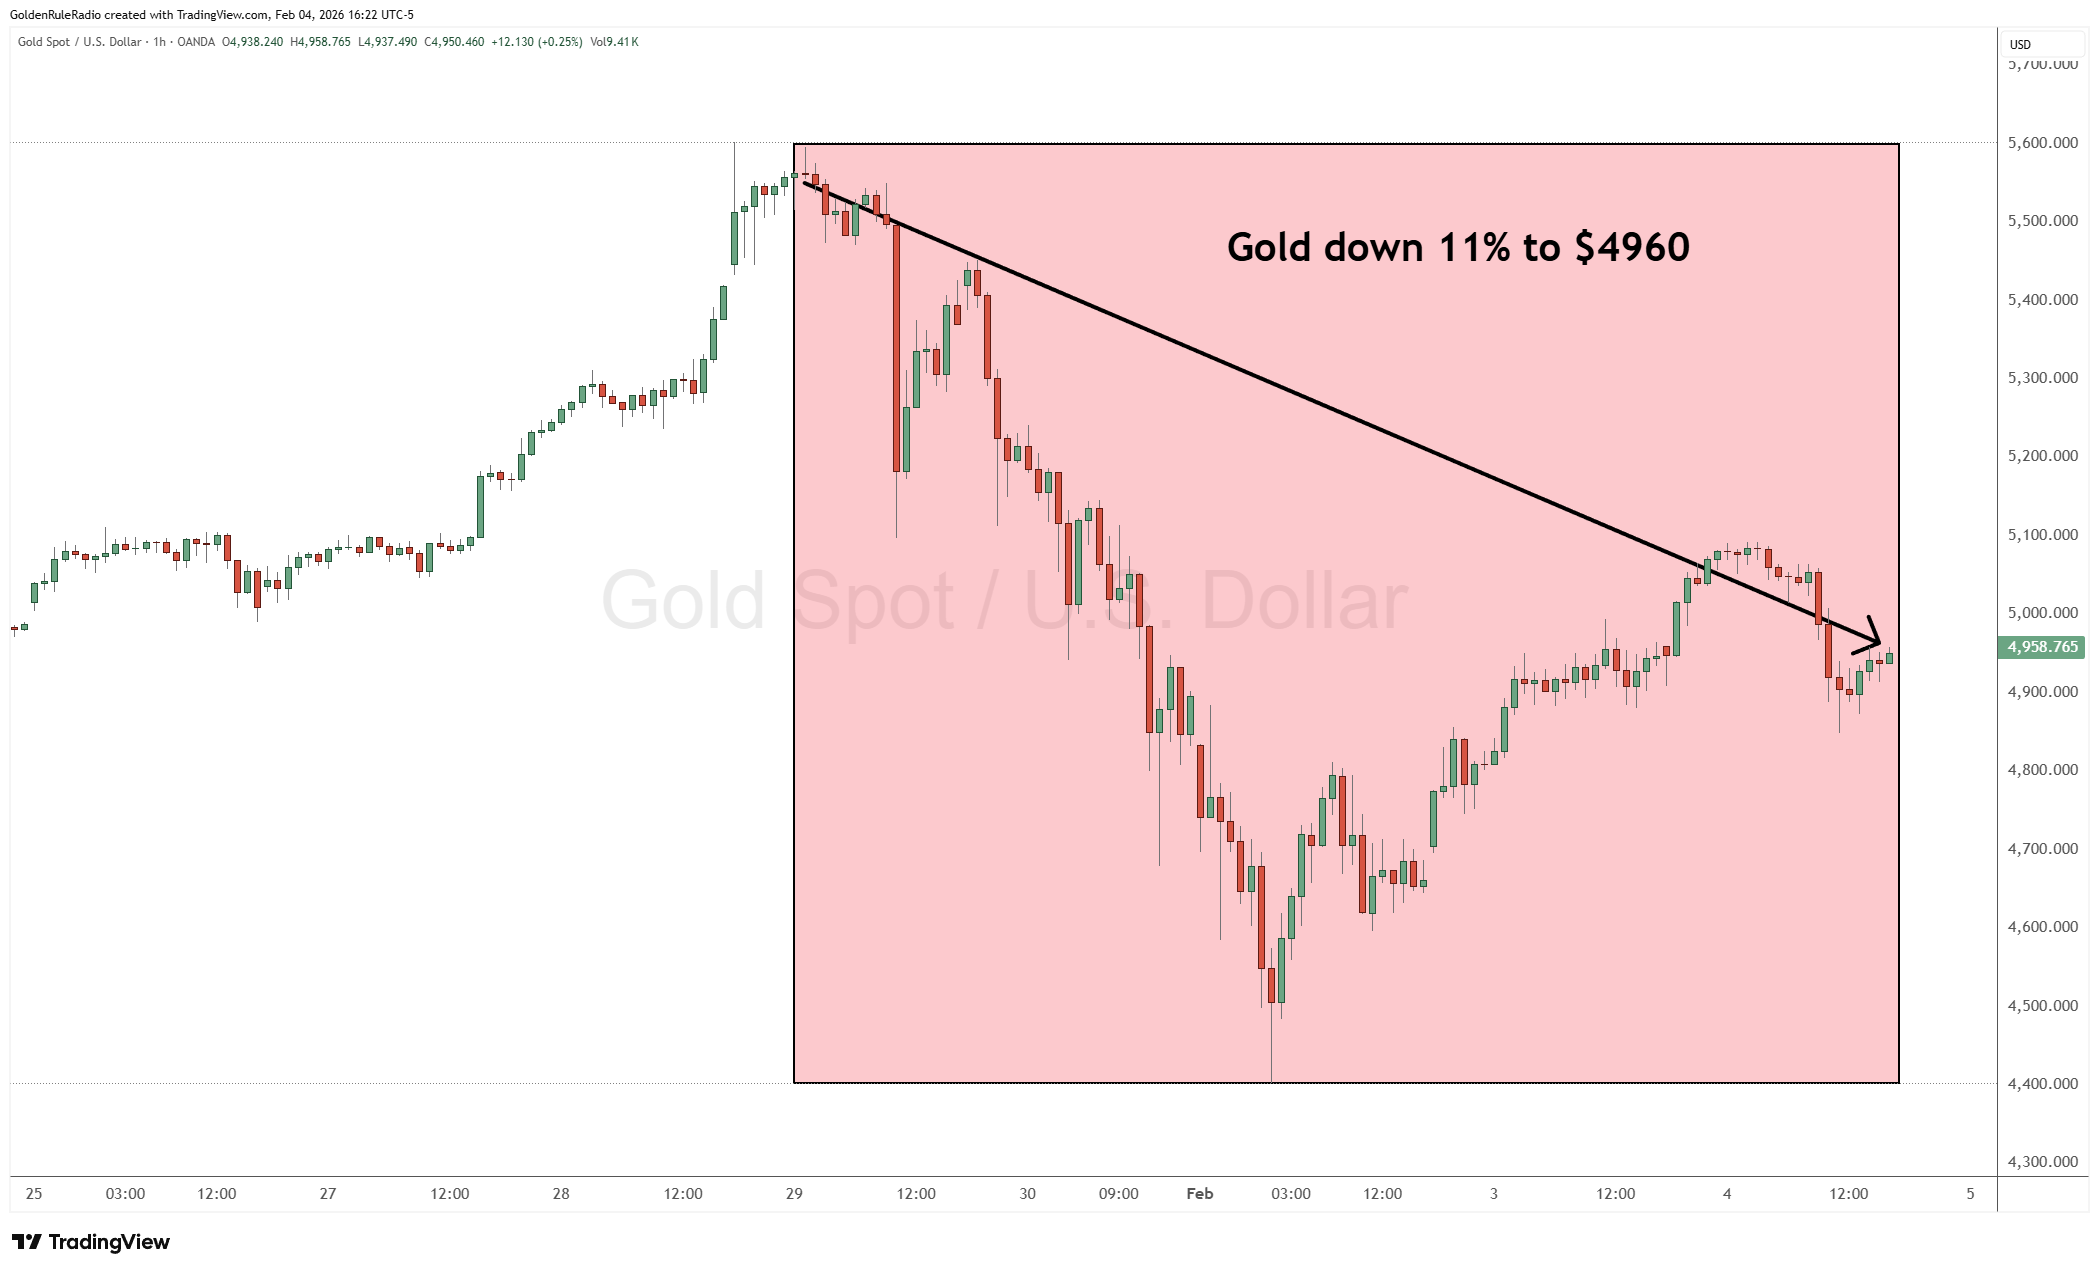
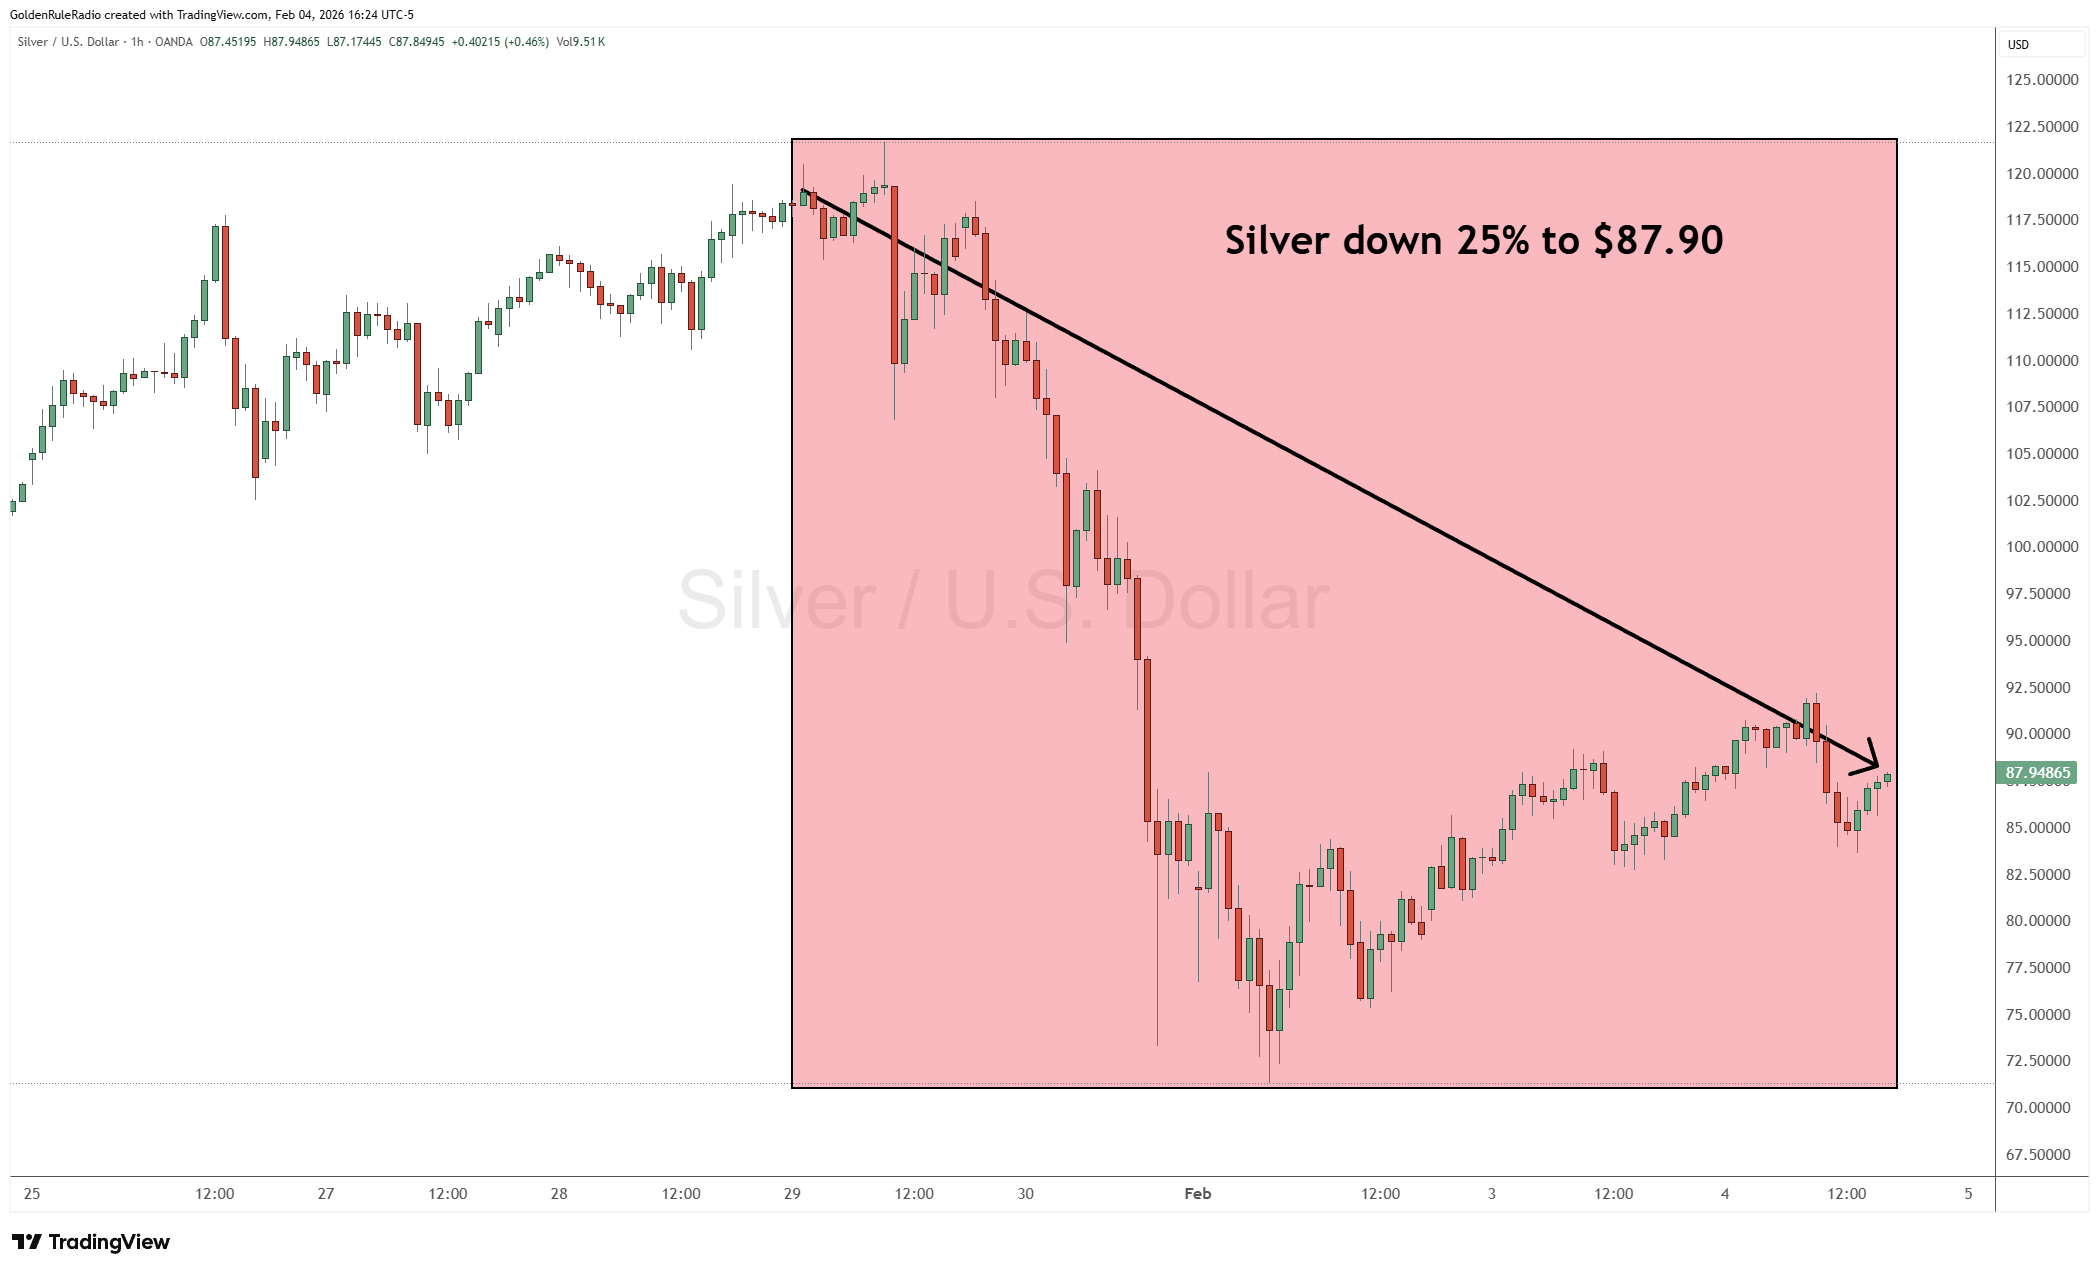
The price of silver is down 25%, currently sitting at $87.90.
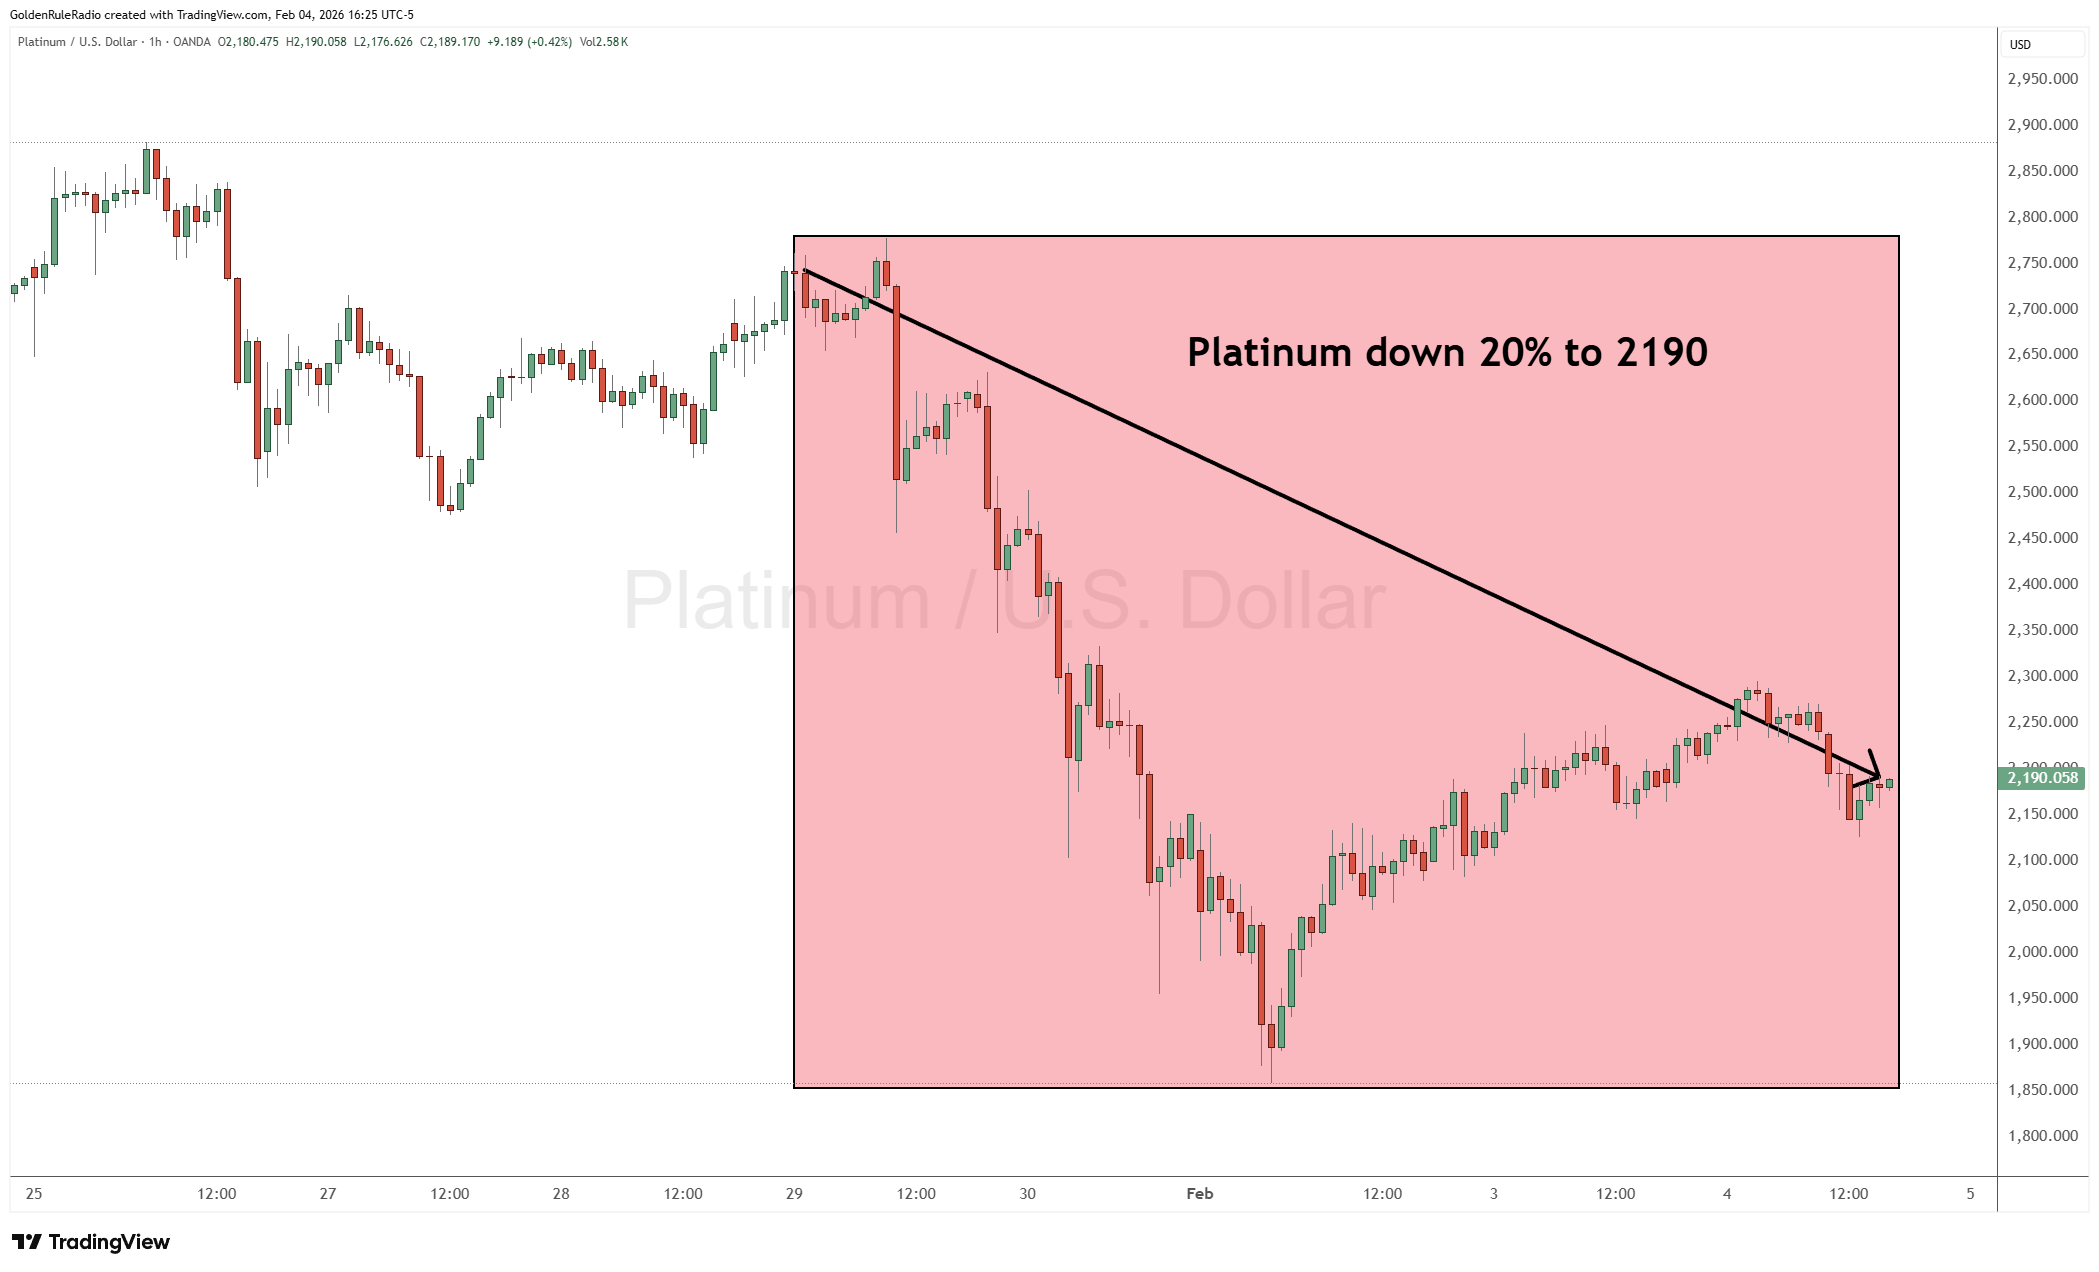
Platinum is down 20%, sitting at $2,190.
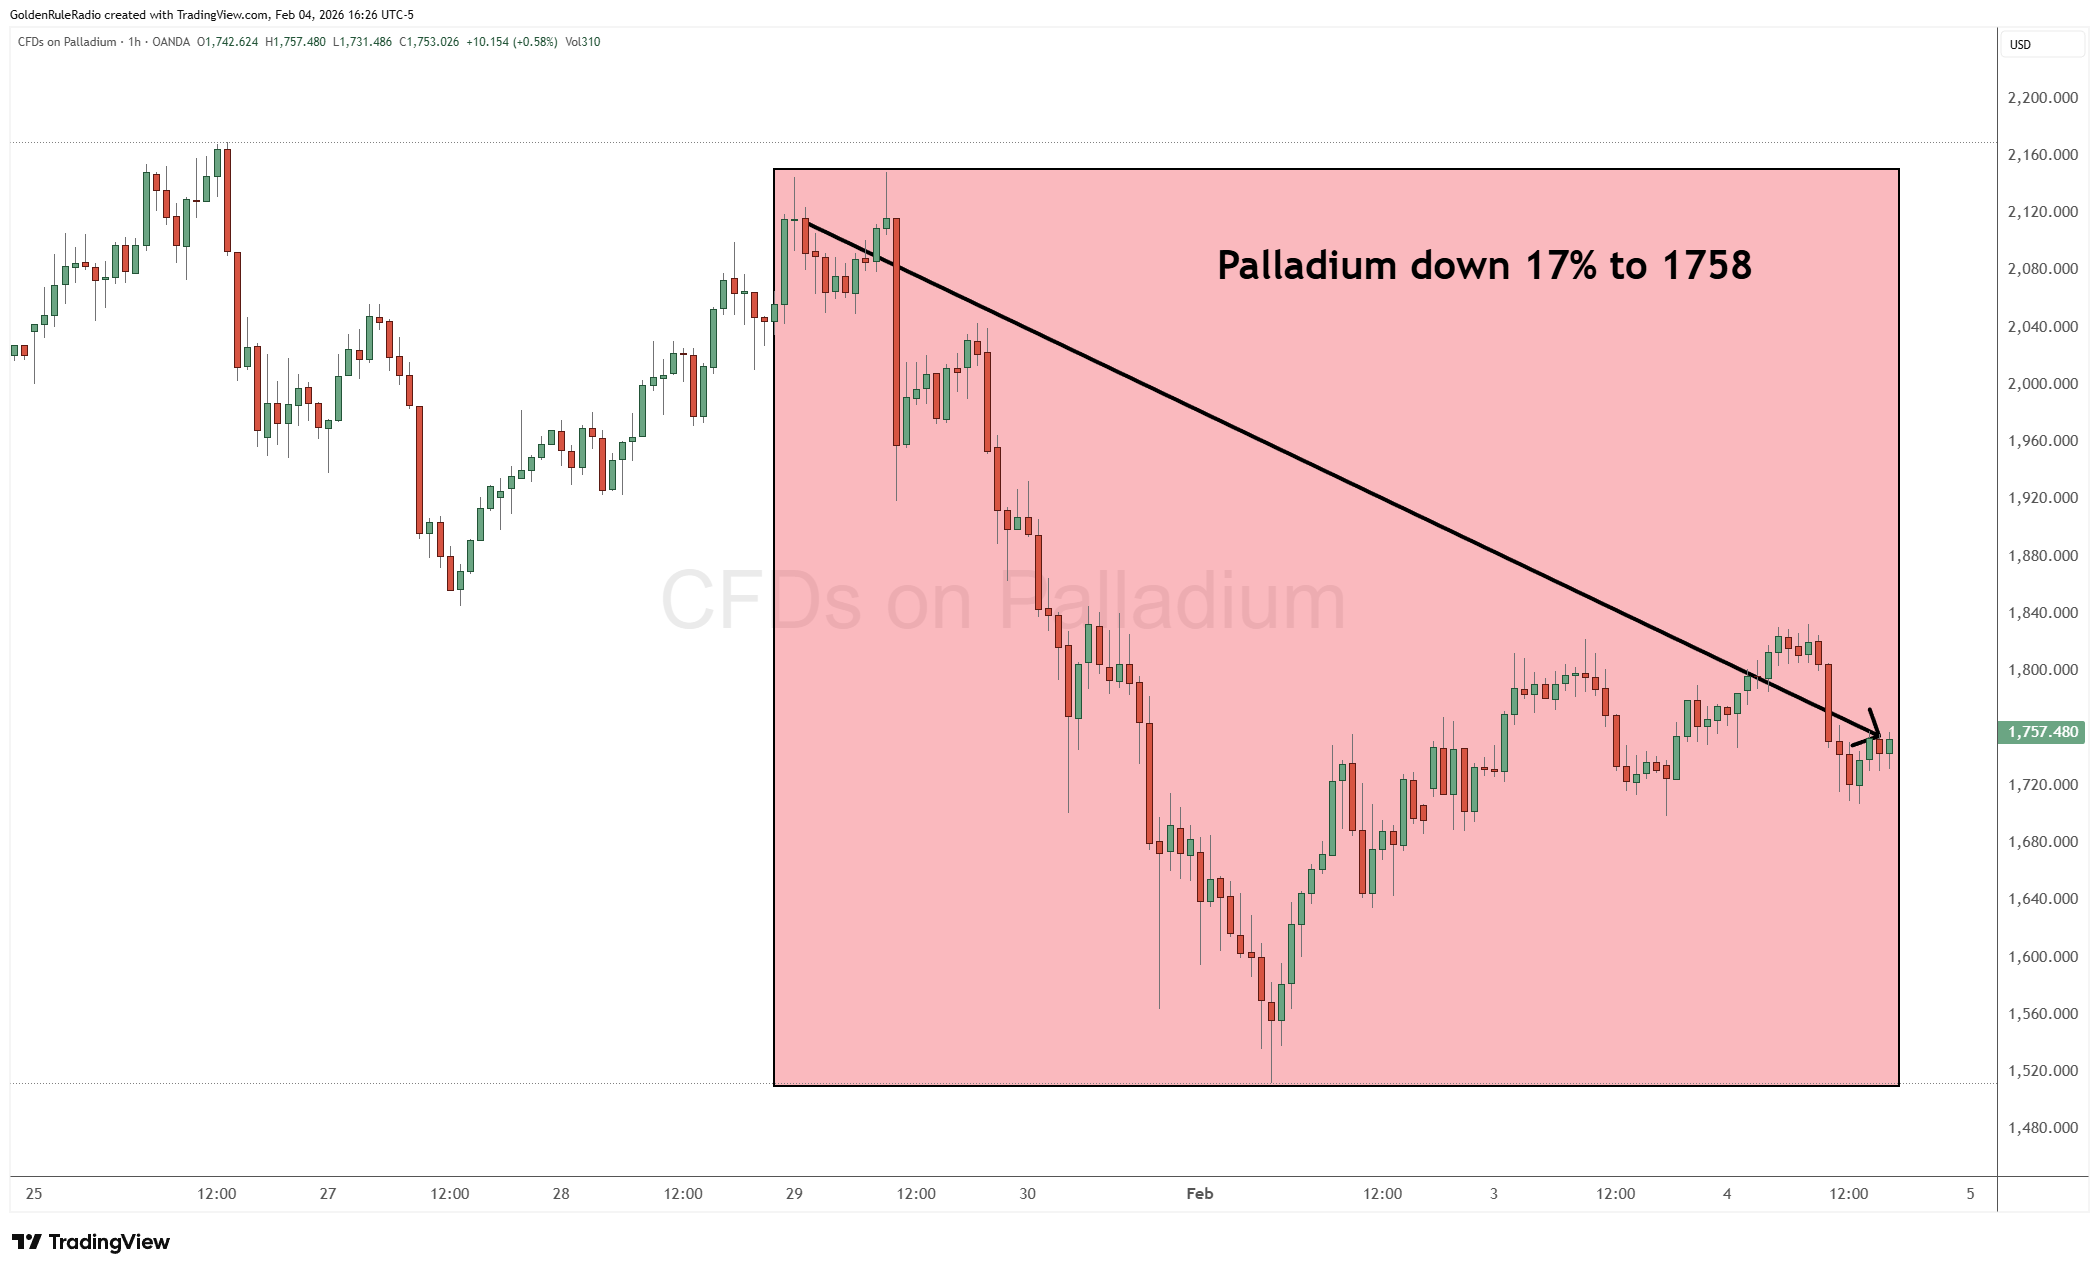
And palladium is down 17% and sitting at $1,758.
Looking over at the paper markets…
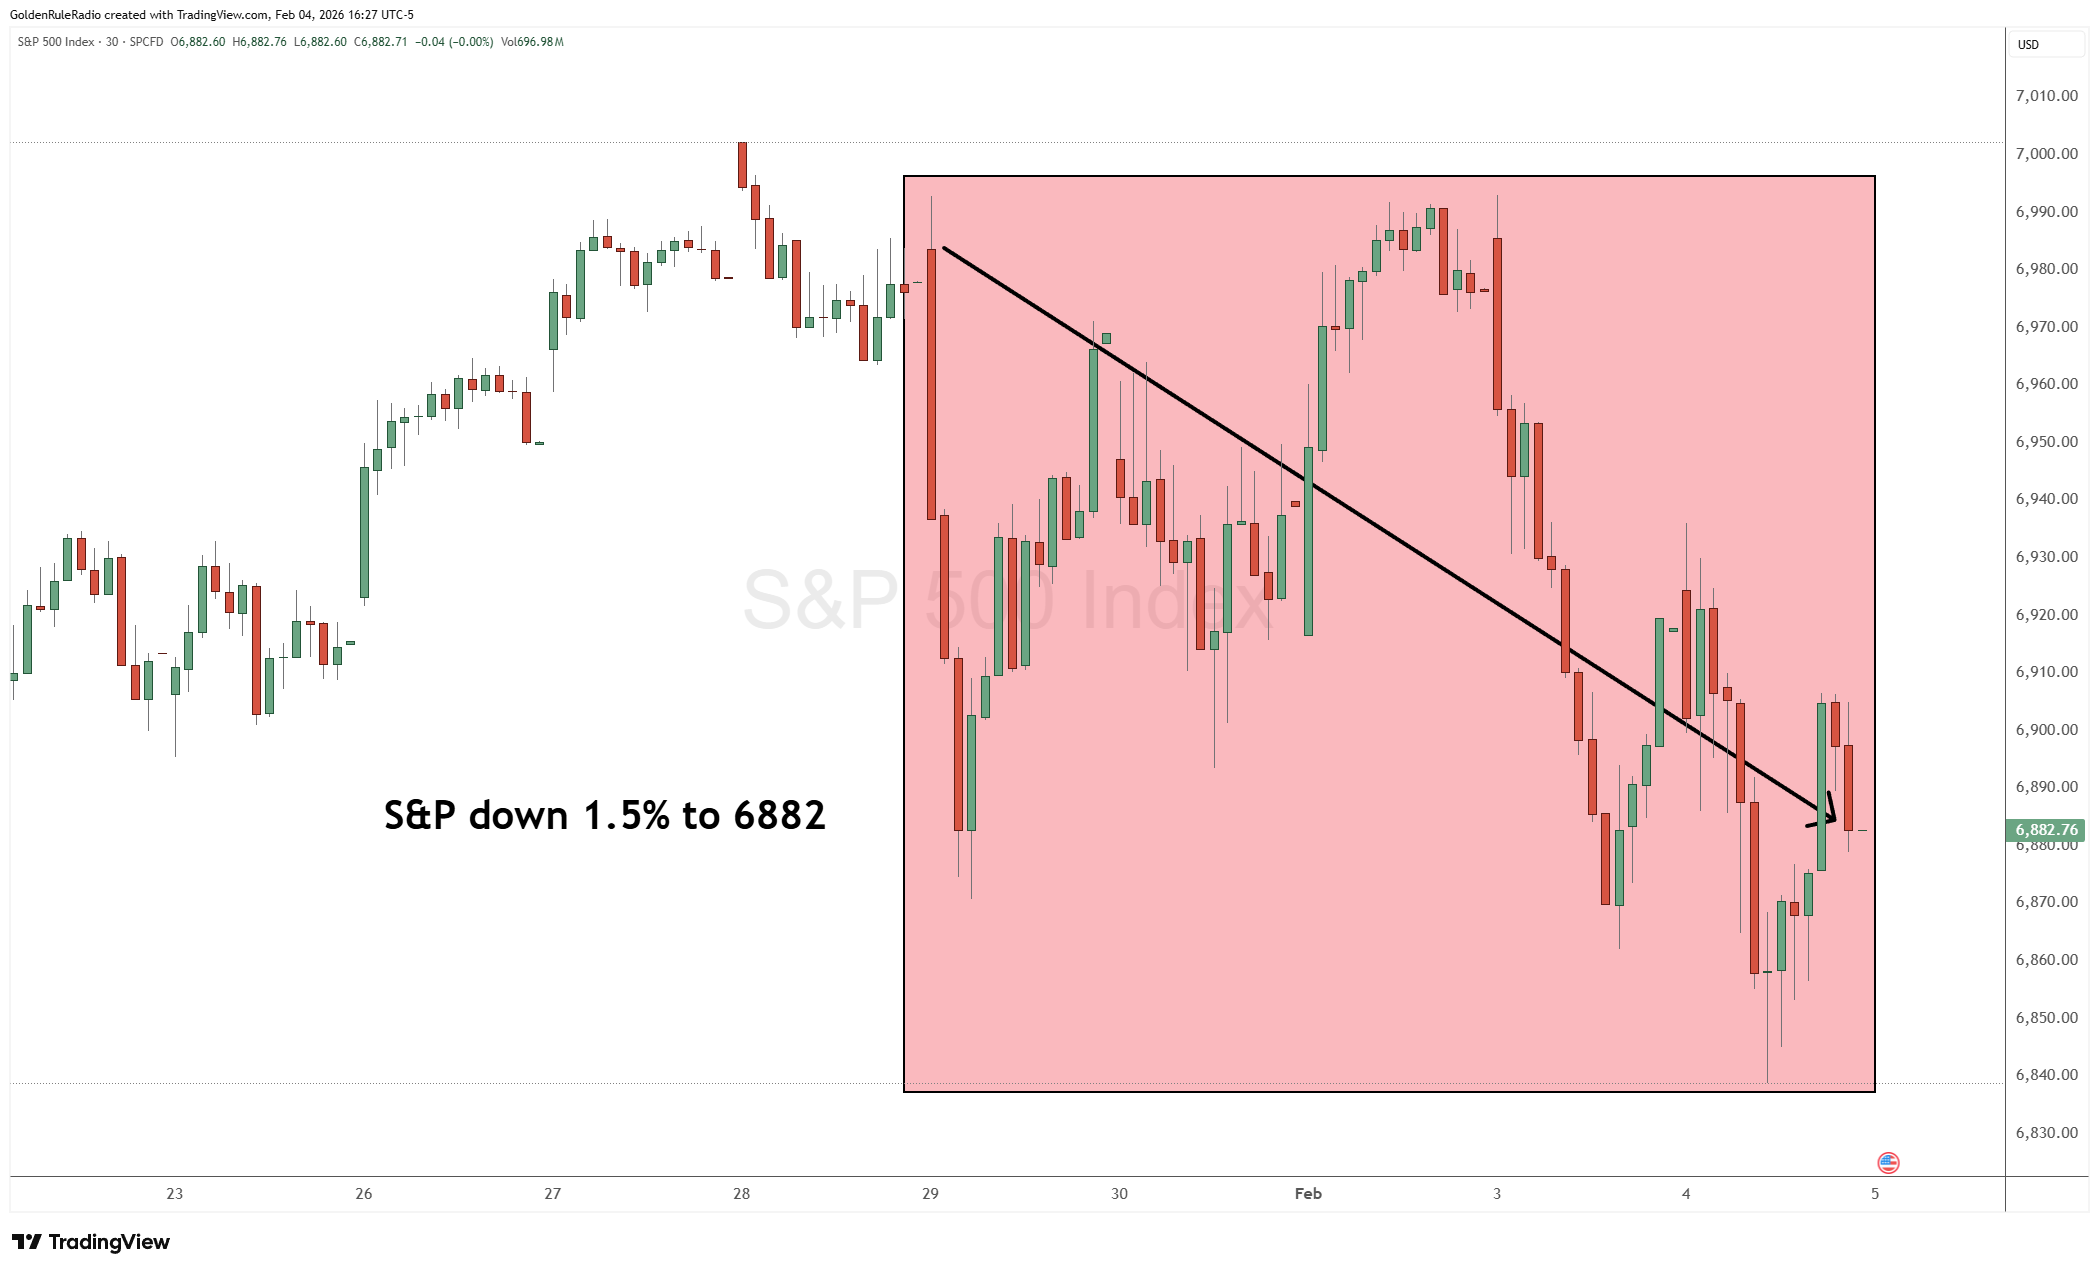
The S&P 500 is down about 1.5%, currently sitting at 6,882.
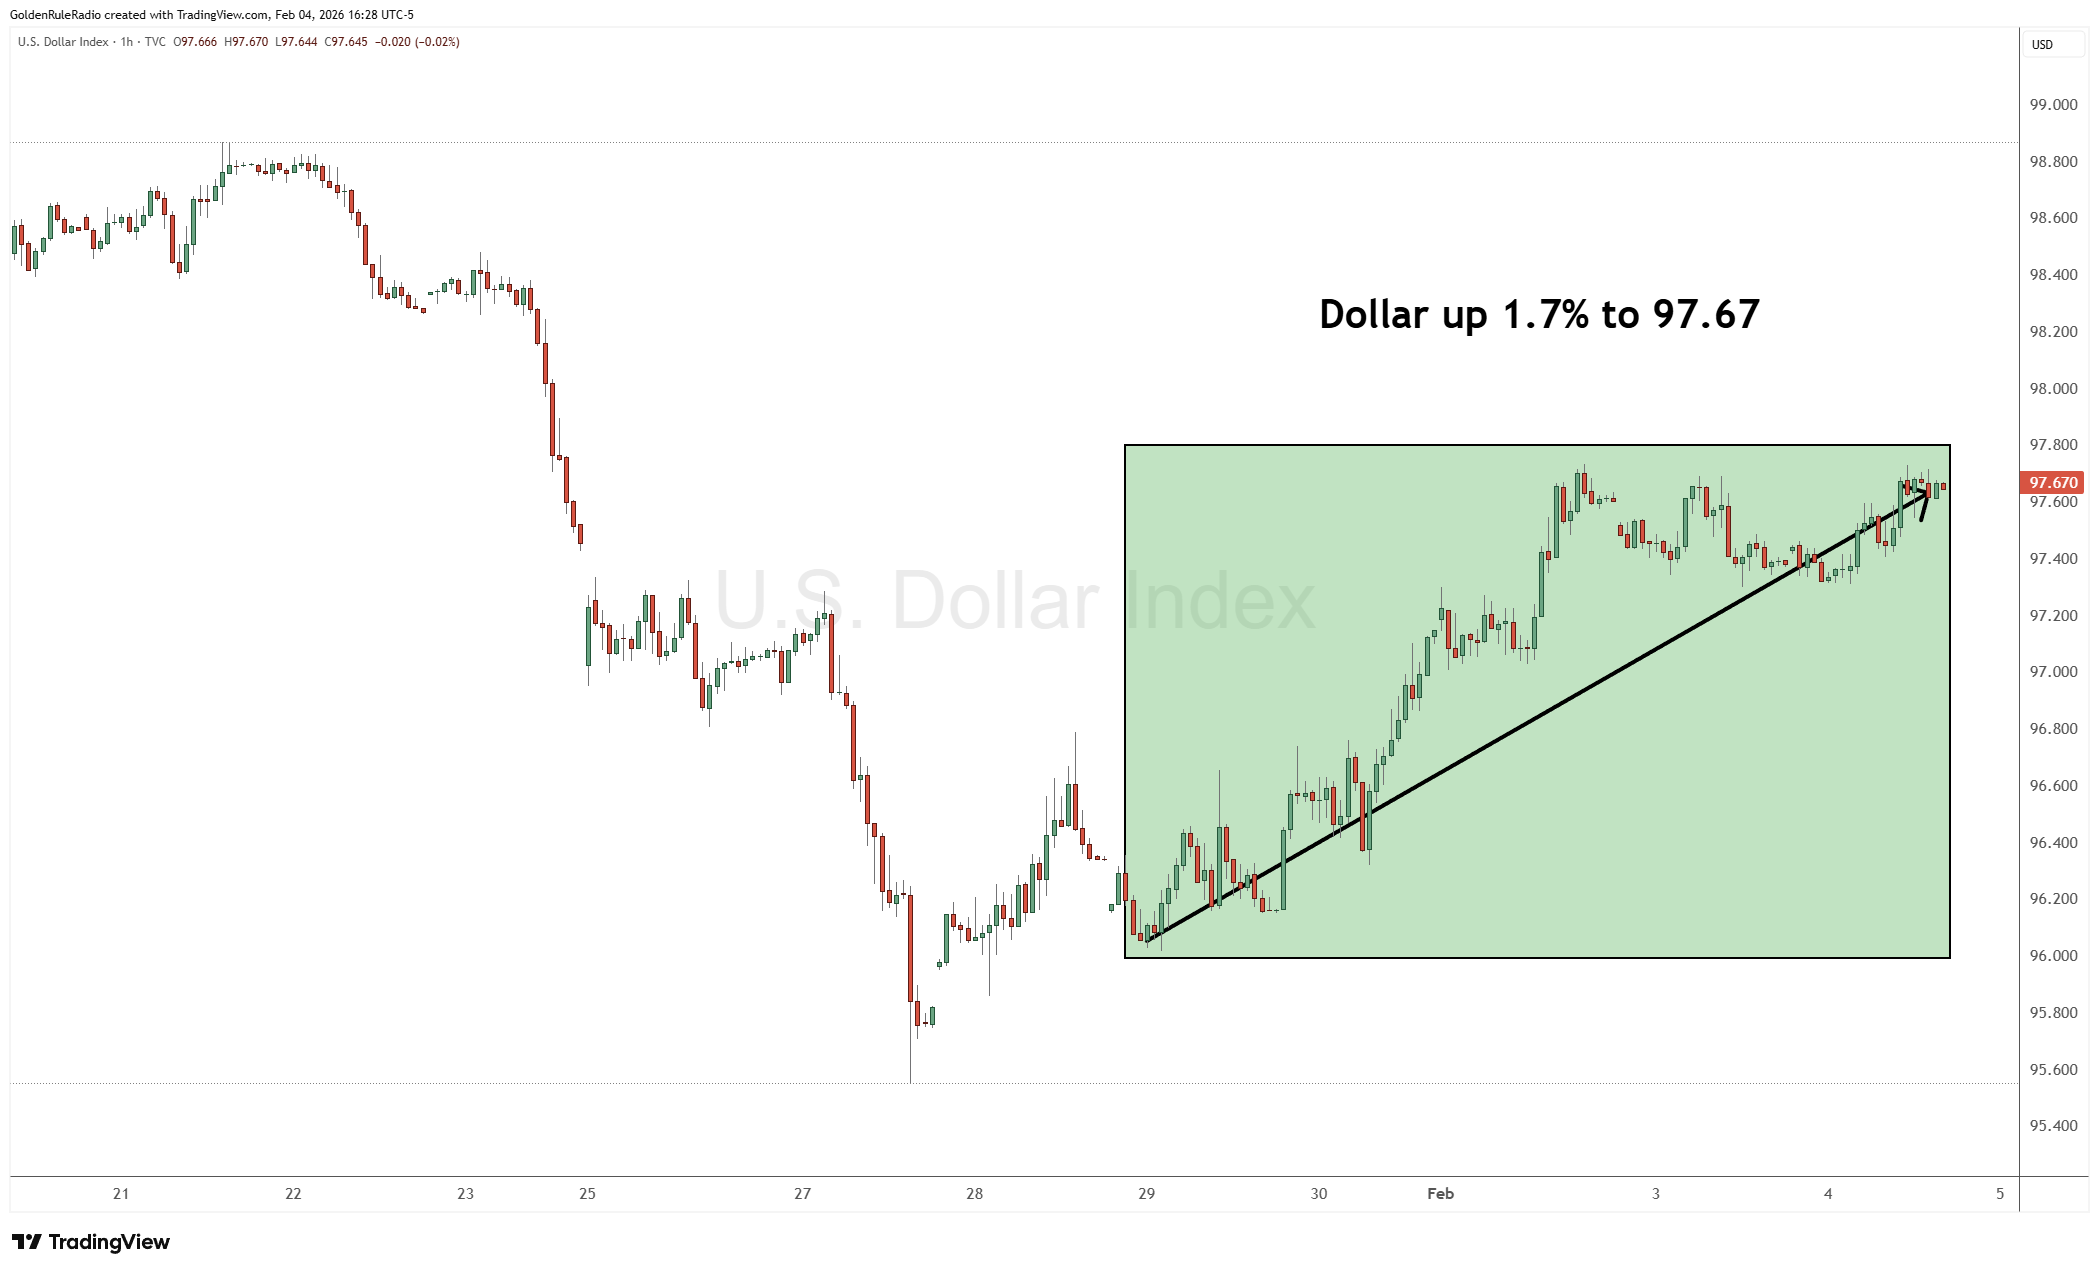
And the US dollar index rose up 1.6% to 97.67 on the dollar index.
A “Crash” Inside a Massive Uptrend
Gold hit a new all‑time high around $5,600 on January 29, then dropped roughly $1,200 in two trading days before bouncing sharply. From peak to trough, gold fell about 21–22%, but as of the podcast date it had already rallied back roughly 16% off the low, leaving it “only” about 11% down on the week.
Silver’s move was even more dramatic: from about 47 in early November to roughly 121 in three months (a near tripling), then down ~25% on the week, yet still sitting in the high‑80s to low‑90s and remaining the best‑performing major asset in the U.S. for 2026 year‑to‑date.
In other words, this was not gold or silver “going to zero”; it was a sharp correction after an extraordinary melt‑up layered on top of an already huge multi‑year bull market in metals.
What Actually Triggered The Selloff?
We see two key catalysts that kicked off a classic “snowball” move:
- China halted trading in five silver and commodity funds “to limit risk amid volatility” and “maintain the stability of the capital markets,” effectively stomping on the market at the peak.
- The next day, the CME Group raised silver margin requirements for the fourth time, forcing out leveraged longs and triggering margin calls and stop‑loss cascades.
This combination delivered a waterfall move: once forced selling begins, each layer of margin calls begets more selling, and the market overshoots on the downside before stabilizing.
The key takeaway is that the crash was mechanically driven by leverage and policy moves, not by a fundamental collapse in monetary demand for metals.
Where The Charts Say We Are Now
Even if you don’t trade off charts, it helps to know what we’re watching:
- Silver’s three‑month run from $47 to $121 was followed by a textbook corrective drop right into a major support cluster: the 50‑day/100‑day moving average zone and a 61.8% Fibonacci retracement area around the mid‑70s.
- From there, silver bounced and now appears to be settling into a trading range roughly between the 61.8% and 38.2% retracement levels, which we peg around about 75–93.
- On a larger timeframe, even an extreme washout into the low‑60s would still leave silver investors with very large gains from the 40s; the “damage” is mainly to recent late‑entry speculators.
- Gold’s medium‑term retracement has been far tamer than silver’s: from an August low near $3,300 up to $5,600 (about +70%), with the pullback only briefly touching roughly the 50% retracement level before stabilizing near shorter‑term moving averages.
Practically speaking, this looks like a deep, healthy correction after a euphoric spike, not the end of the bull market. If you’re looking for good entry points, we see the current band (roughly $75–$85 on silver and mid‑$4,000s on gold) as an attractive buy‑the‑dip zone.
Where We Are in The Bull Market Cycle
Over the last decade, most of the marginal demand has come from “gold people buying gold”: central banks (notably China), institutions, and long‑term allocators quietly accumulating, not the general public flooding in.
You can see this major bull market breaking down into three phases:
- Consolidation — From 2015–2018 bear bottom and basing
- Growth — our current phase, where gold has effectively gone 5x from its 2015 lows and silver even more
- Mania — a future phase where mainstream investors, pushed by stress elsewhere—equities, bonds, rates, geopolitics—finally chase metals.
We are essential at “the end of the beginning,” not the end of the cycle. Most buyers are still the early, informed crowd, and the event that forces the public into metals en masse has not yet occurred.
What this means for you: volatility like this is part of the growth phase, and it tends to precede—not follow—the eventual public stampede.
Your Next Move
So how should you react to this move?
As we always recommend, stay on course. Keep accumulating on a schedule, treating it as disciplined savings rather than a trading game (a form of dollar‑cost averaging).
View pullbacks as inventory opportunities, not existential threats. Many of us have added to our own positions into the decline, including upgrading into semi‑numismatics (e.g., $5 Indians, Morgan dollars) while spot is discounted.
Let ratios and structure guide swaps. The gold–silver ratio fell to about 46:1 before snapping back above the mid‑50s after silver’s harder fall, temporarily taking some accounts out of “ideal” ratio‑trade territory and reminding investors to “take some wins” instead of holding out for a perfect 15:1 fantasy print.
Here to Help
The team at McAlvany Precious Metals has a collective 75 years experience investing in the precious metals market. We are happy to speak with you about your goals on a no-obligation, complimentary consultation. Reach out to us at 800-525-9556.