

Podcast: Play in new window
Metals took another quiet step lower this week as gold, silver, platinum, and palladium all drifted down together. But the bigger story was the Fed’s decision to hold rates steady into a market that’s starting to wobble under AI-driven stress in Asia. Beneath a boring dollar chart and a modest pullback in the metals, the setup that has historically preceded gold’s biggest moves is quietly falling into place.
Let’s take a look at where prices stand as of Wednesday, July 29:
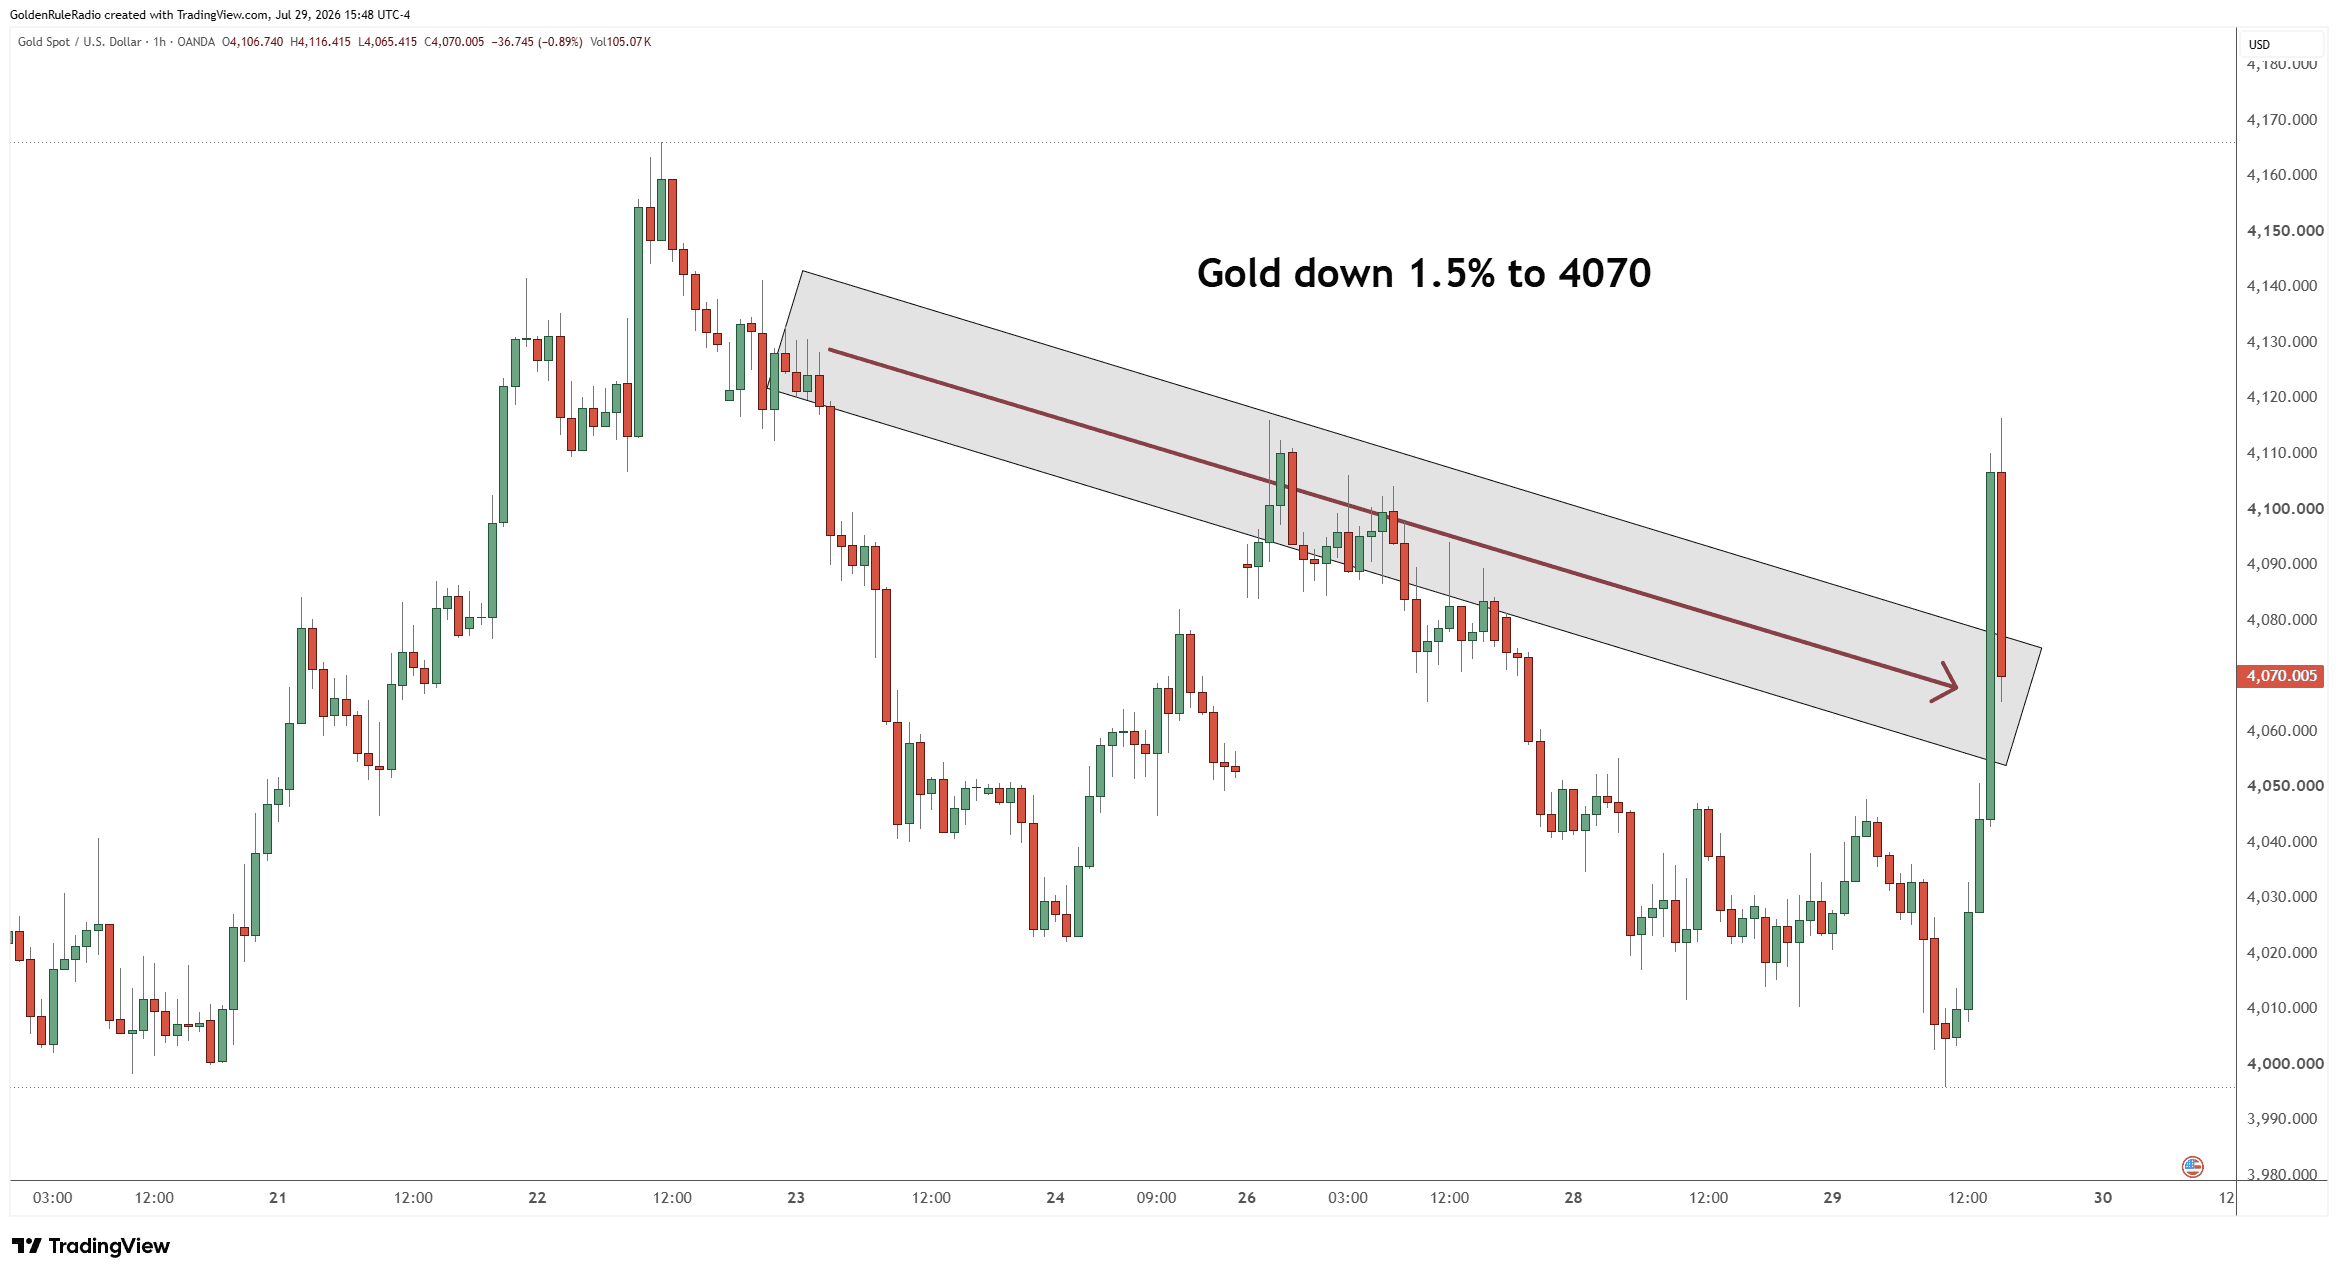
The price of gold is down about 1.5%, sitting at $4,070 after a week of bouncing up and down in a fairly tight range.
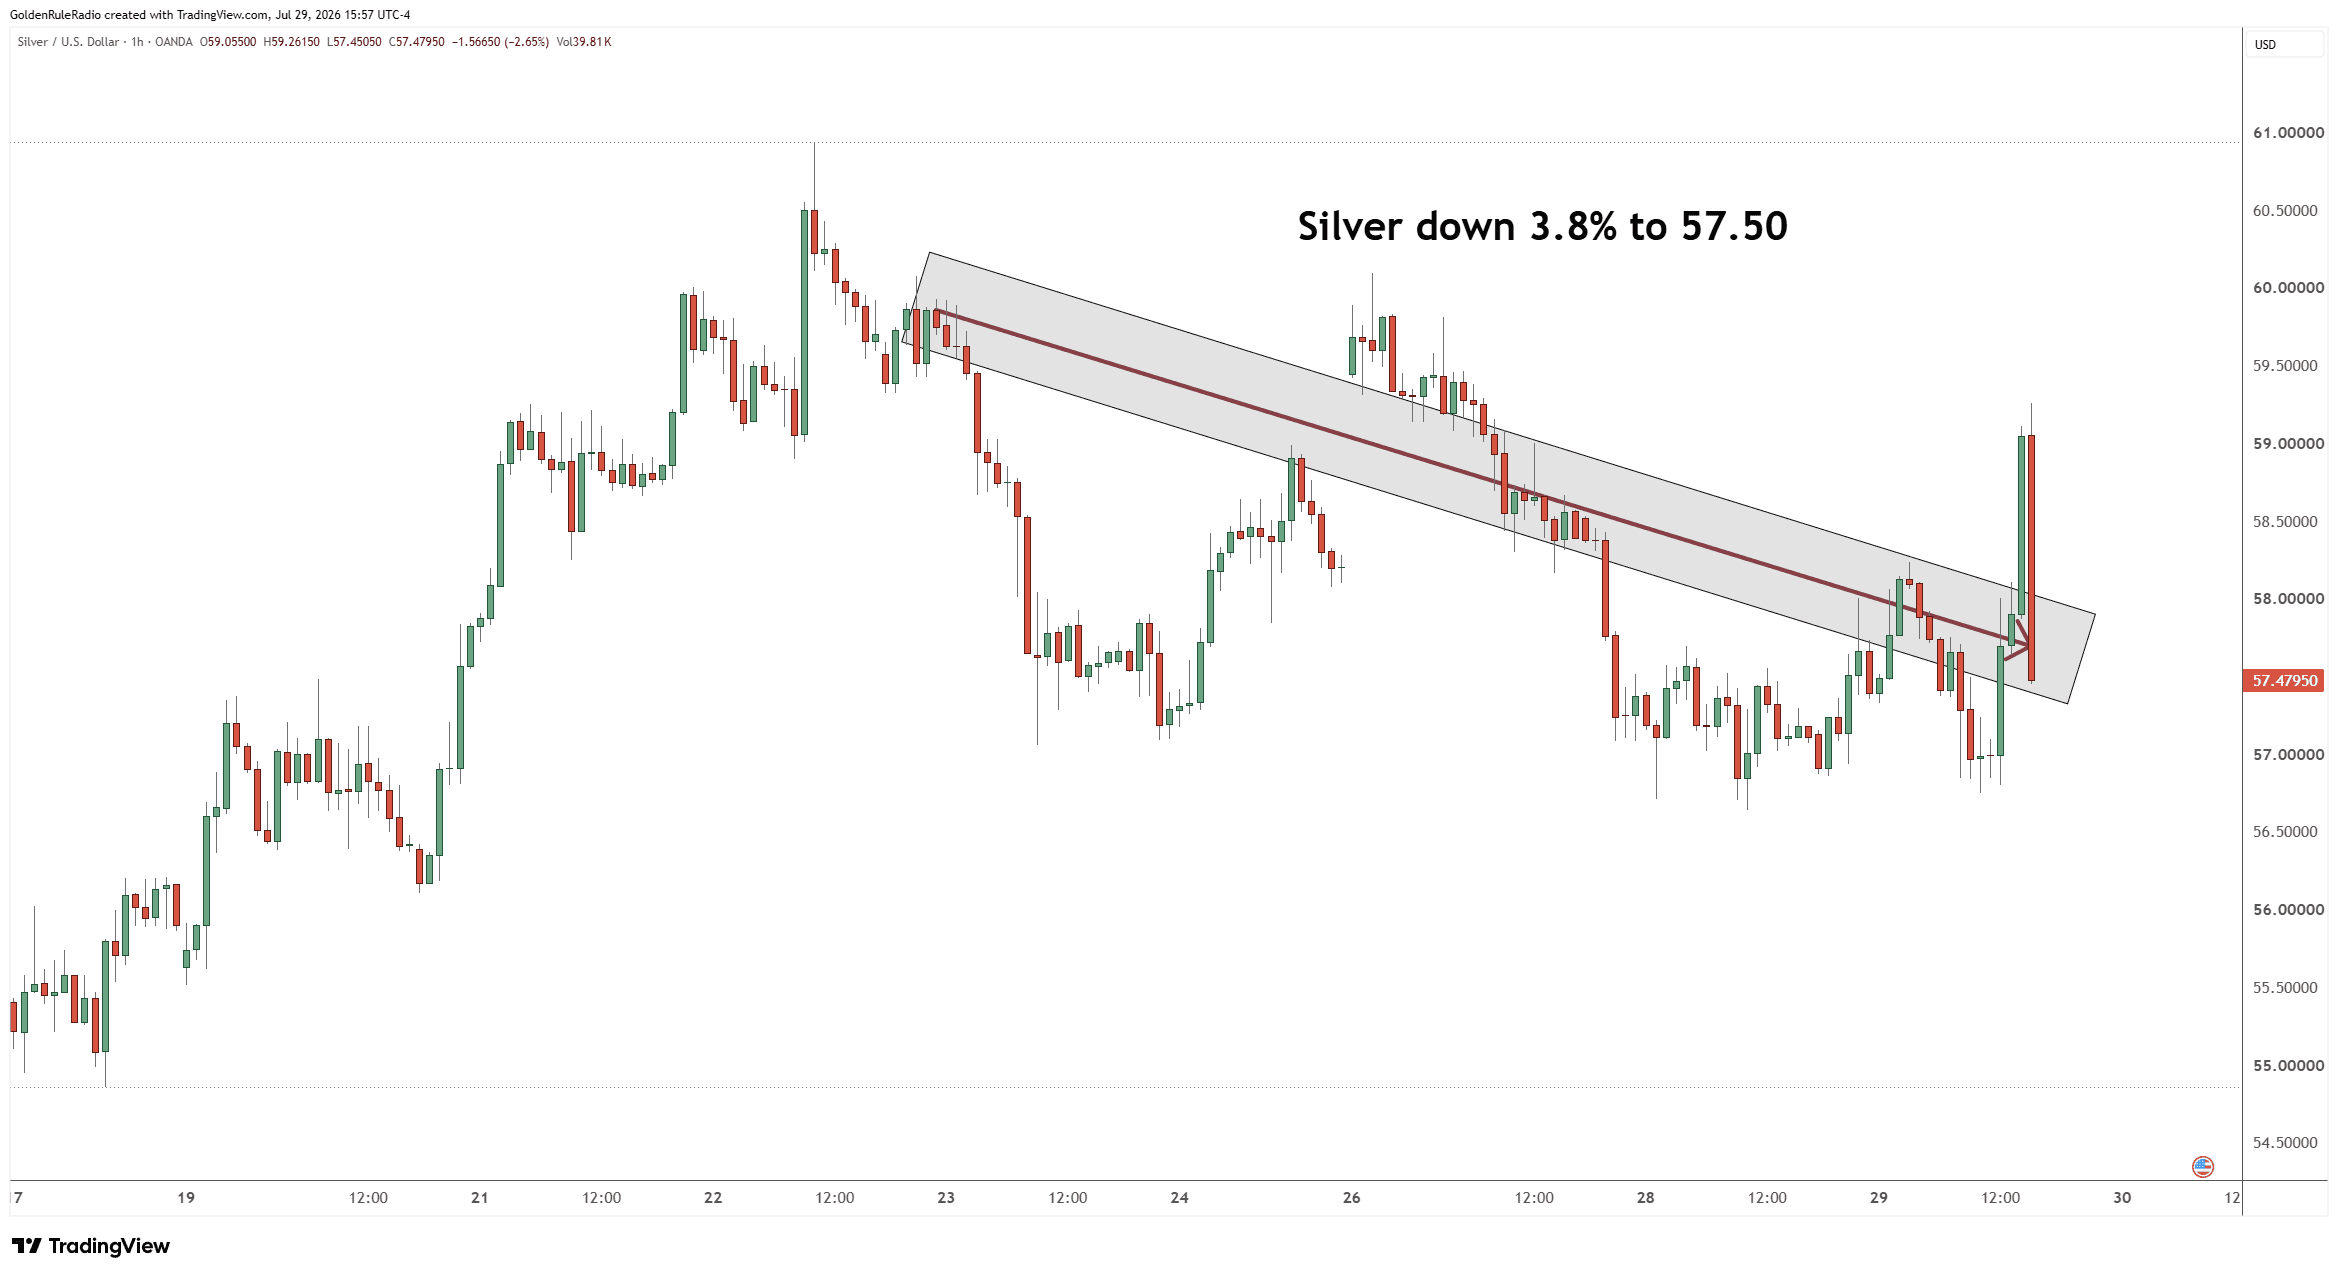
The price of silver is down about 3.8% at $57.50, right where it’s been parked for a while now in the high‑$50s to low‑$60s.
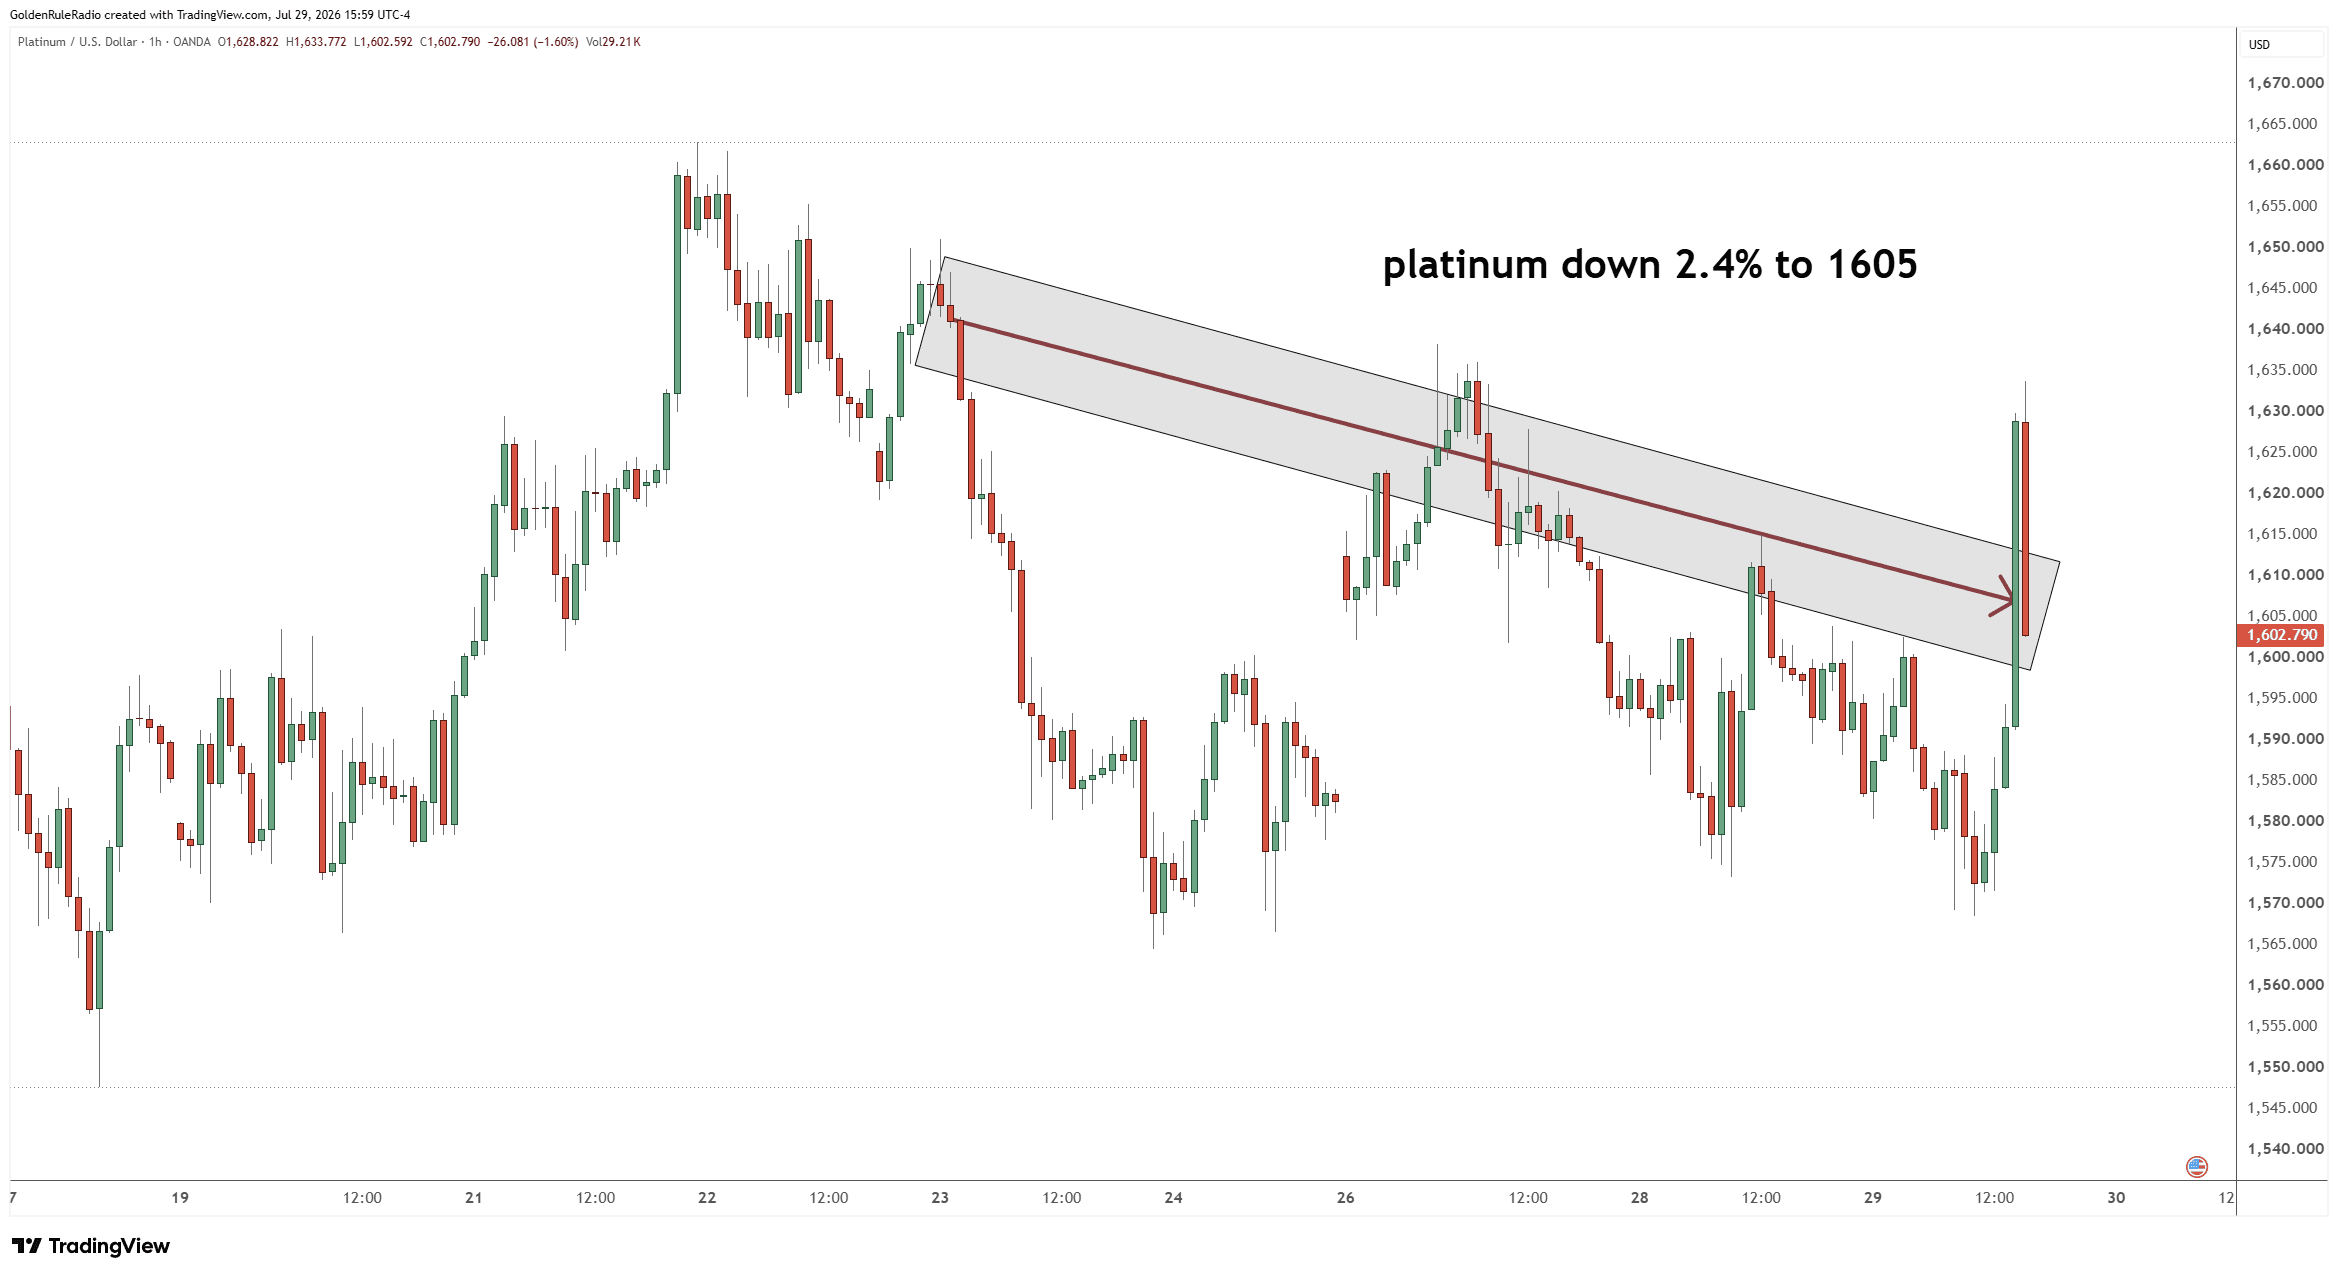
Platinum is down about 2.5%, sitting just above the $1,600 mark at $1,605.
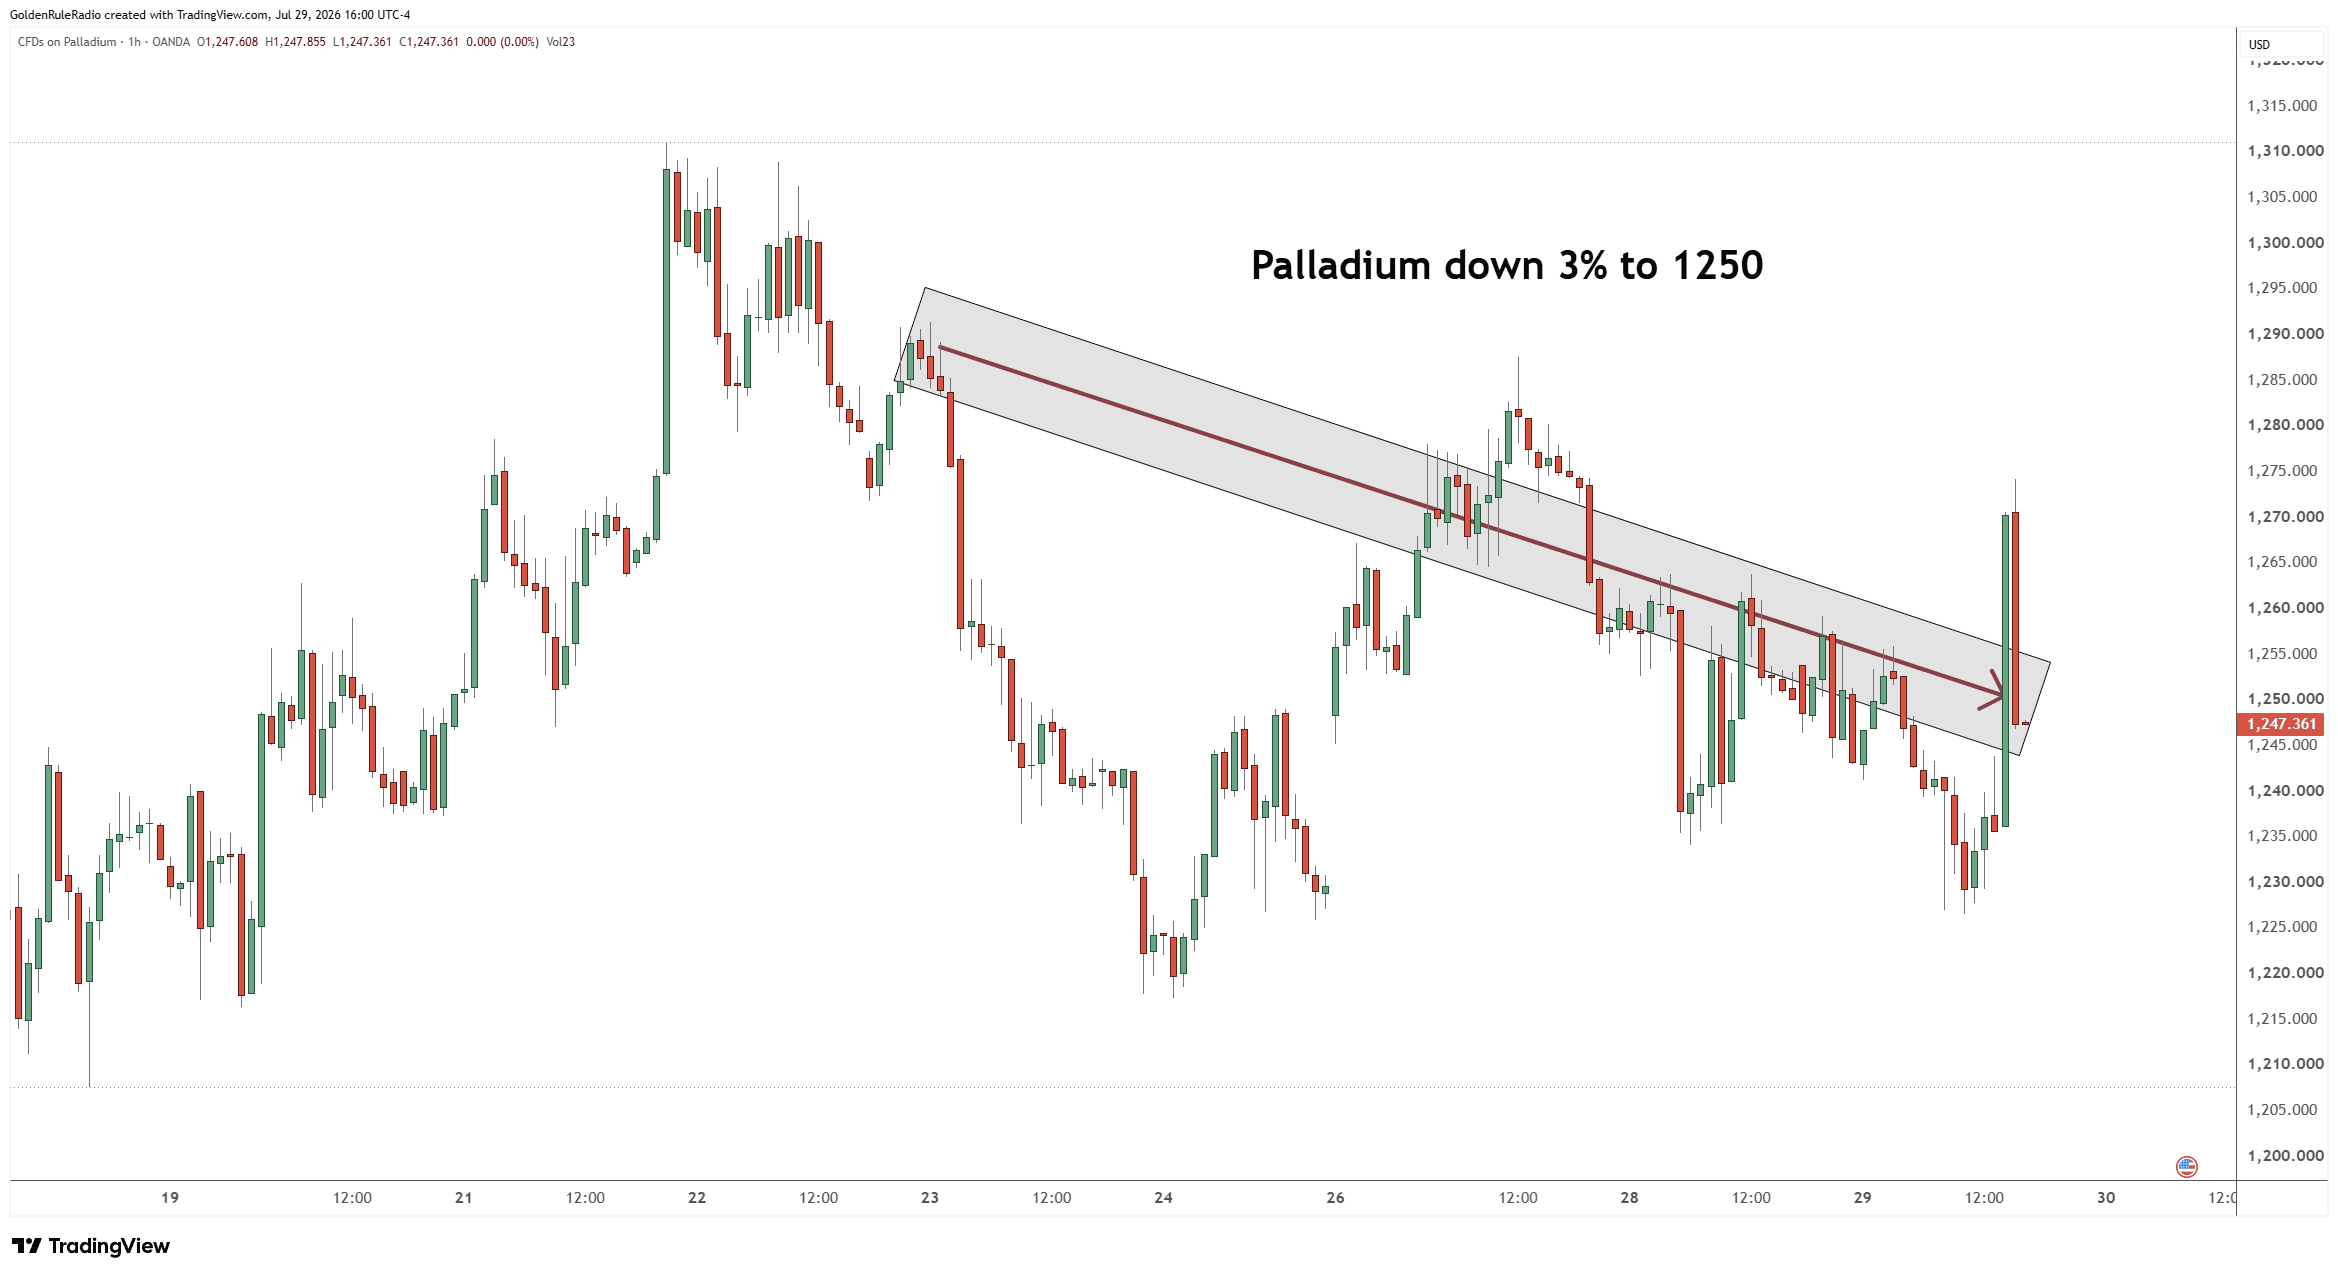
Palladium is down 3% to $1,250.
Looking over at the paper markets…
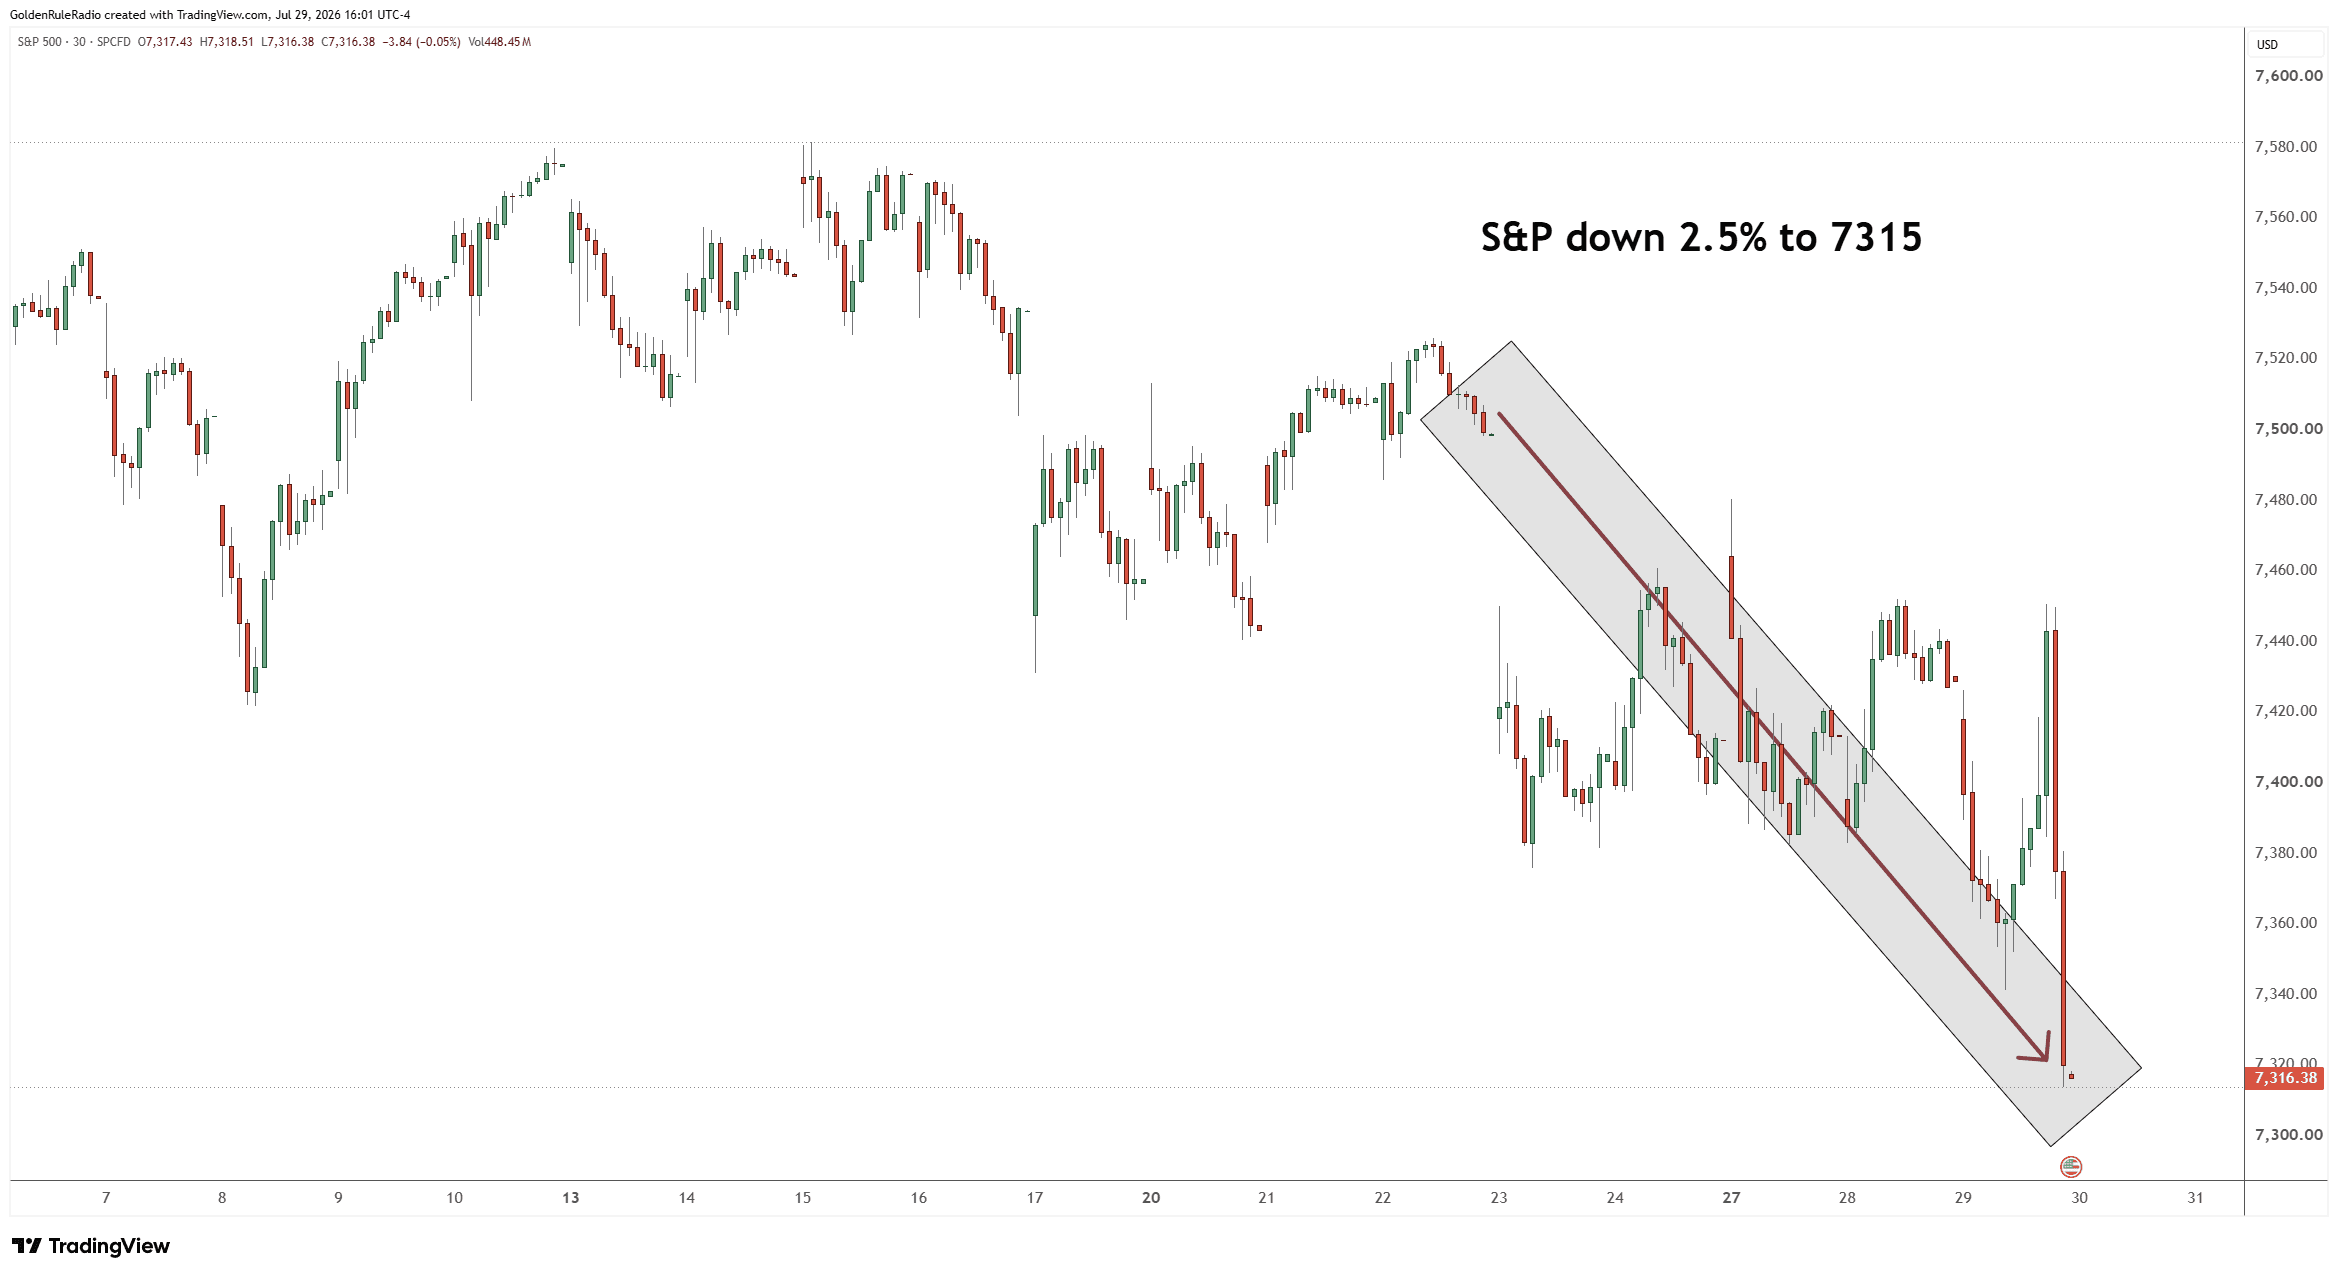
The S&P 500 is down about 2.5%, currently sitting at 7,315 — and starting to show signs of rolling over again.
The US dollar index is flat from a week ago. It had been climbing, but the Fed announcement kicked it back down to 100.9, closing us out slightly below last week.
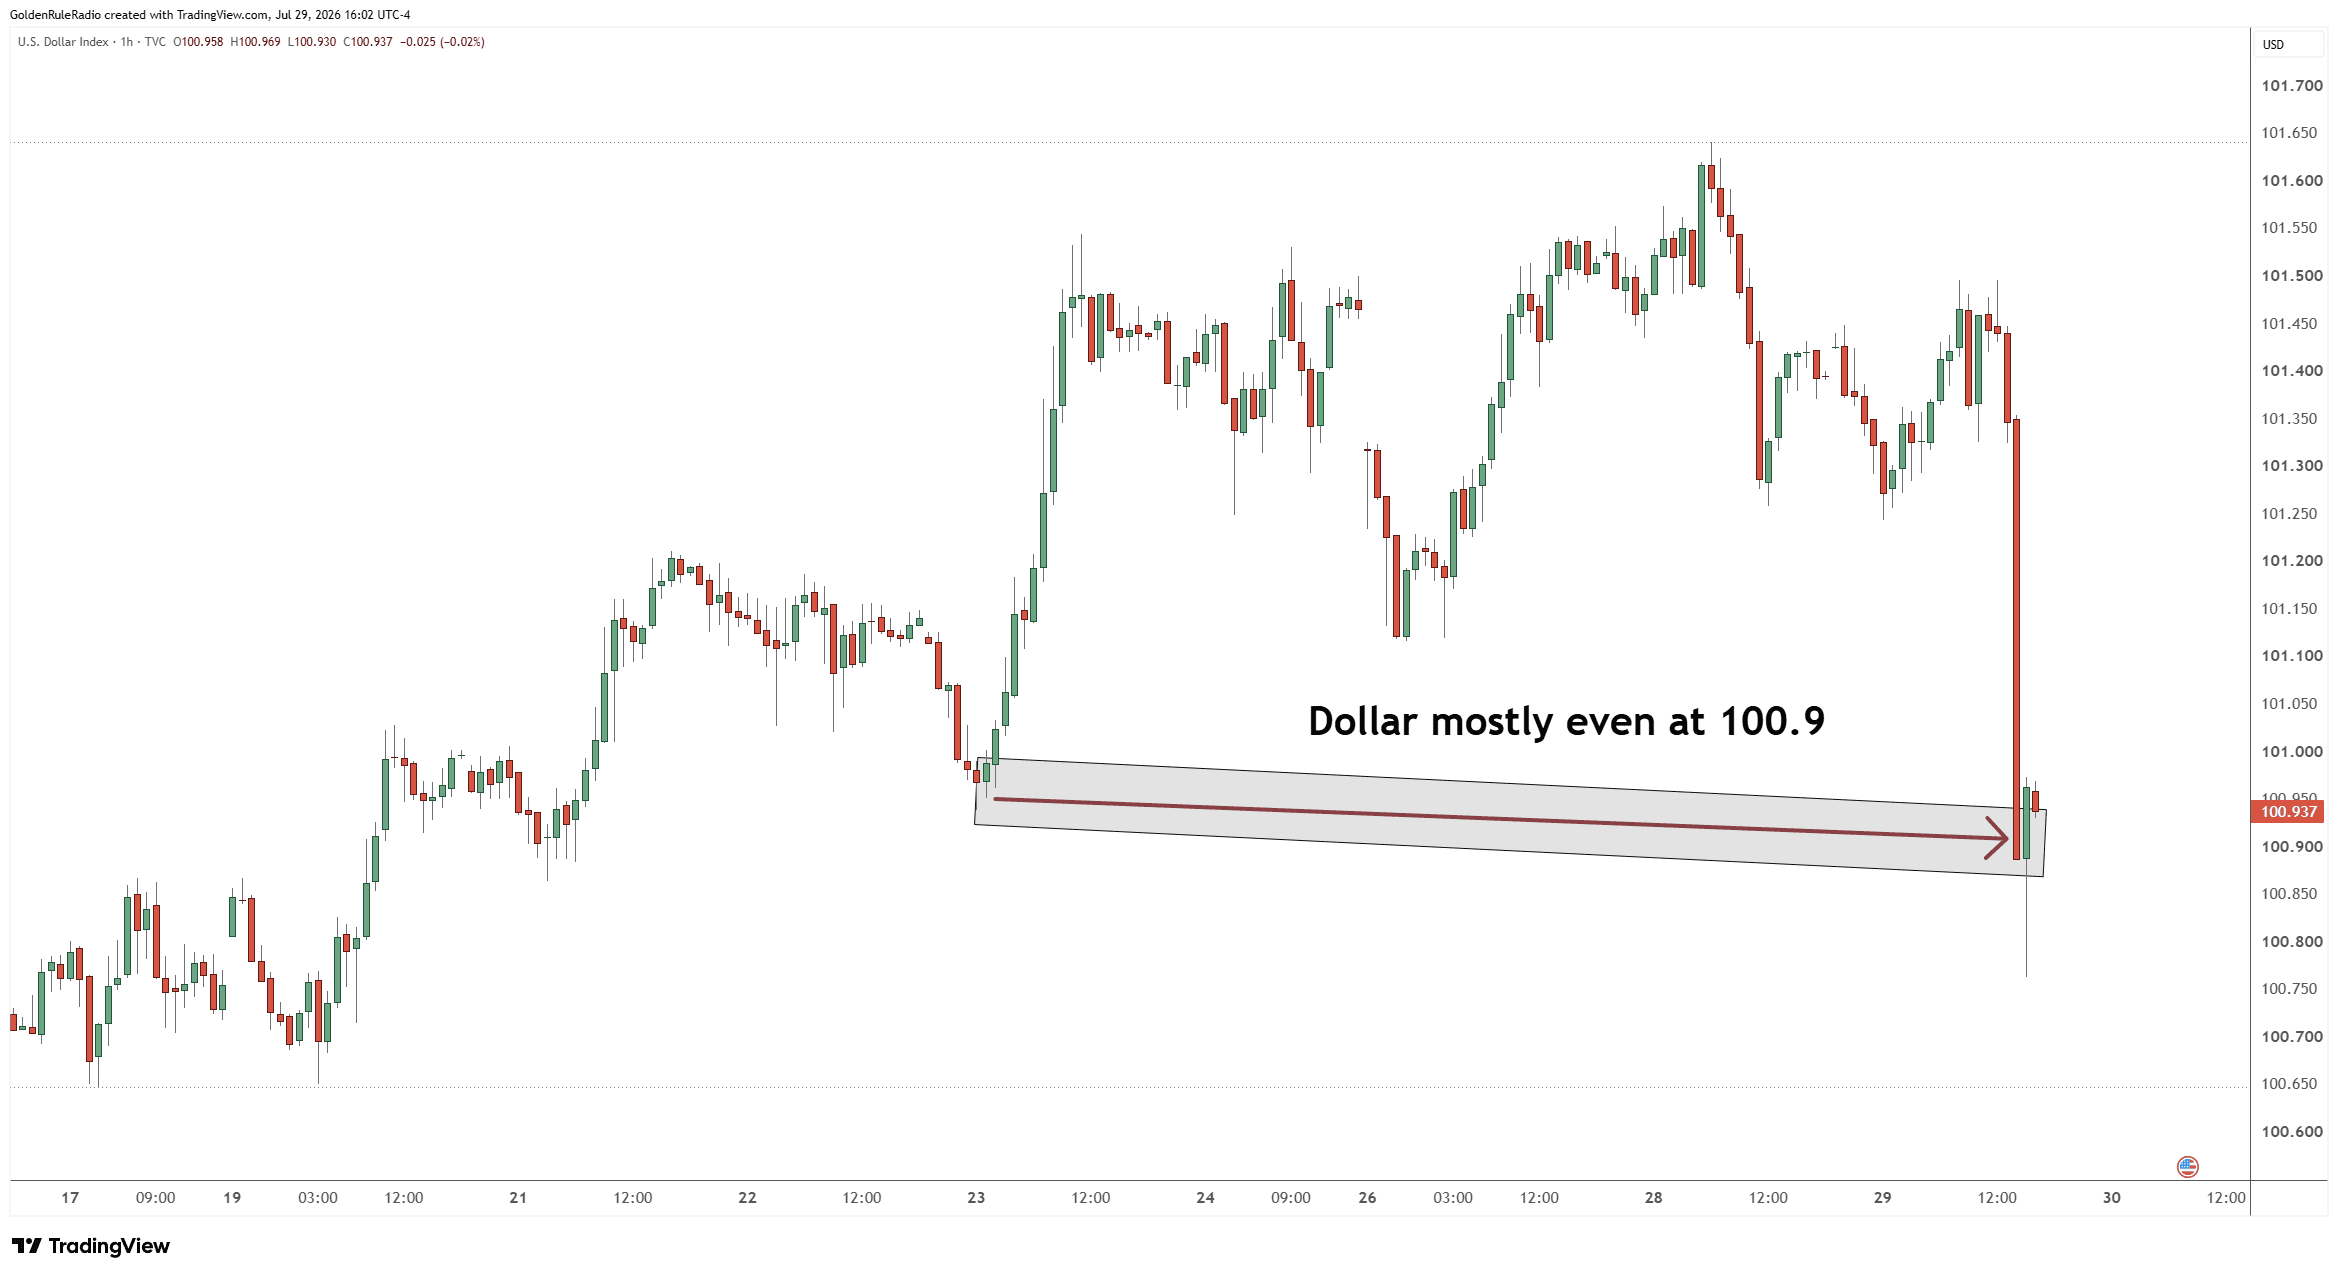
The Fed Held — Now Watch the Balance Sheet
The Fed held rates steady — a 9‑to‑3 vote, with three governors dissenting in favor of a hike. Markets are now pricing a 50–55% chance of a hike in September depending on whether inflation stays sticky. New Fed leadership is talking tough about getting back to the 2% target — a target they’ve already missed.
But the rate decision is almost a sideshow. With roughly $8 trillion in U.S. Treasurys rolling over in the next twelve months, the government simply can’t afford meaningfully higher rates. Every uptick in yield raises the cost of servicing the debt.
The lever that actually matters is the Fed’s balance sheet — how much it prints. The next great monetary event won’t be about a quarter‑point here or there. It will look like the financial crisis and COVID — a massive round of money creation. And that’s the environment in which gold historically runs from four figures toward much higher levels.
The Headwind That Can Flip to a Tailwind
For the last several months, gold has been fighting an uphill battle. Oil prices, the two‑year Treasury yield, and the dollar have all been climbing together — a classic headwind for gold. When you can earn a positive real rate of return in Treasurys and the dollar is firm, the appeal of a non‑yielding asset like gold naturally cools.
The turn comes when the reason oil is rising changes. Right now, higher oil is being read as an inflation story. But with the Iran conflict flaring back up after the recent memorandum of understanding expired, a genuine supply‑driven oil spike becomes an inflation multiplier that chokes off economic activity. At that point, the two‑year yield stops tracking oil higher and starts to diverge lower, the dollar rolls over, and gold finds its footing.
You can already see the tension building. Longer‑dated yields are at levels we haven’t seen in close to twenty years, with the 30‑year knocking on highs last seen around 2007. When those yields finally top and turn down — even as oil keeps climbing — that’s the signal we’re watching for gold to push back above the $4,200 level and beyond.
AI, Asia, and Echoes of March 2020
There’s a real sense of déjà vu this week. Market instability is being driven largely by AI leverage and semiconductor‑stock corrections, and much of the damage is concentrated in Asia — the Korean market is down roughly 35% in a month, with Japan getting hit as well. The Dow was down more than 1,150 points (about 2.2%) on the day despite the Fed holding rates.
It’s reminiscent of the “Asian contagion” of the late 1990s and, more recently, with March 2020, when COVID first roiled global markets. And remember what gold did in 2020: it initially dropped as everything got liquidated, then went on to a new all‑time high once the money printing began.
That’s the pattern to keep in mind. A sharp equity break can drag gold down with it for a month or two as investors sell what’s liquid. But every time we’ve seen that play out, the rebound in metals has dwarfed the decline — a 15% drop followed by a 40% rise. This last leg higher in gold came without a coinciding crisis elsewhere. Layer a genuine equity rollover on top, force the government’s hand into another cash infusion, and you get much higher gold prices in a much shorter window than the market would otherwise deliver.
Premiums Are Rising Again
Here’s a development that doesn’t show up on the spot chart but tells you a lot about real demand. For months, physical premiums have been at rock‑bottom levels — Krugerrands trading essentially at spot, American Eagles and proofs dirt cheap, and pre‑1965 constitutional “junk” silver actually trading below spot.
This week, that changed. Premiums have started to climb. That’s the physical market catching up: refiners catching up, demand picking up, and the cooldown in price drawing buyers back in. When premiums bottom and turn, it’s often an early sign that the physical market is reasserting itself over the paper market.
Pair that with the technical picture. Gold has come back down toward its 65‑week moving average, which has been a reliable “safe zone” to buy in this cycle. We may see a bottom within $100 or $200 of here — but as David McAlvany has put it, the top is thousands of dollars away. Several of us added aggressively on the drop back toward $4,000 this week, because with every underlying fundamental still intact, adding ounces simply makes sense.
The East Keeps Accumulating
While Western headlines fixate on the Fed, the East keeps voting with its balance sheet. China imported roughly 173 tons of gold last month, with Hong Kong bringing in another 130 tons — well over 300 tons flowing toward China in a single month.
More significant is what China did on July 24: it moved to shut down paper gold trading on the Shanghai exchange, signaling it wants a real, physically‑set price for gold rather than one driven by leveraged paper contracts. If that pushes premiums higher in the East, it can create the same kind of arbitrage we saw earlier this year — gold physically leaving the West and flowing to the East where there’s a profit to capture, much like the yen carry trade.
This echoes history. It was France’s demand for physical gold that ultimately forced Nixon’s hand in closing the gold window in 1971. The East understands the same thing today: in a world where the U.S. has grown its national debt from about $11 trillion during the financial crisis to nearly $40 trillion — and where the world has added something like $75 trillion in debt since COVID — real, unprintable assets are the ones worth stockpiling.
How to Invest Right Now
Treat this pullback as an inventory opportunity, not a warning. Gold near its 65‑week moving average, back around the $4,000 area, has historically been a buy zone in this cycle. Adding on weakness beats chasing strength.
Watch premiums, not just spot. The turn higher in physical premiums after months at record lows is an early tell that real demand is returning. It’s also a reminder that low‑premium product may not stay available forever.
Keep your eye on the balance sheet, not the headline rate. The Fed holding rates changes little. The printing that follows the next bout of market stress is what drives gold’s biggest moves — and that setup is building.
If you’ve got cash sitting idle in a savings account while all of this unfolds, it’s worth asking what that cash is really doing for you.
Here to Help
Wondering what your next move in precious metals should be? The team at McAlvany Precious Metals has a collective 75 years of experience investing in the precious metals market. We’re happy to speak with you about your goals on a no‑obligation, complimentary consultation. Reach out to us at 800-525-9556.