
Podcast: Play in new window
Precious metals take a modest slide this week, as gold drops 2% and silver a little over 3%. As the metals dropped, equities rose higher and continued their ongoing rally to reach new highs. As concerns around liquidity conditions and volatility rise, maintaining a disciplined portfolio remains key.
Let’s take a look at where prices stand as of Wednesday, April 22:
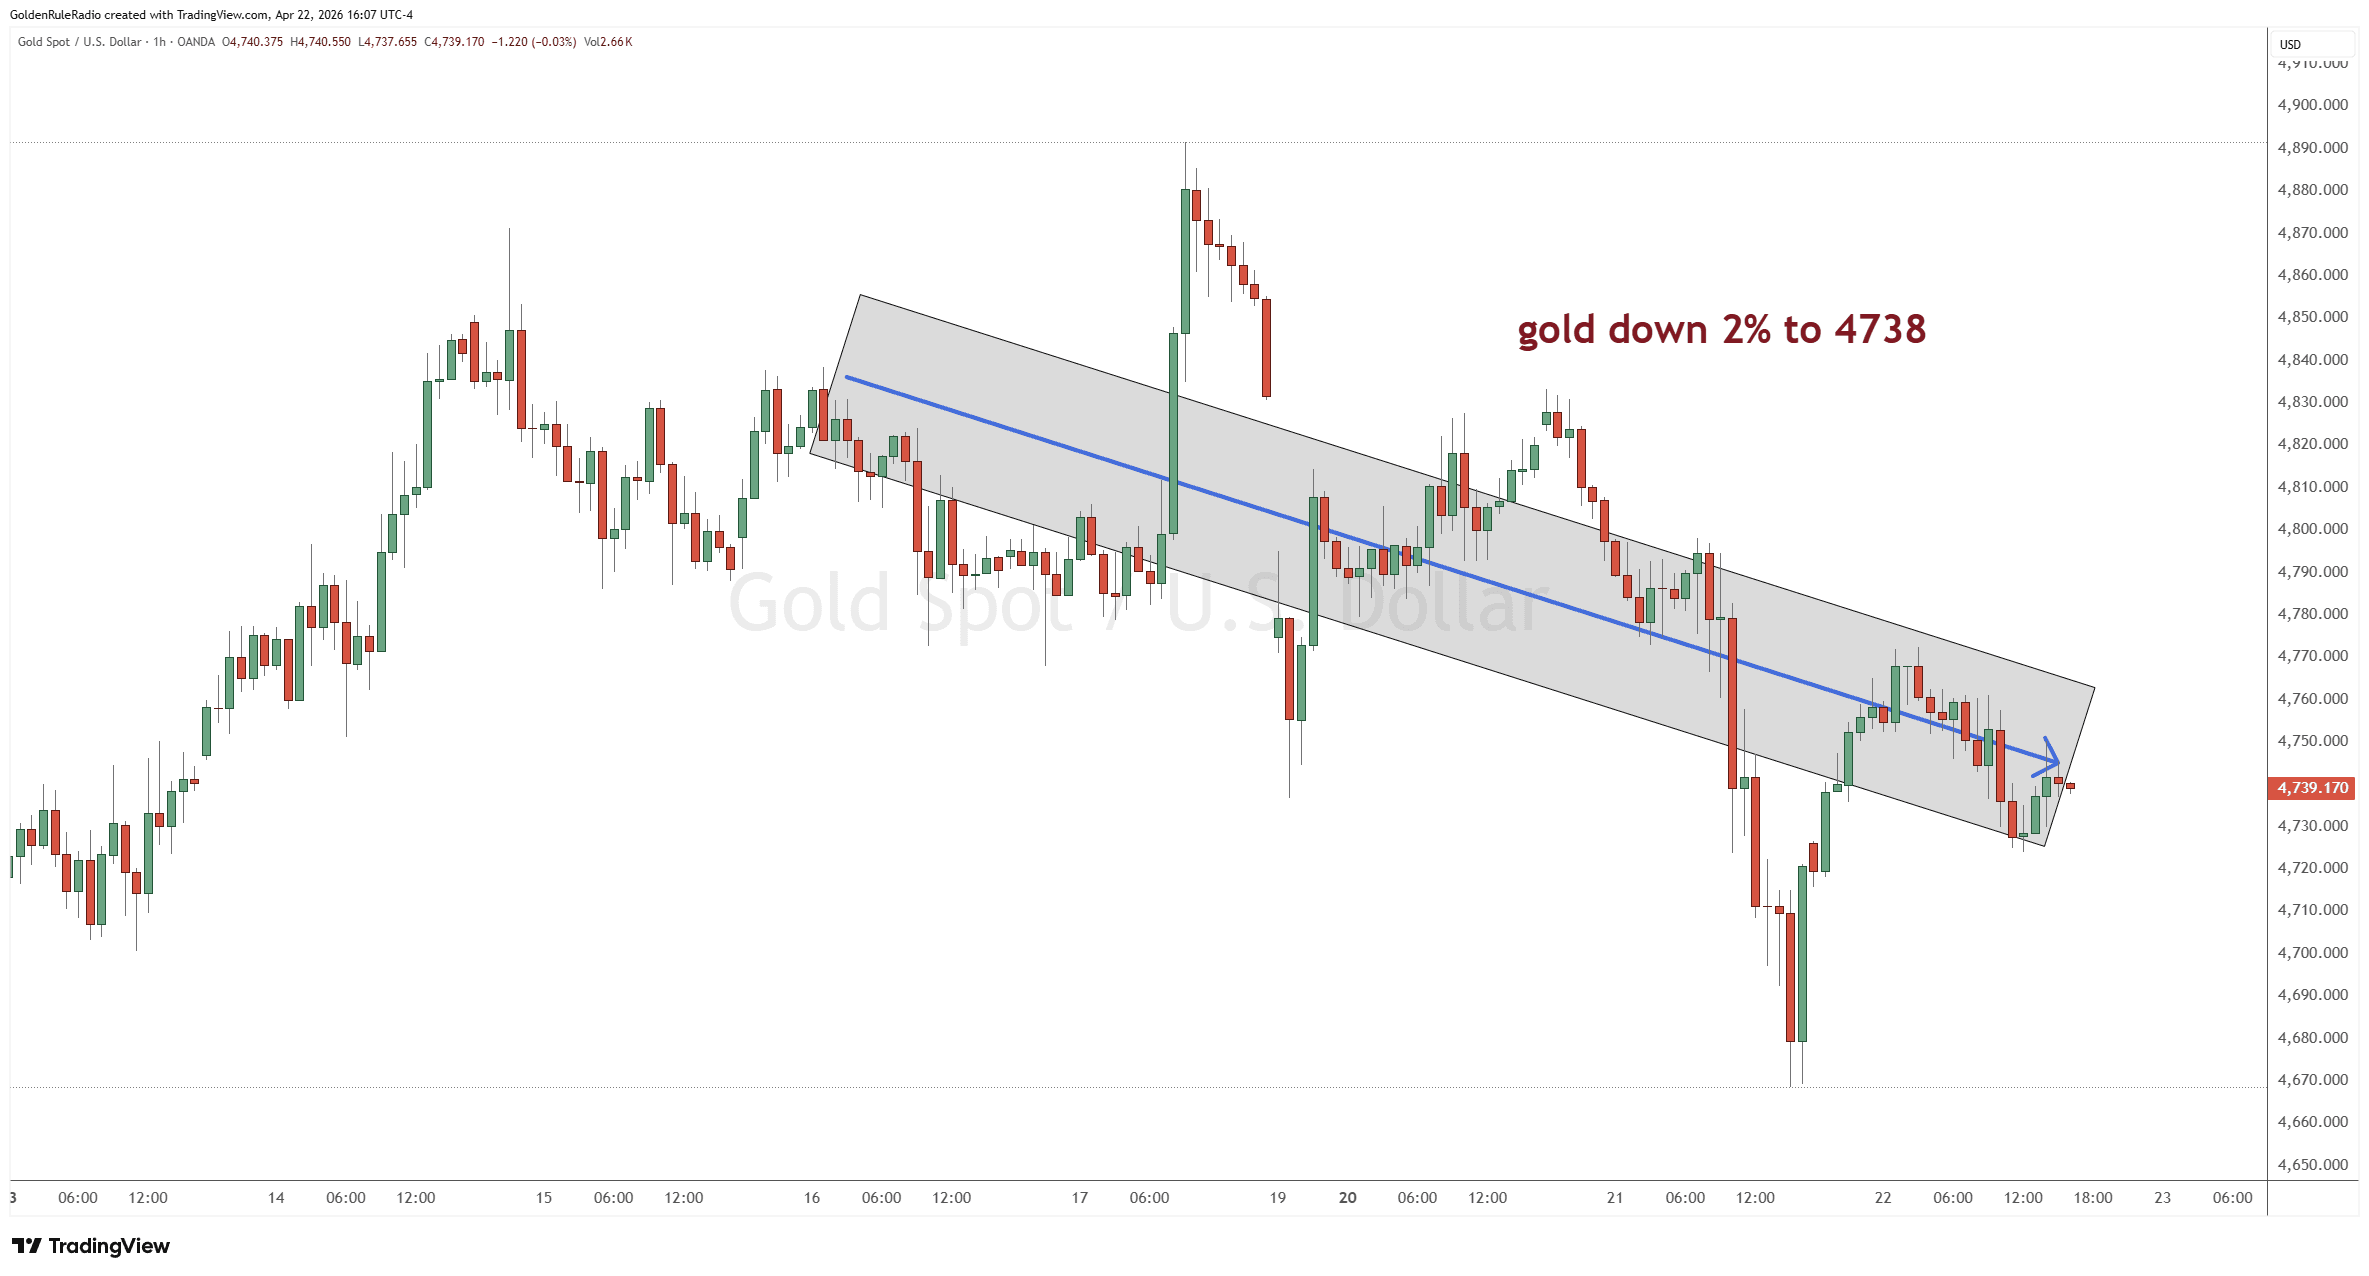
The price of gold is down about 2%, sitting at $4,738, and well within its defined trading range.
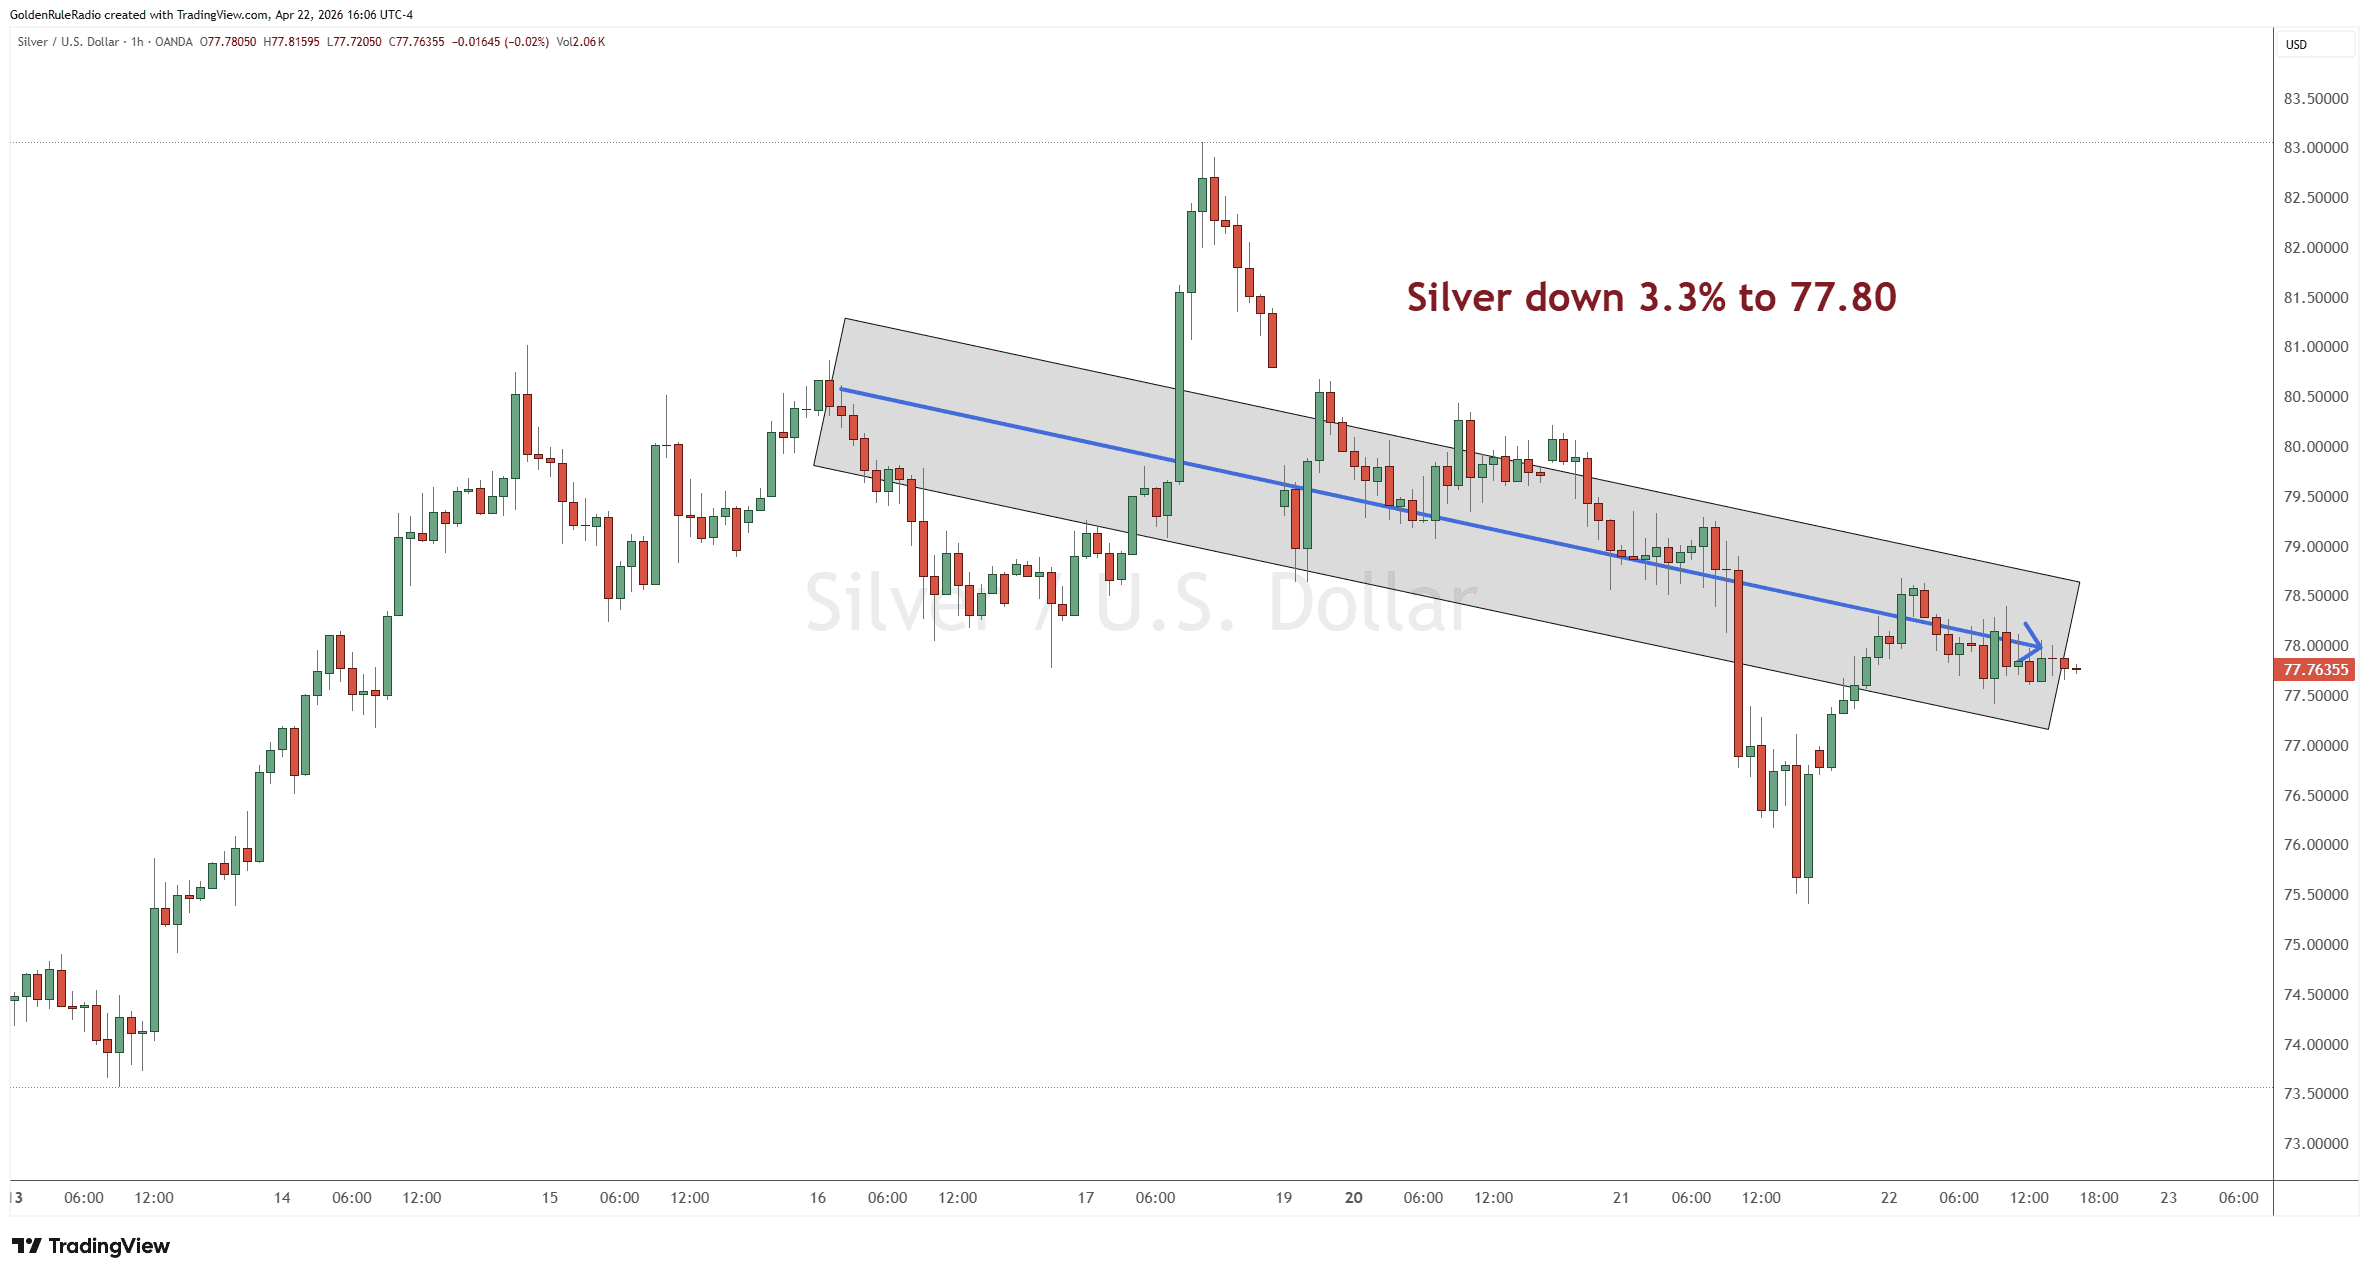
The price of silver is down 3.3% this week, sitting at $77.80 as of this week’s recording.
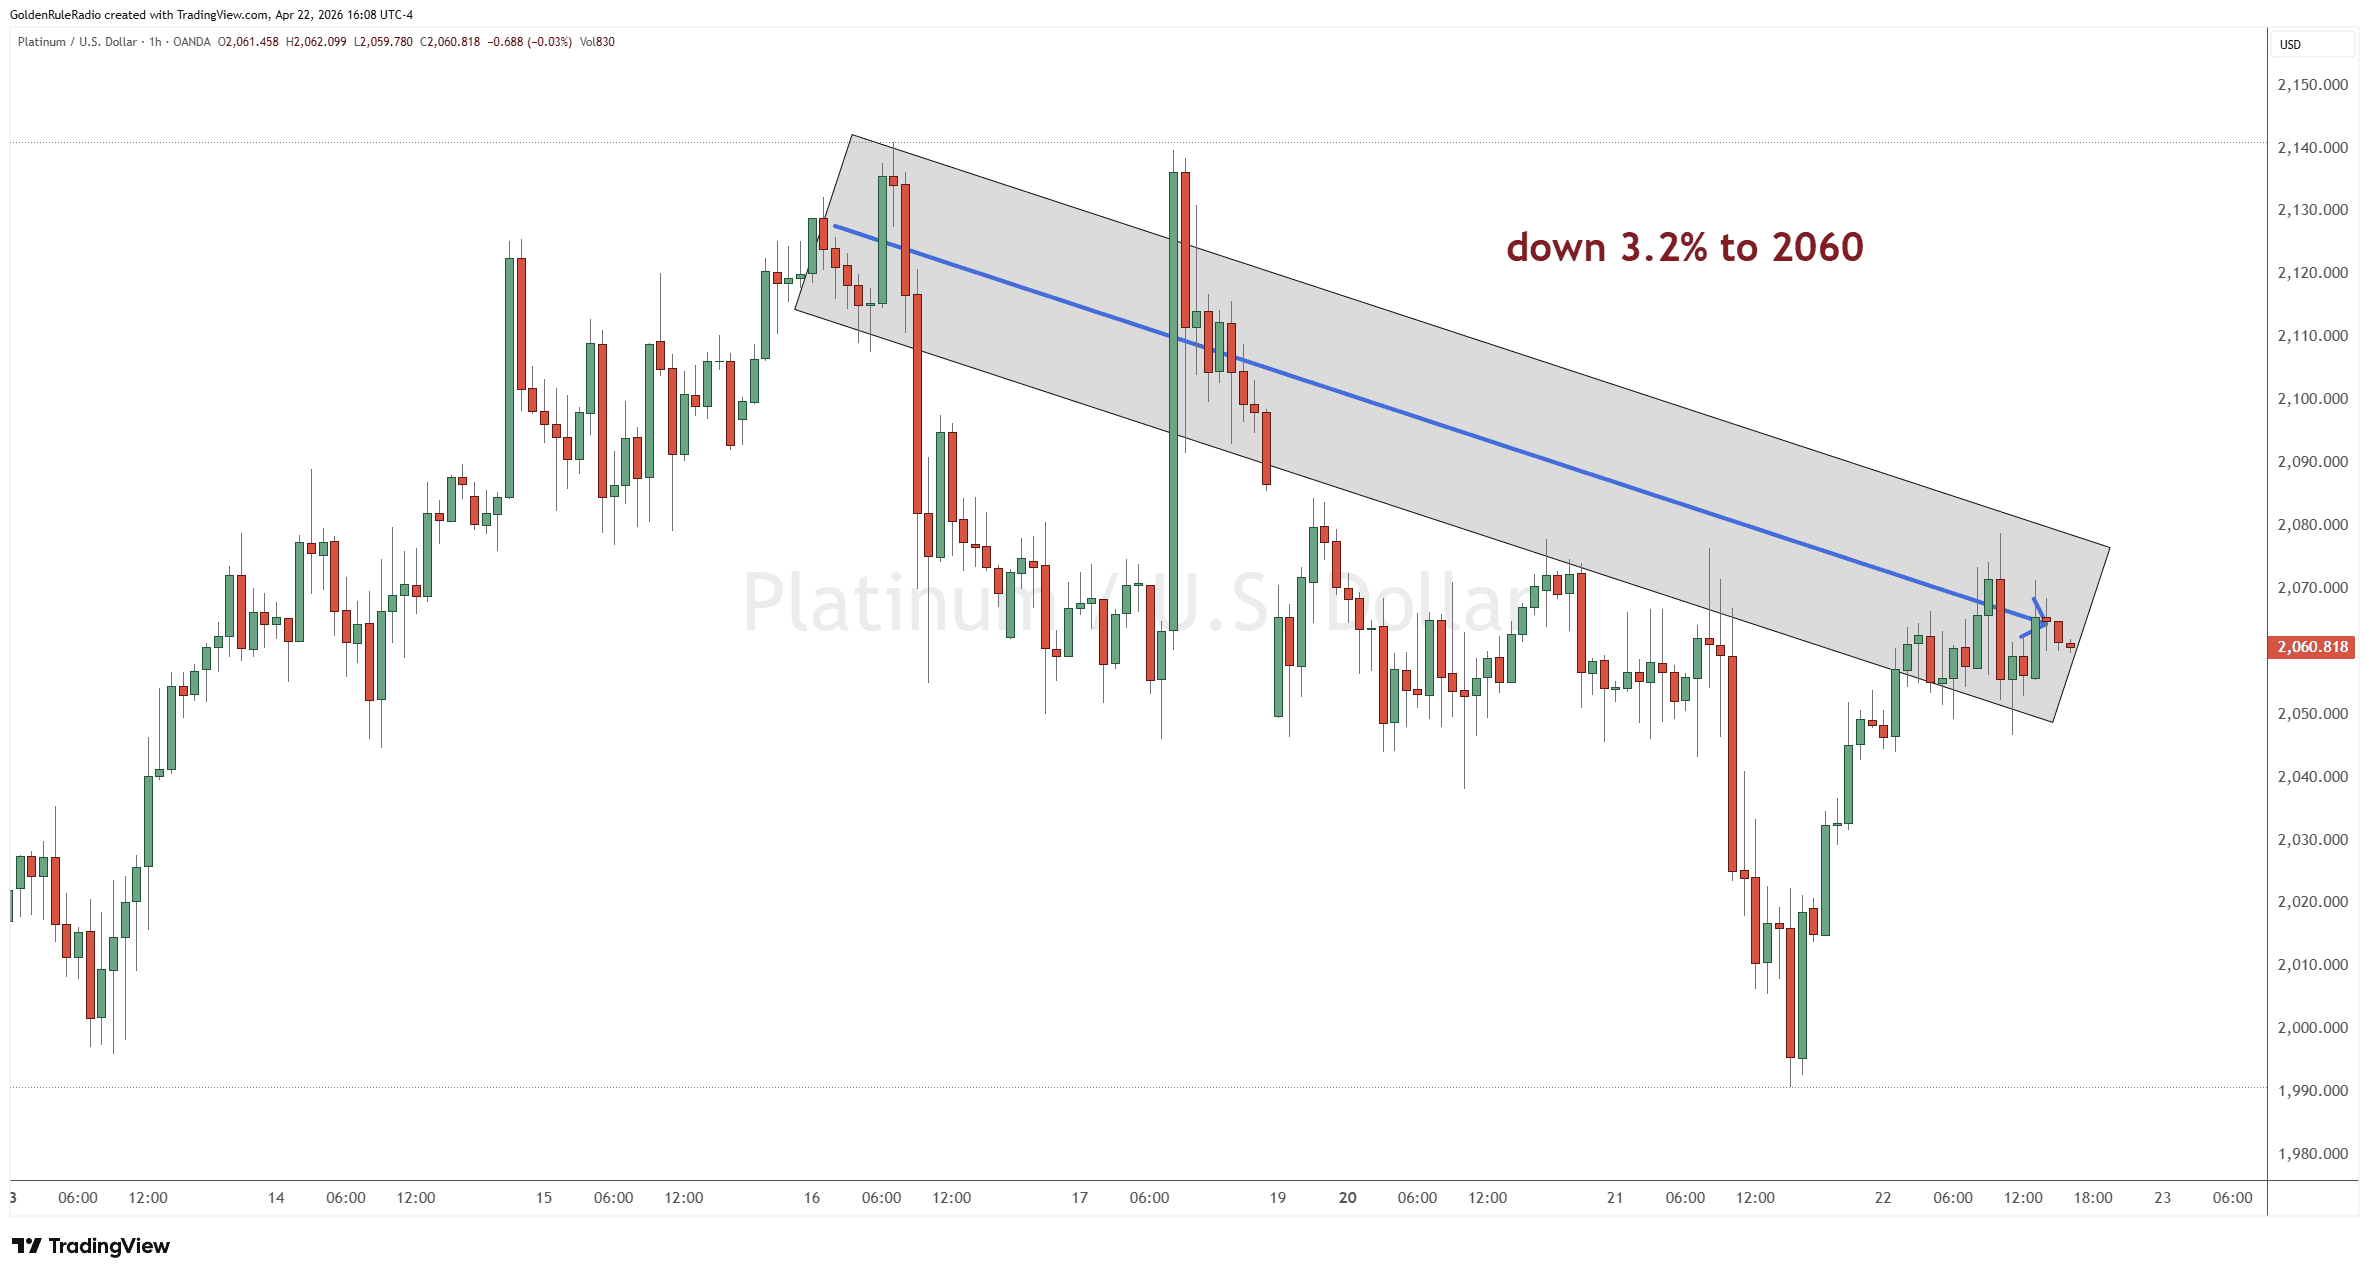
Platinum is down 3.2% at $2,060 from a week earlier.
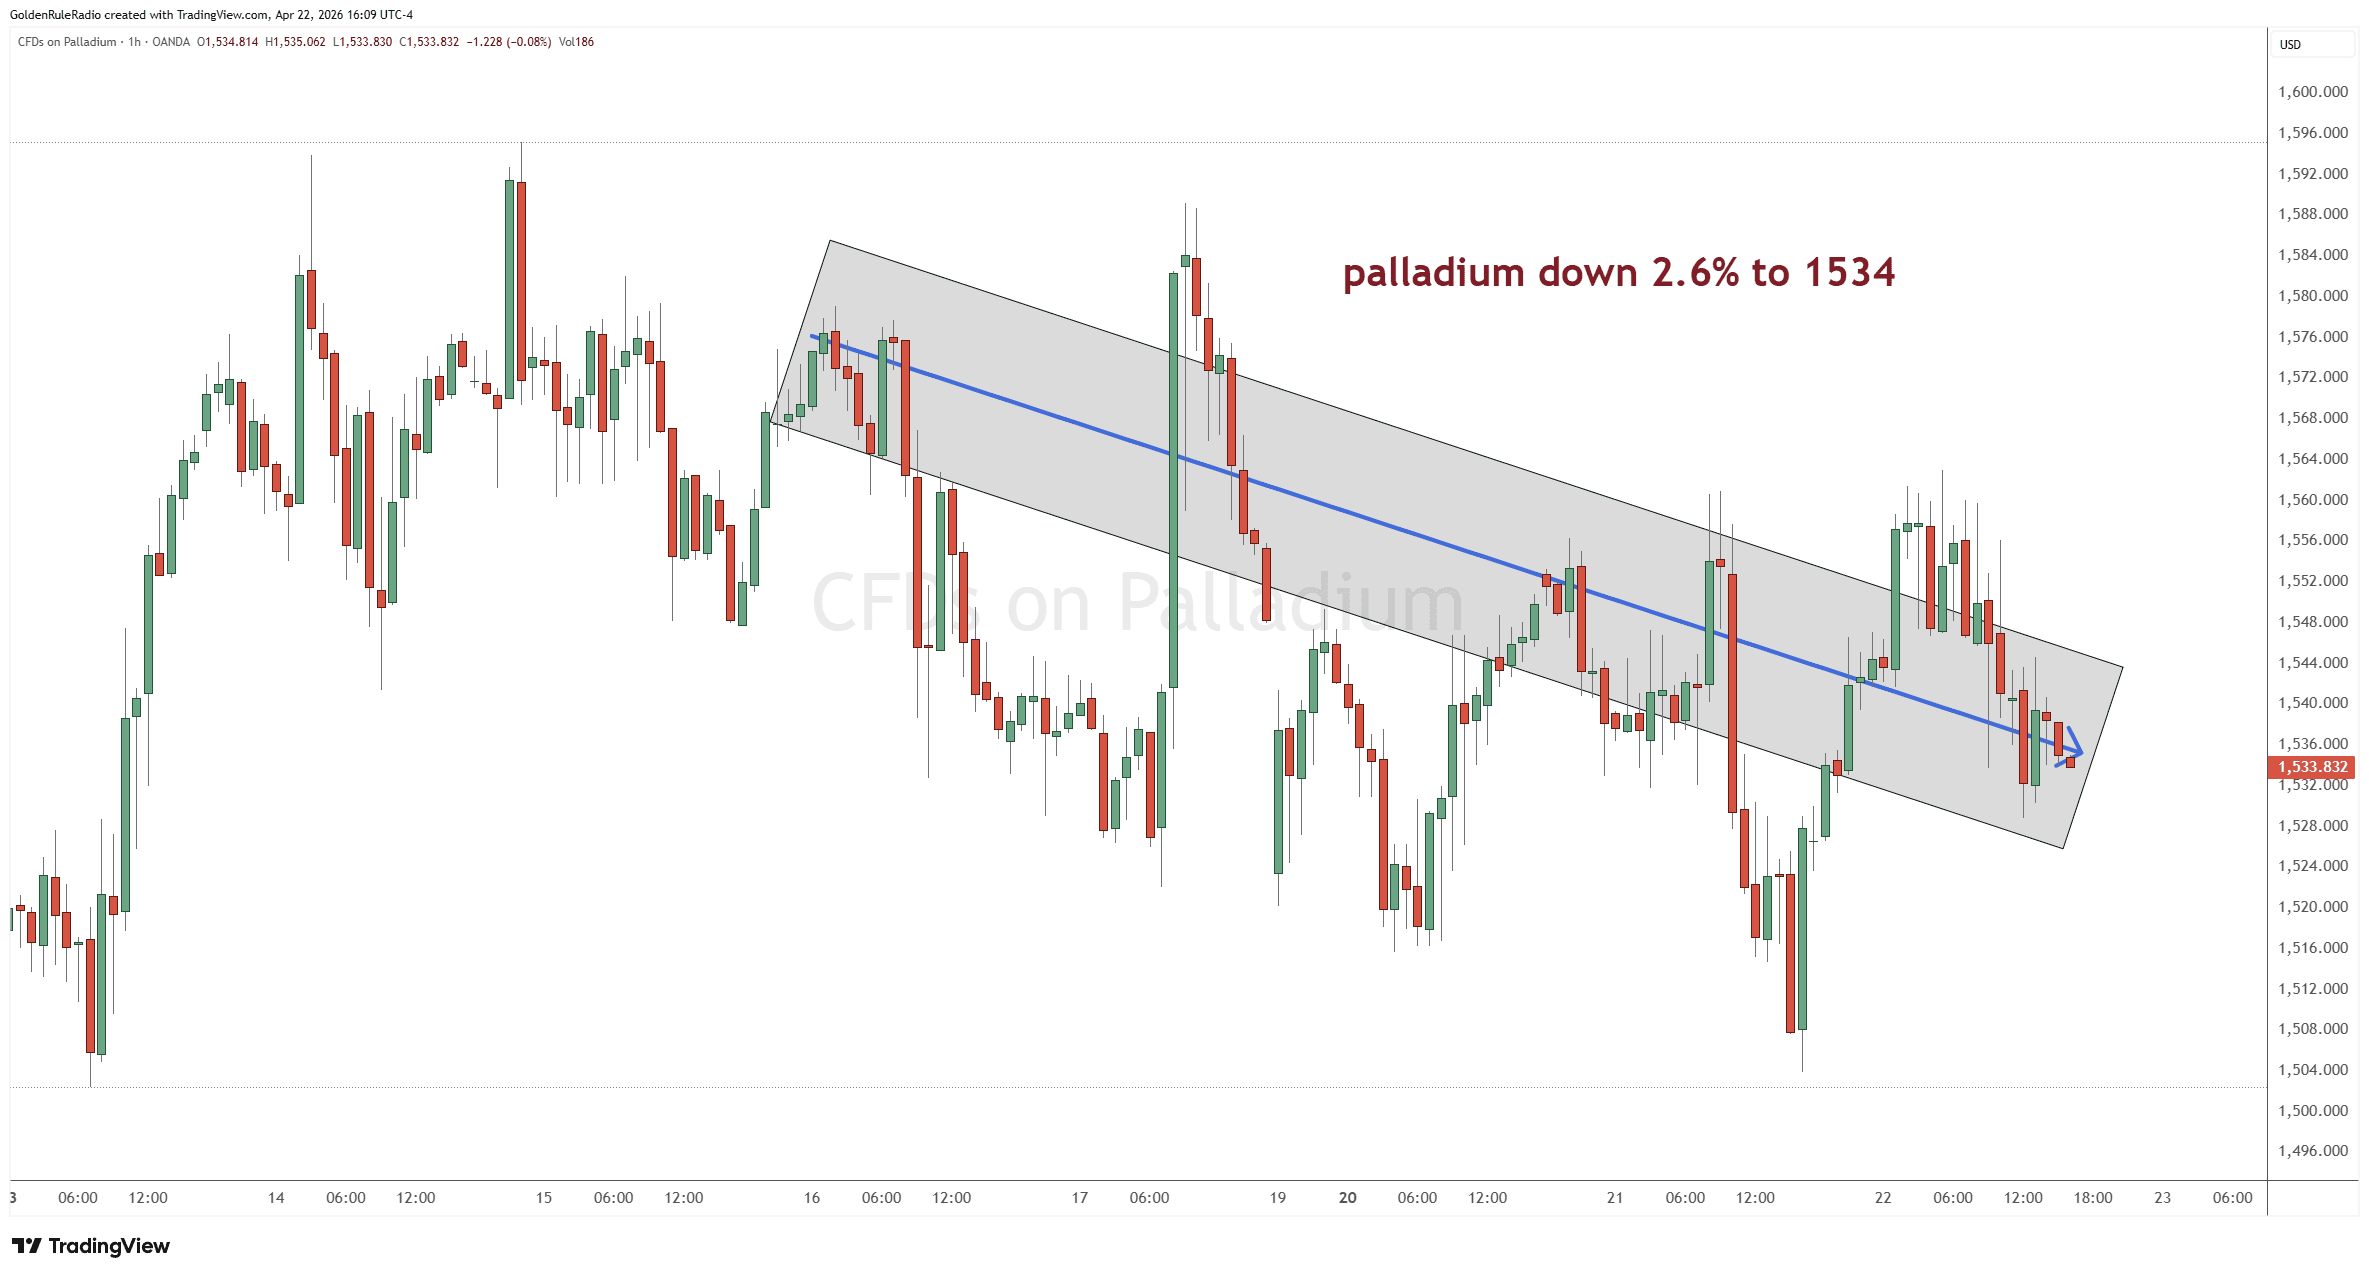
Palladium is down about 2.6% at $1,534. So all four metals are having a solid week since our recording last week.
Taking a look over at the paper markets…
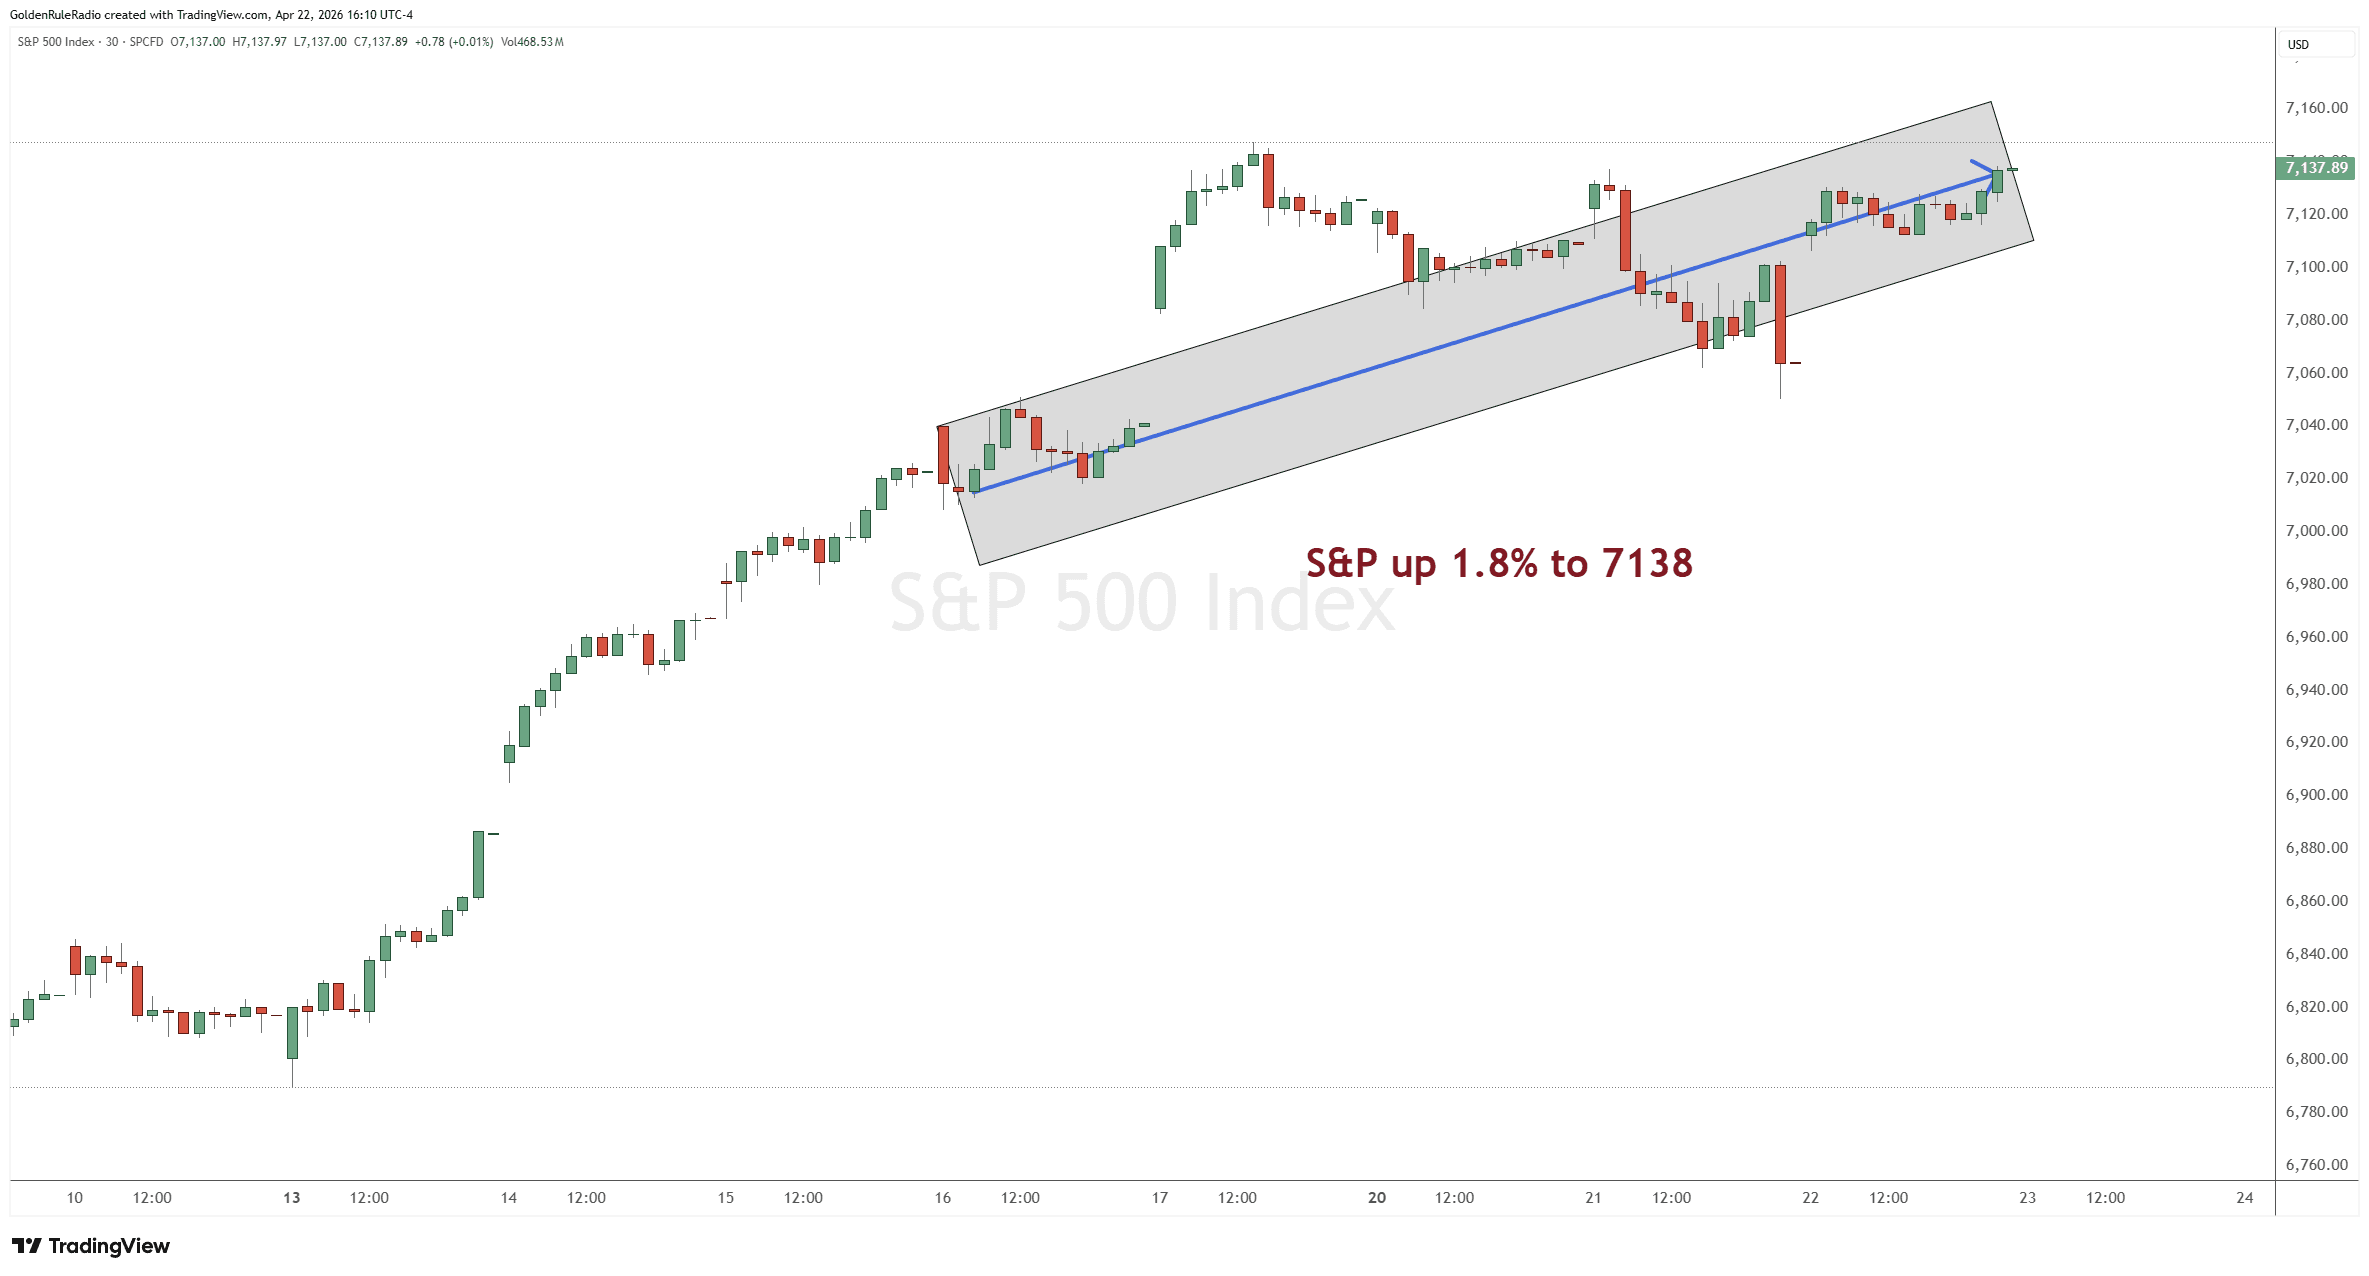
The S&P 500 is up 1% to 7,023 — still climbing and pushing to new highs.
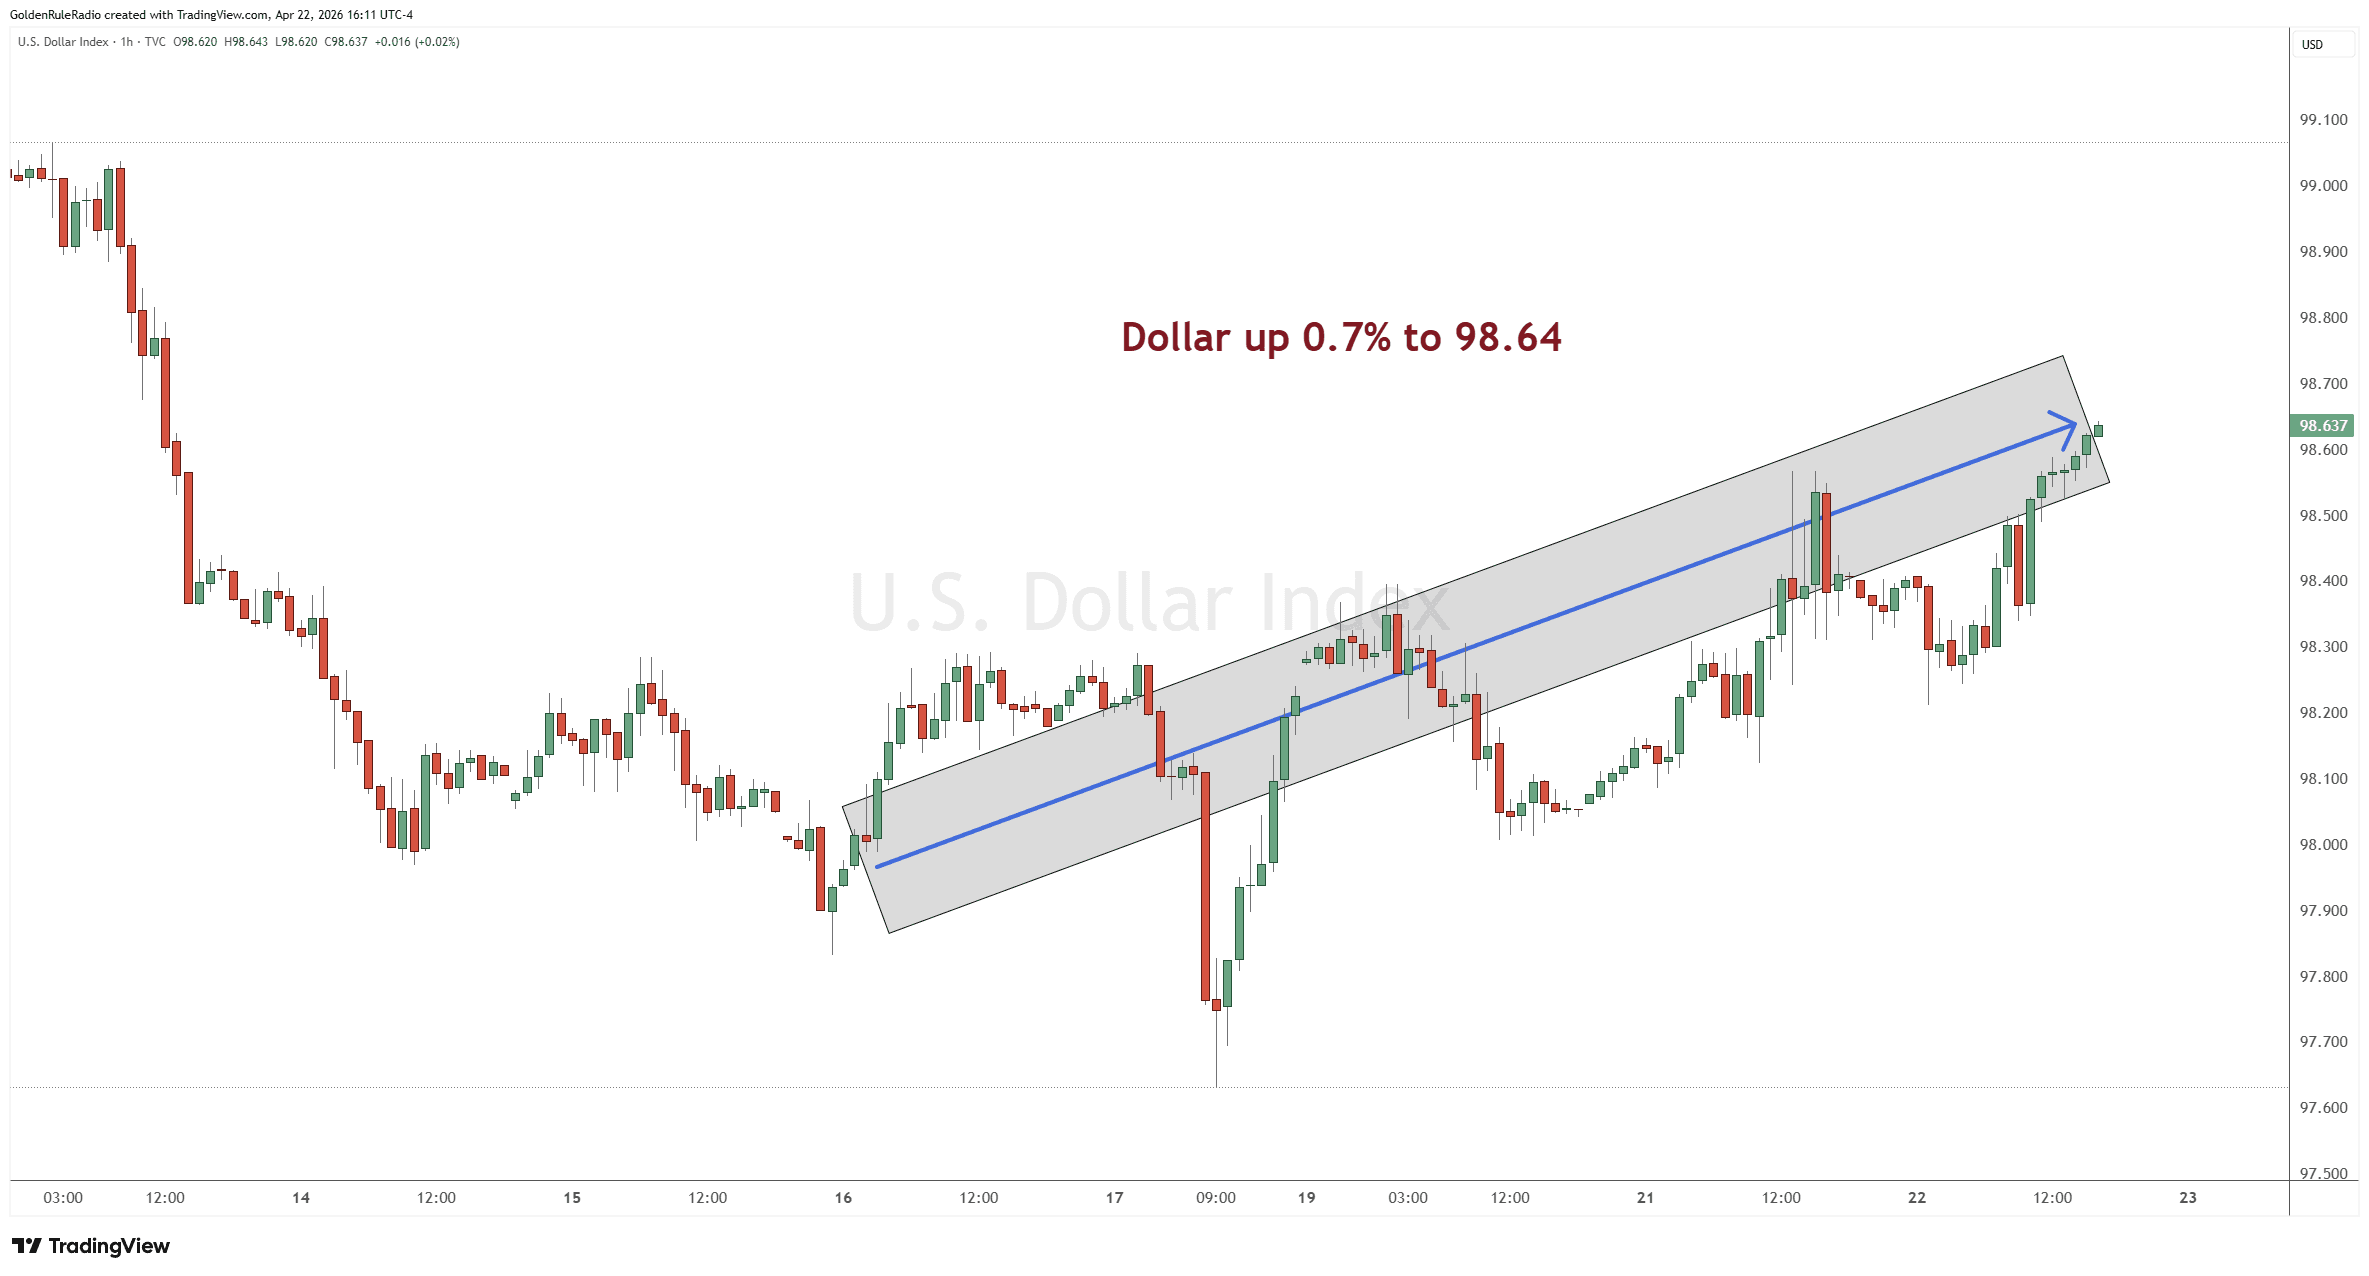
The US Dollar Index is up 0.5%, sitting at 98.64.
The Correction Is Real. So Is the Bull Market.
Gold dropped hard in late March, briefly tagging its 200-day moving average near $4,100 in Asian and London trading before snapping back nearly 10% off that low in the same session. Silver was even more dramatic — falling about 30% to just under $62 before recovering into the low $70s.
Those moves were painful on the screen. But zoom out, and the long-term gold chart looks like a skyscraper. The late-1970s spike — which felt enormous at the time — now registers as a small speed bump on the multi-decade chart. The same will likely be true of today’s correction when viewed from 10 years out.
What matters for positioning is this: gold remains in a long-term uptrend that has been in place since roughly 1972, and the current corrective phase is occurring within that broader advance, not against it. Four consecutive weeks of higher closes is early evidence that the next leg up may be beginning to form.
Stock Market Is Flashing a Serious Warning
While metals consolidate, equities are hitting levels that should give every investor pause. The Warren Buffett Indicator — market cap of stocks as a percentage of GDP — just hit 227%. That surpasses both the dot-com bubble and the 2008 financial crisis. In other words, we are now at the most expensive stock market valuation in recorded history.
At the same time, the S&P 500 is on pace for a third consecutive week of 3% gains. That has happened only twice since 1950, and both times it was a reversal from a sharp prior decline — never before at all-time highs.
What does this mean for metals investors? The Dow-to-Gold ratio currently sits around 9:1. Historically, major market bottoms have pushed that ratio into single digits, and full secular reversals have taken it toward 3:1. We may be closer to the beginning of this cycle favoring gold over equities than most people realize.
The Fed Is Printing Money Again
Here’s the part that isn’t getting nearly enough attention: the Federal Reserve is expanding its balance sheet again. Over the past four weeks, that expansion has been running at a 10% annualized rate. That is a significant liquidity injection — and it’s the primary fuel behind the recent surge in equities.
The Fed isn’t cutting rates. Inflation data is still sticky, and a new Fed chair nominee (Kevin Warsh) is going through confirmation hearings promising independence and a return to 2% inflation. But the balance sheet tells a different story. Quantitative easing and inflation are the same thing — just different words for expanding the money supply.
For gold and silver investors, this is straightforward: more dollars in circulation means each dollar buys less over time, and hard assets reprice to reflect that reality. The metals aren’t going up because of speculation. They’re going up because the currency is being diluted — slowly, steadily, and now again with some urgency.
Dollar Decline Is a Decade-Long Trend
In 2015, gold made up just 9% of global reserves. By the end of 2025, that figure had tripled to 27%. Over that same period, the U.S. dollar’s share of global reserves fell from 60% to 40%.
Central banks don’t make those kinds of structural shifts based on short-term price action. They’re voting with their balance sheets — and the vote is clearly moving away from paper and toward gold. China, Russia, and other BRICS-aligned nations have been building gold depositories and encouraging gold-backed trade settlement specifically to reduce dependence on the dollar-denominated SWIFT system.
What this means practically: the bid under gold is no longer just retail investors or domestic inflation fears. It’s sovereign demand from countries that have decided, structurally, to hold less paper and more metal. That doesn’t reverse in a quarter.
Stay The Course With Metals
The bottom line: don’t get sucked into the short-term noise.
Keep accumulating on a schedule. Treat metals as disciplined savings, not a trading game. Dollar-cost averaging into a long-term uptrend is one of the most reliable ways to build a position without the stress of trying to call bottoms.
Use the Investment Triangle as your guide. With stocks at historic valuations and metals in a corrective phase, now is a reasonable time to review whether your portfolio is appropriately balanced across growth assets, liquid savings, and physical metals. The goal isn’t to be all-in on any one category — it’s to make sure no single outcome destroys the whole.
Consider your IRA. If a meaningful portion of your savings is in a retirement account, a precious metals IRA lets you hold physical gold, silver, platinum, and palladium with the tax advantages you’re already familiar with. Ratio trades inside an IRA — swapping between metals as their relative prices shift — let you compound ounces over time without triggering immediate capital gains.
Claim Your Portfolio Review
The team at McAlvany Precious Metals has a collective 75+ years of experience advising on precious metals. For a no-obligation, complimentary consultation on your portfolio, call us at 800-525-9556.