Podcast: Play in new window
Pressure builds in the metals markets as volatility in equities, the USD dollar, and oil shape market sentiment. Despite the fallback in metals, long-term projections see gold pushing higher as its role as a hedge against inflation and instability grows.
Let’s take a look at where prices stand as of Wednesday, March 20:
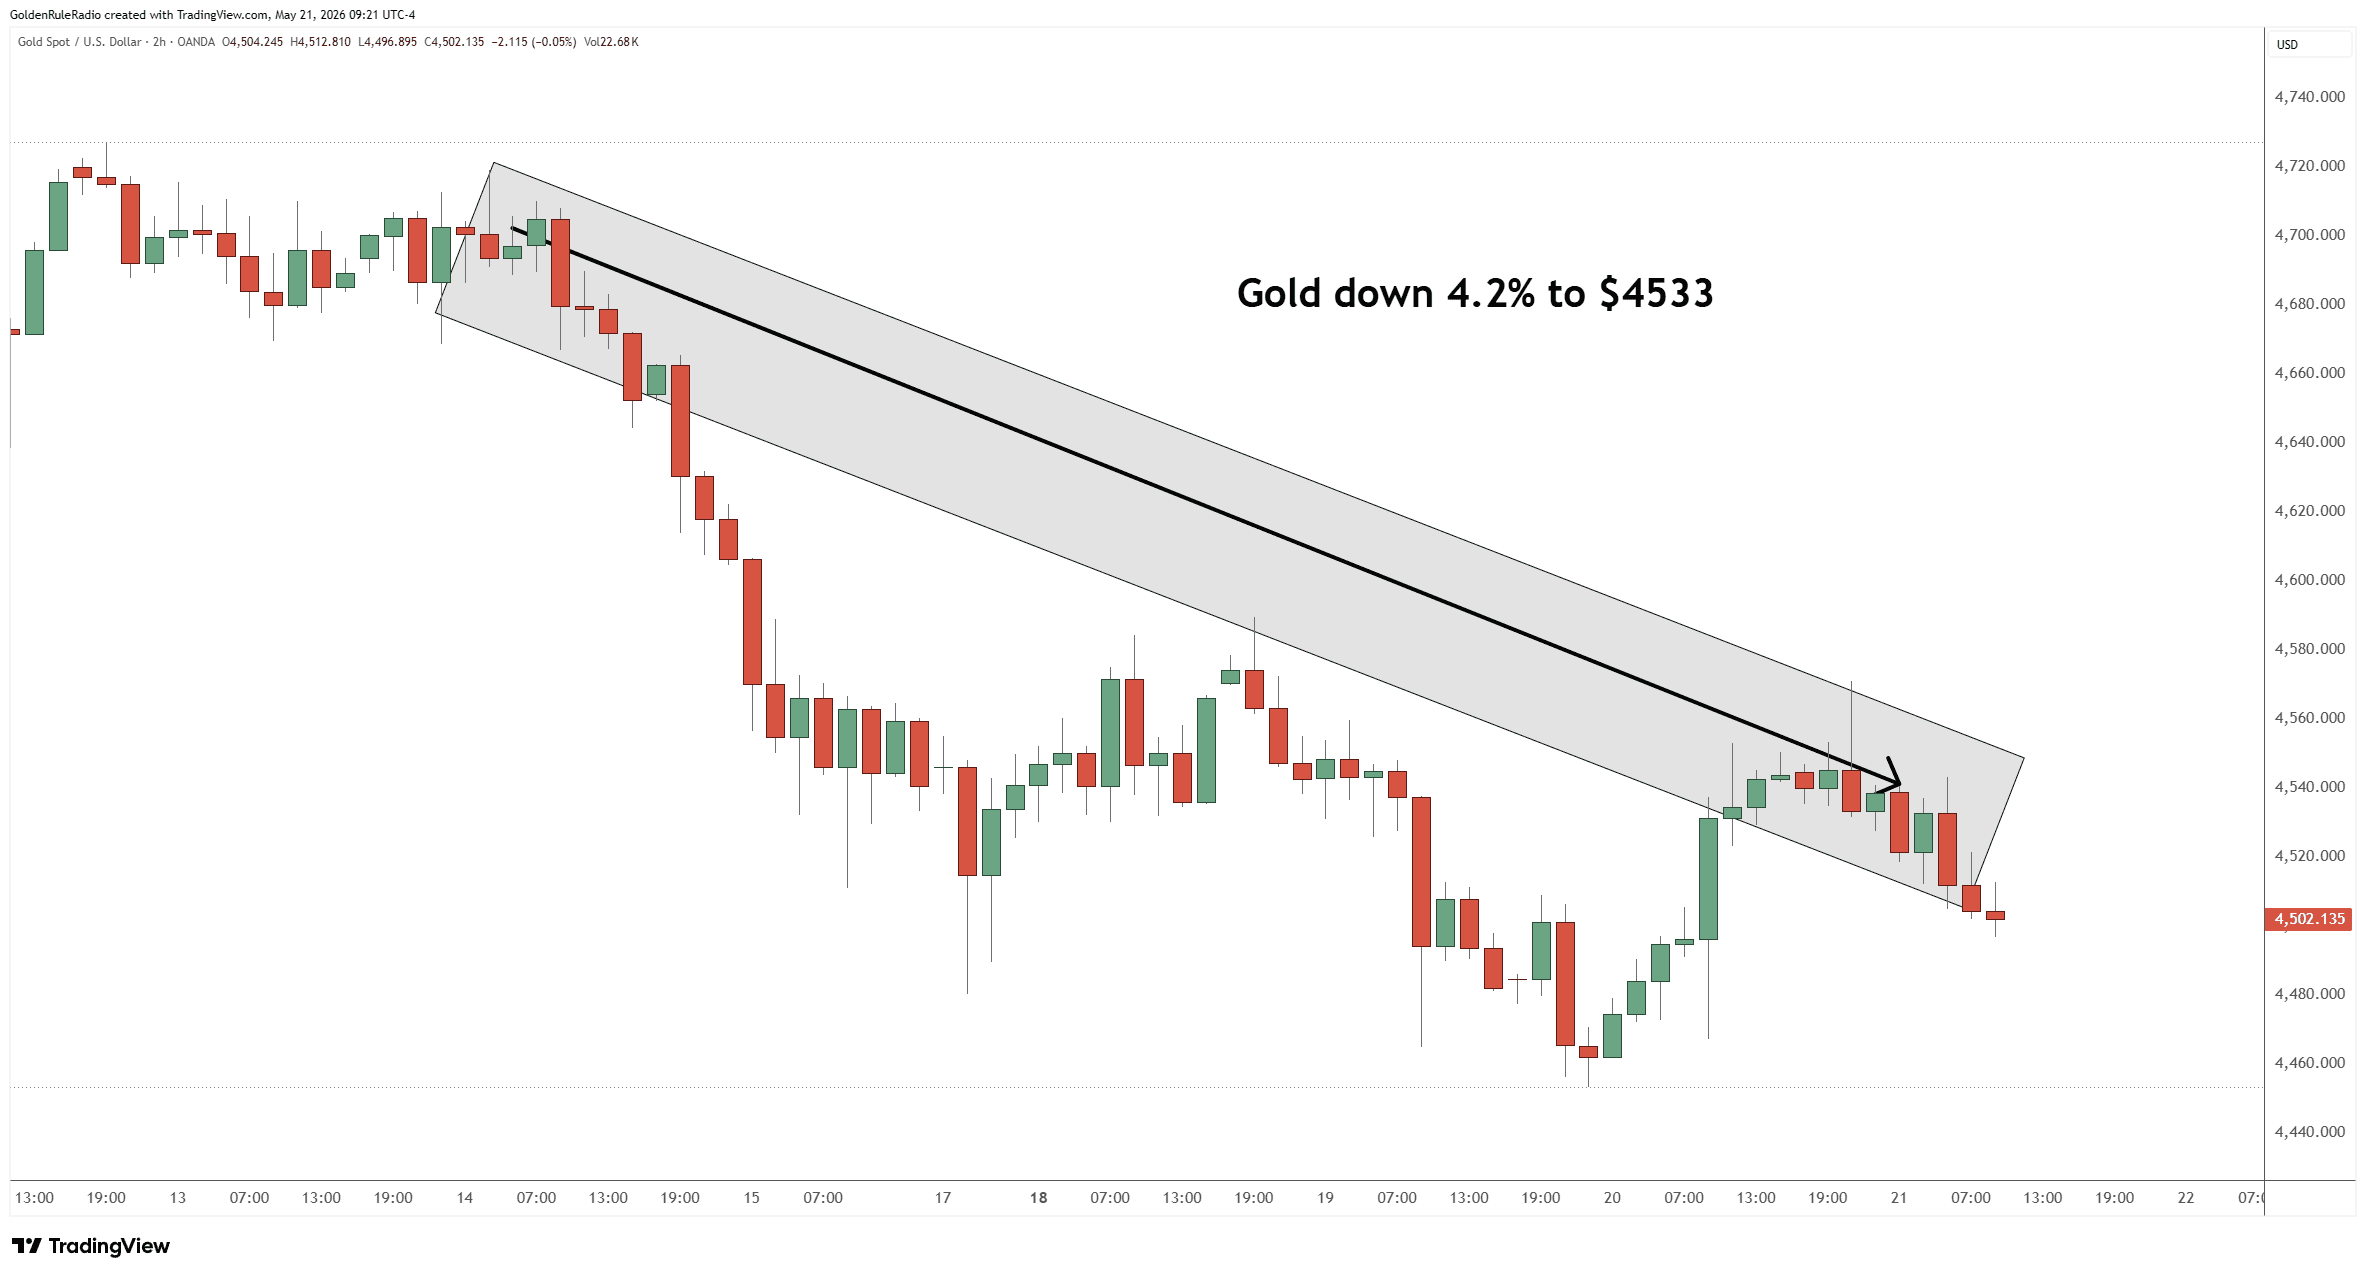
The price of gold is down about 4% on the week at roughly $4,540.
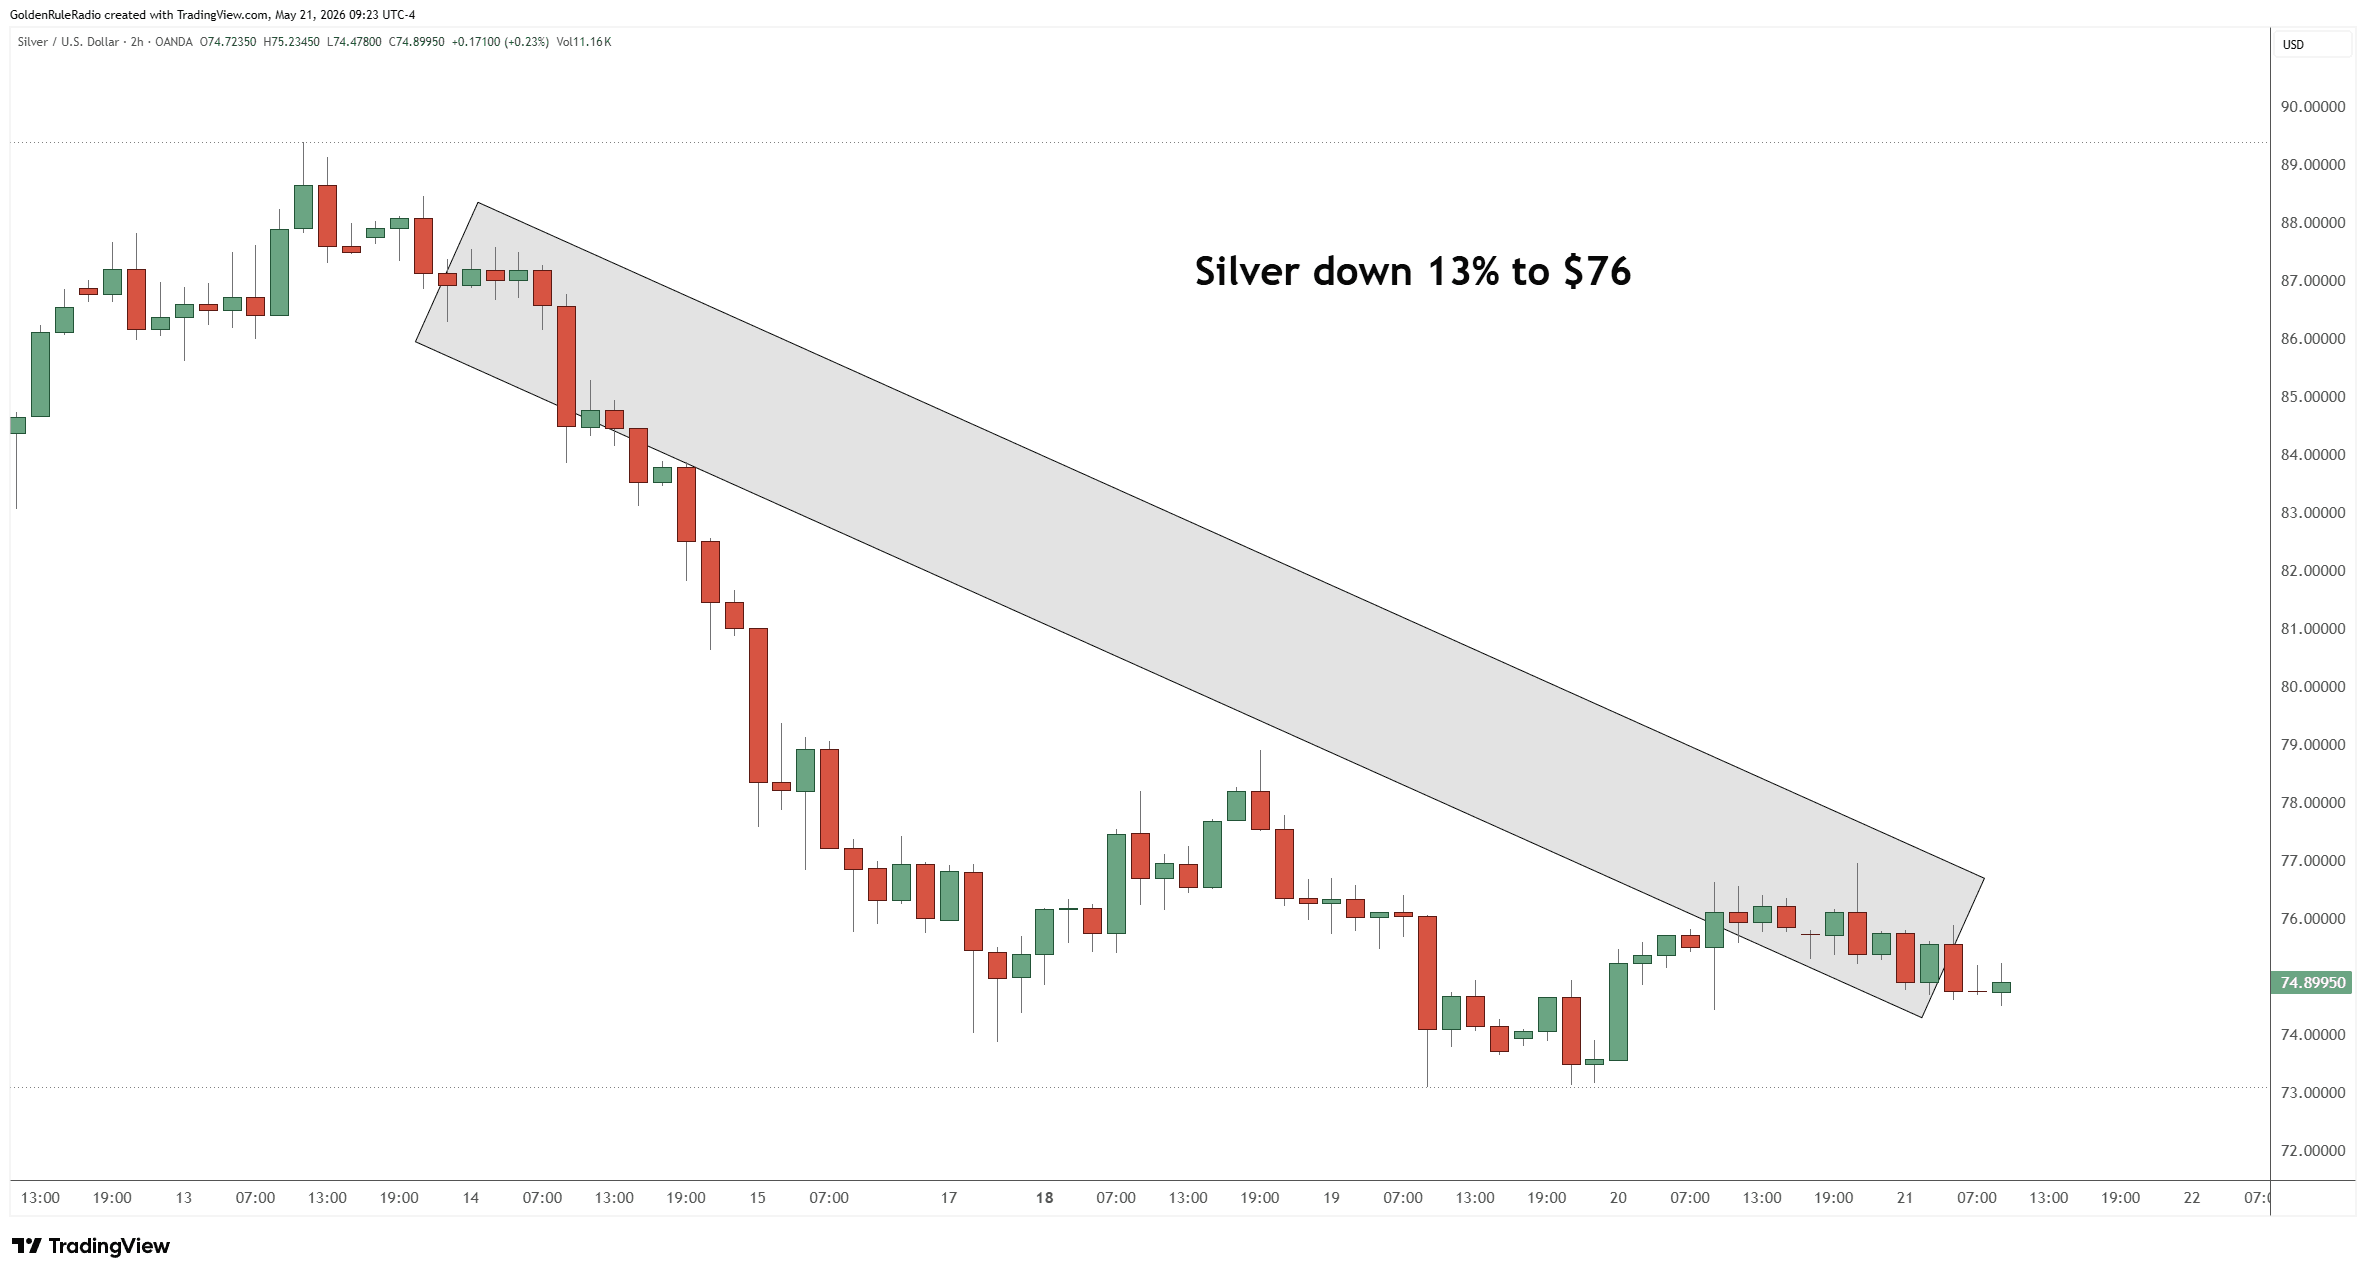
The price of silver fell 13%, dropping down to $76.
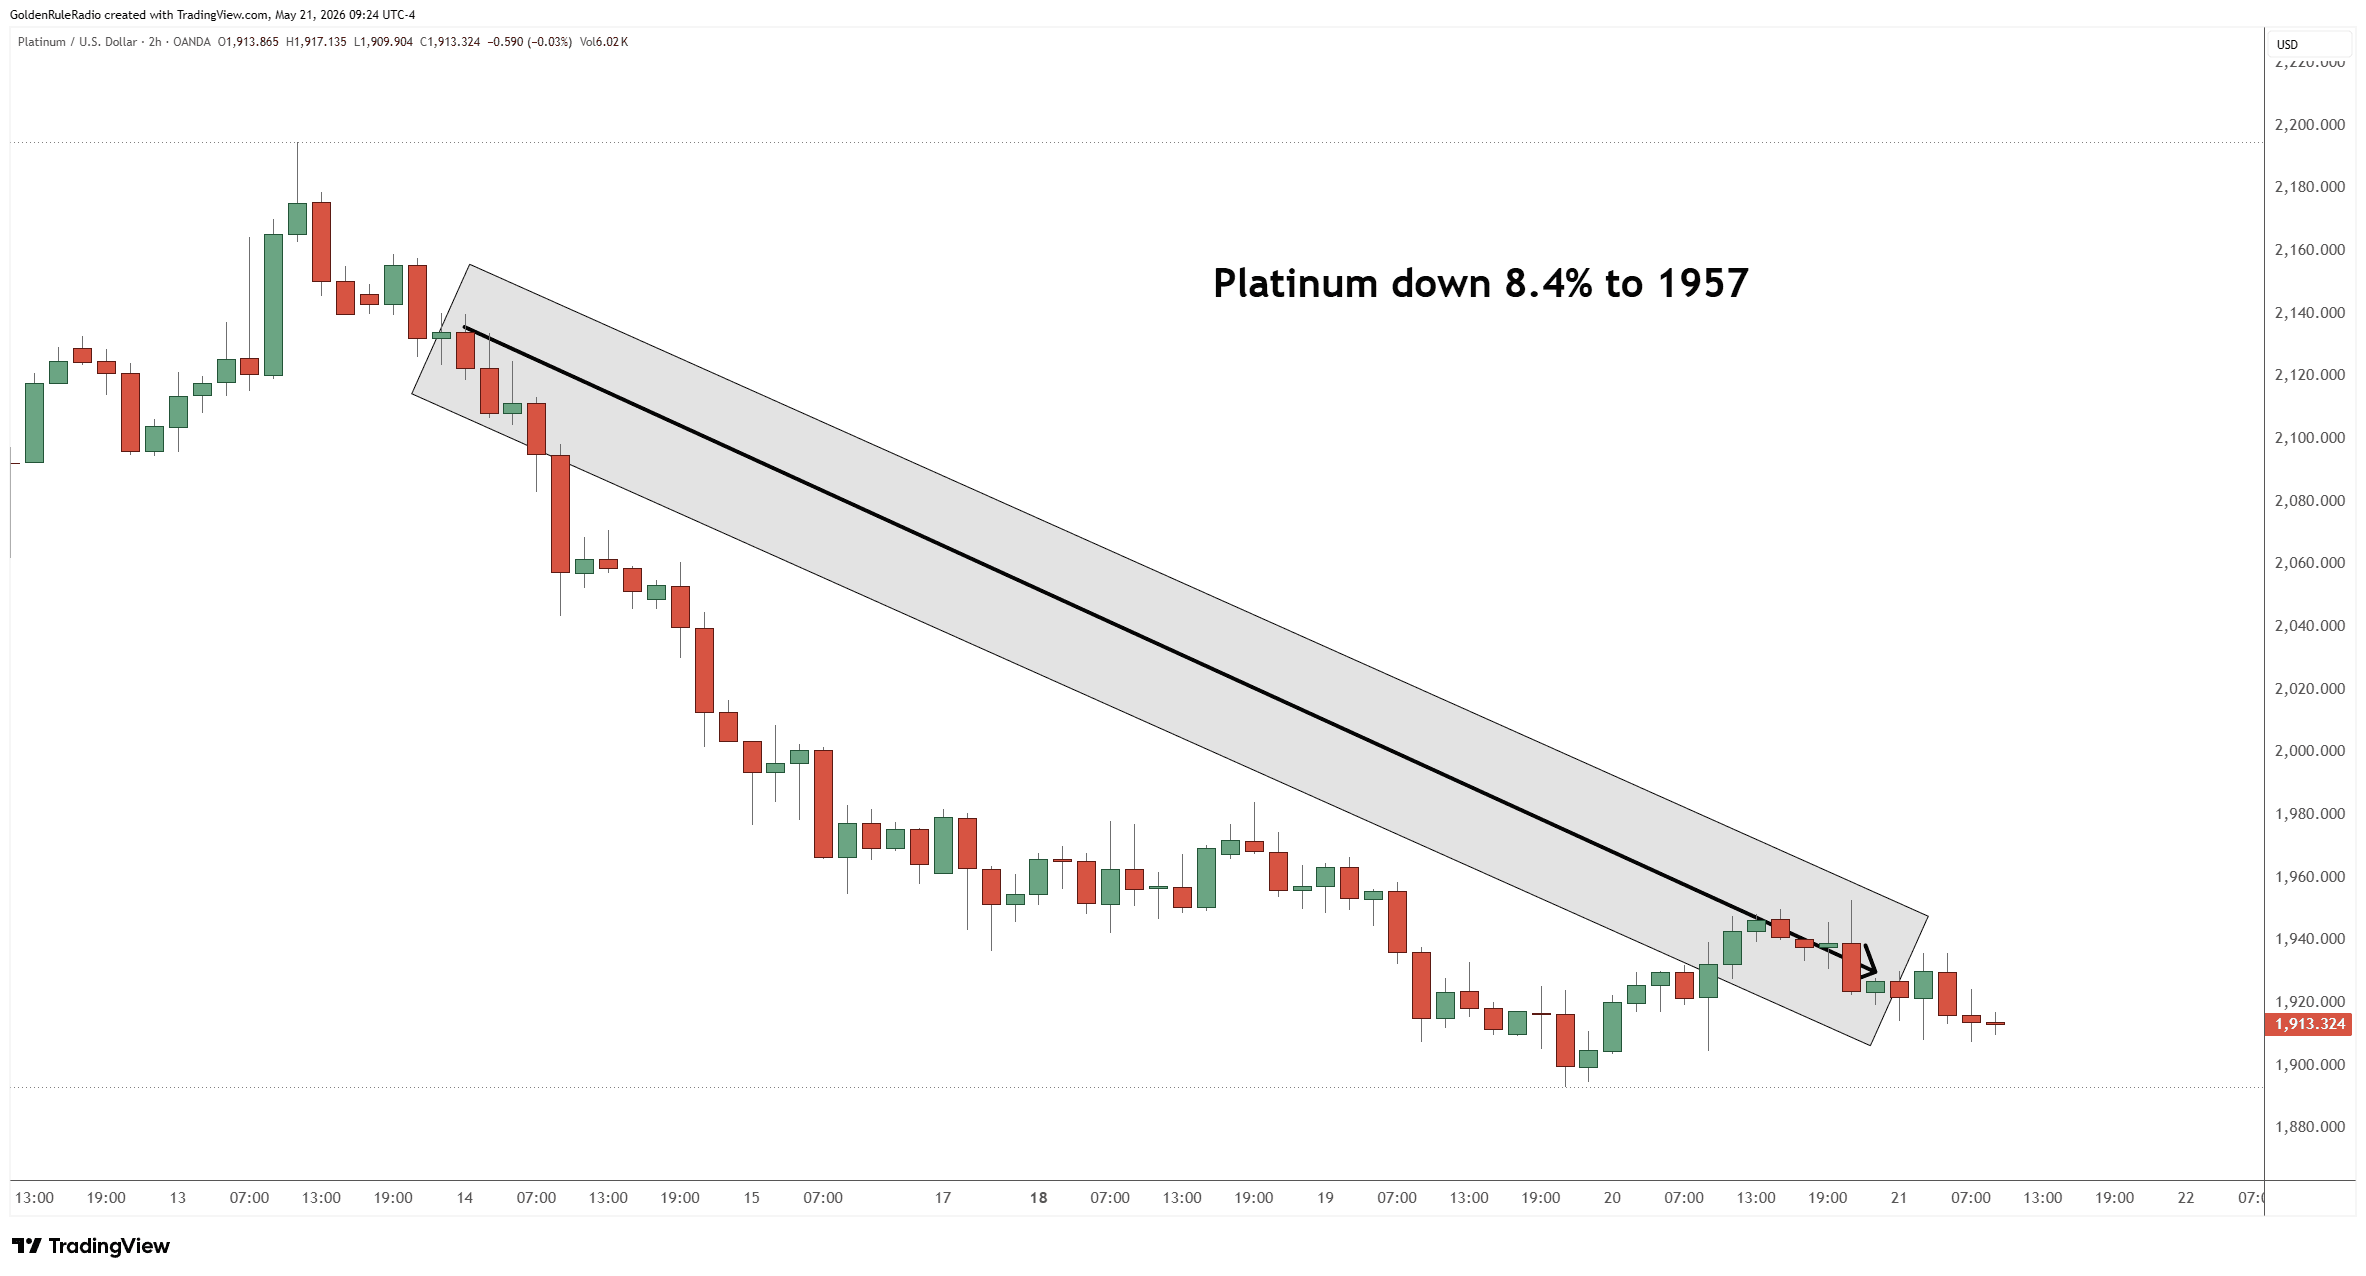
Platinum dropped 8.4% to $1,957.
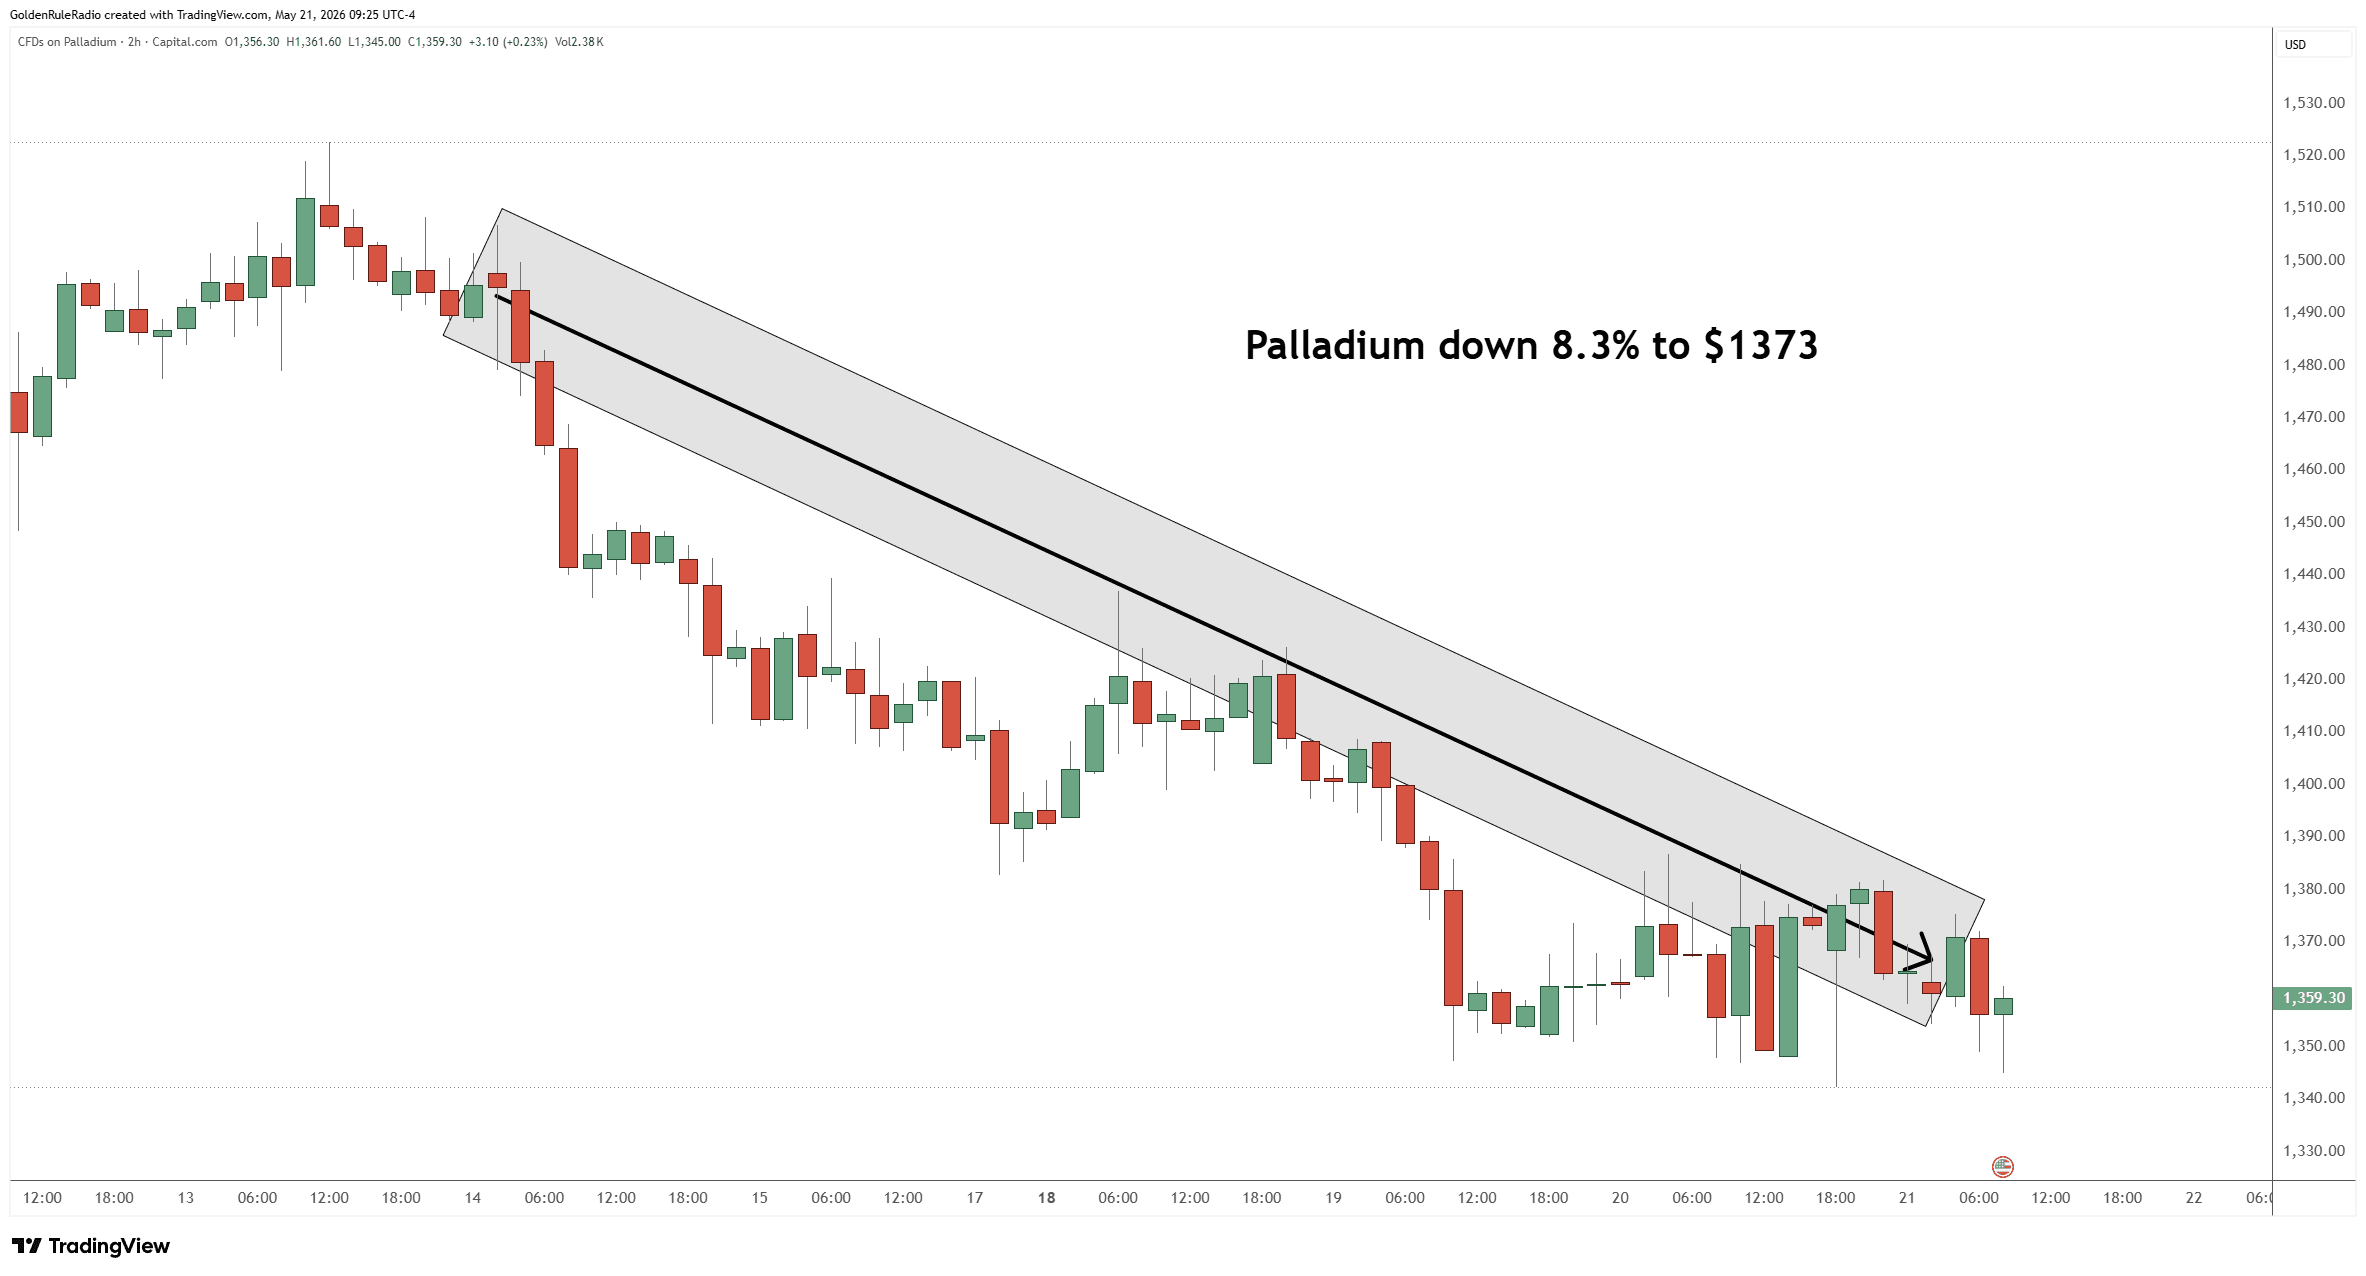
Palladium fell about 8% to $1,373.
Taking a look over at the paper markets…
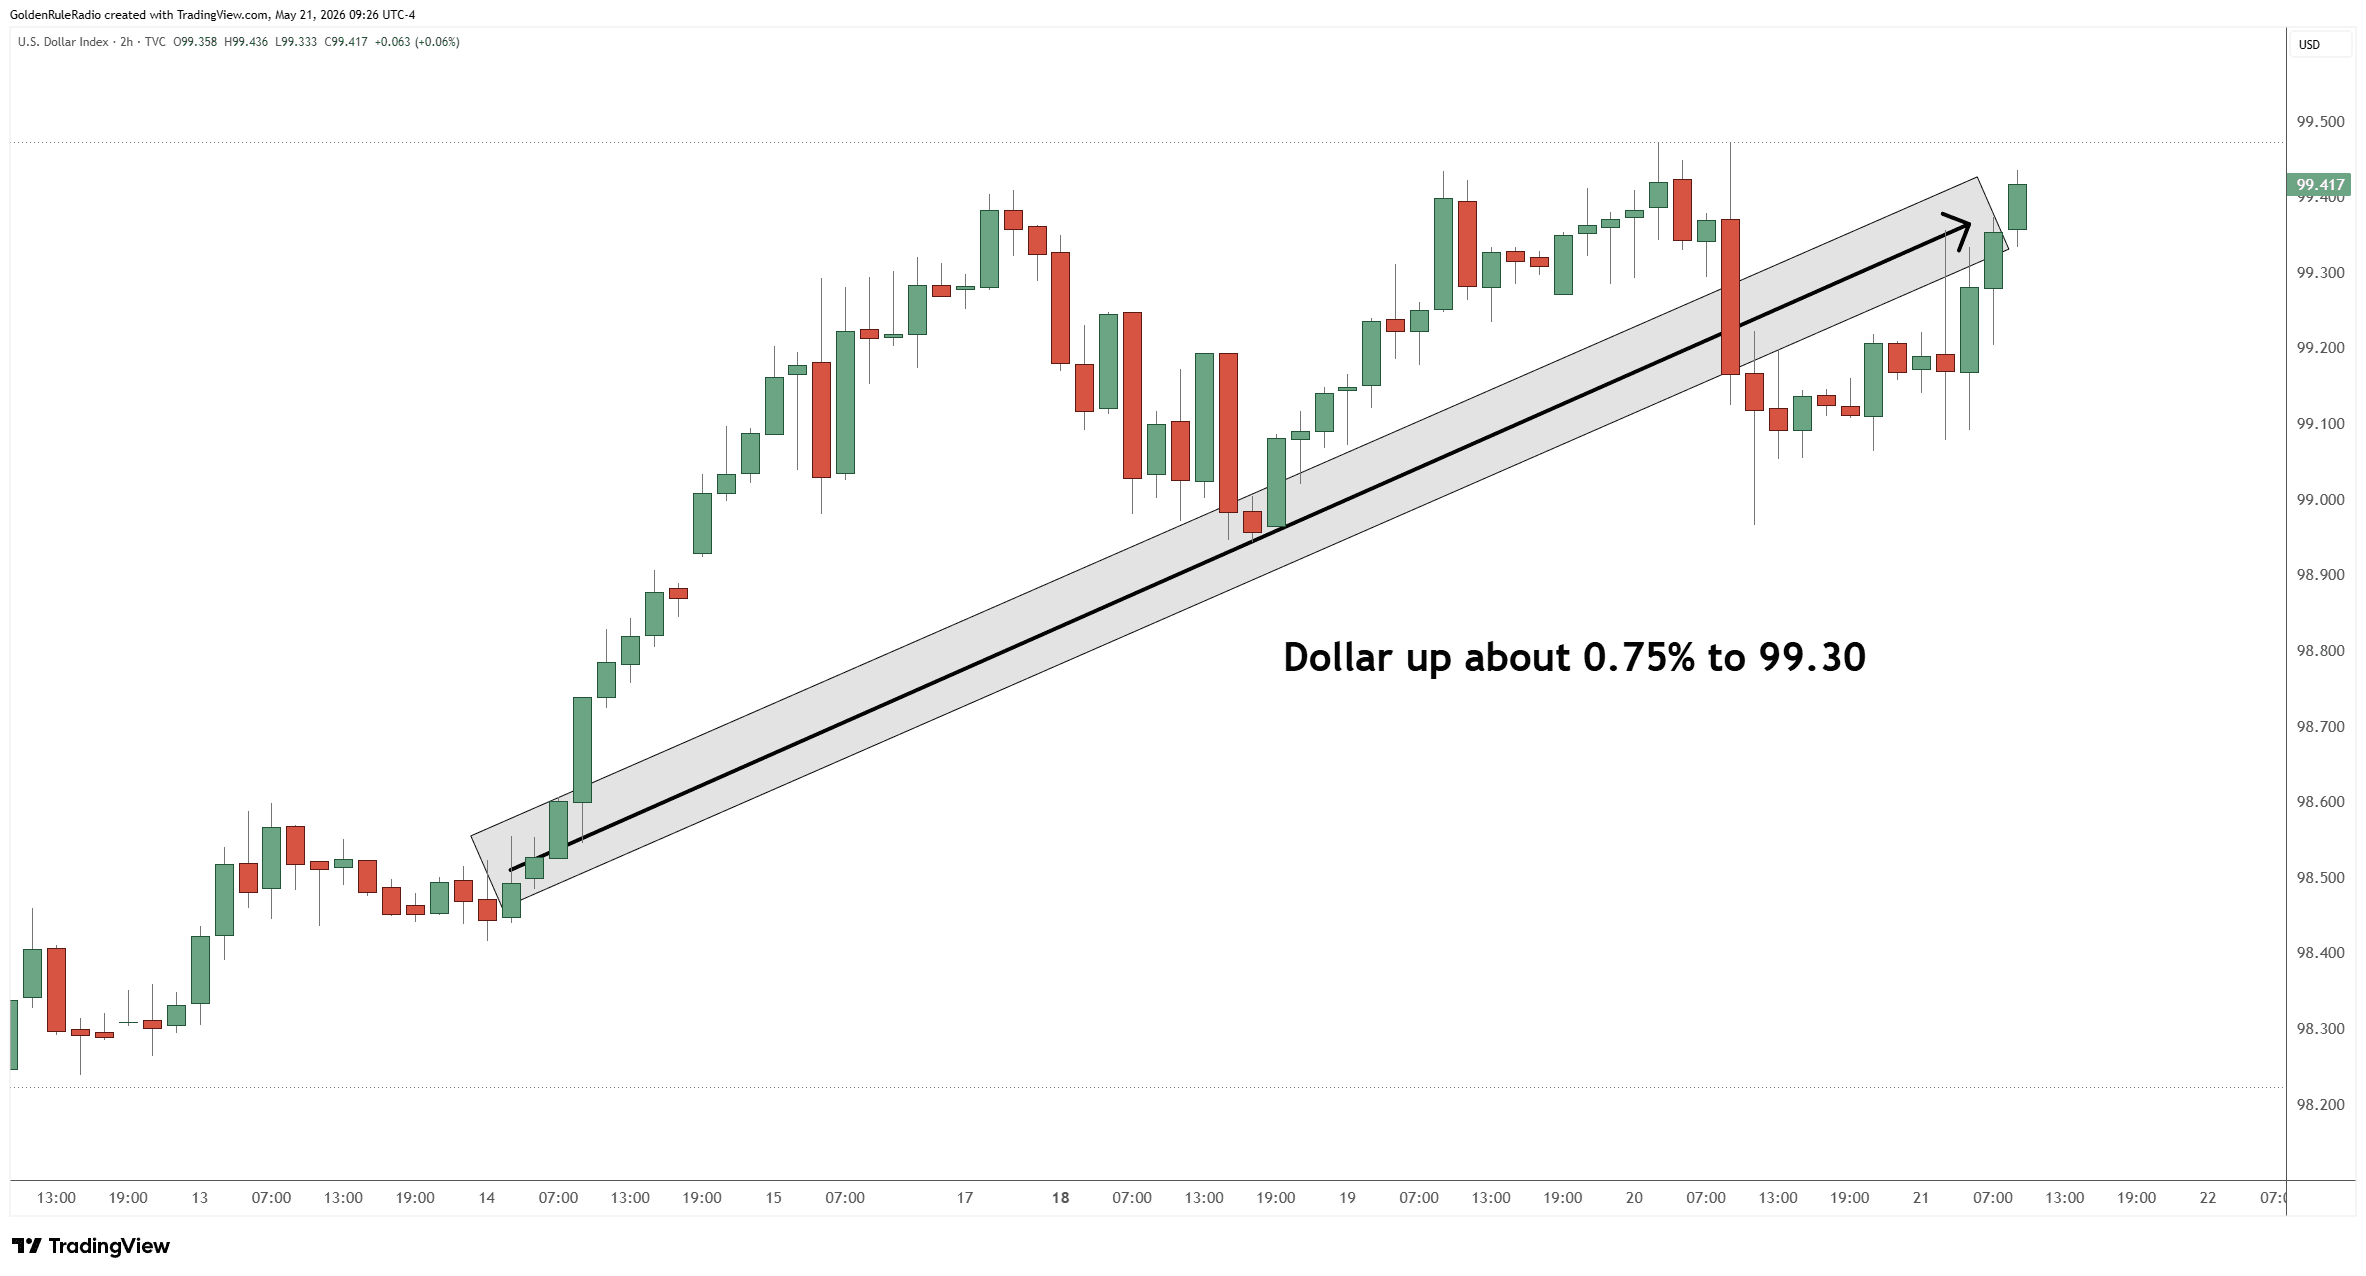
The US dollar index is flat, sitting at just over $99.
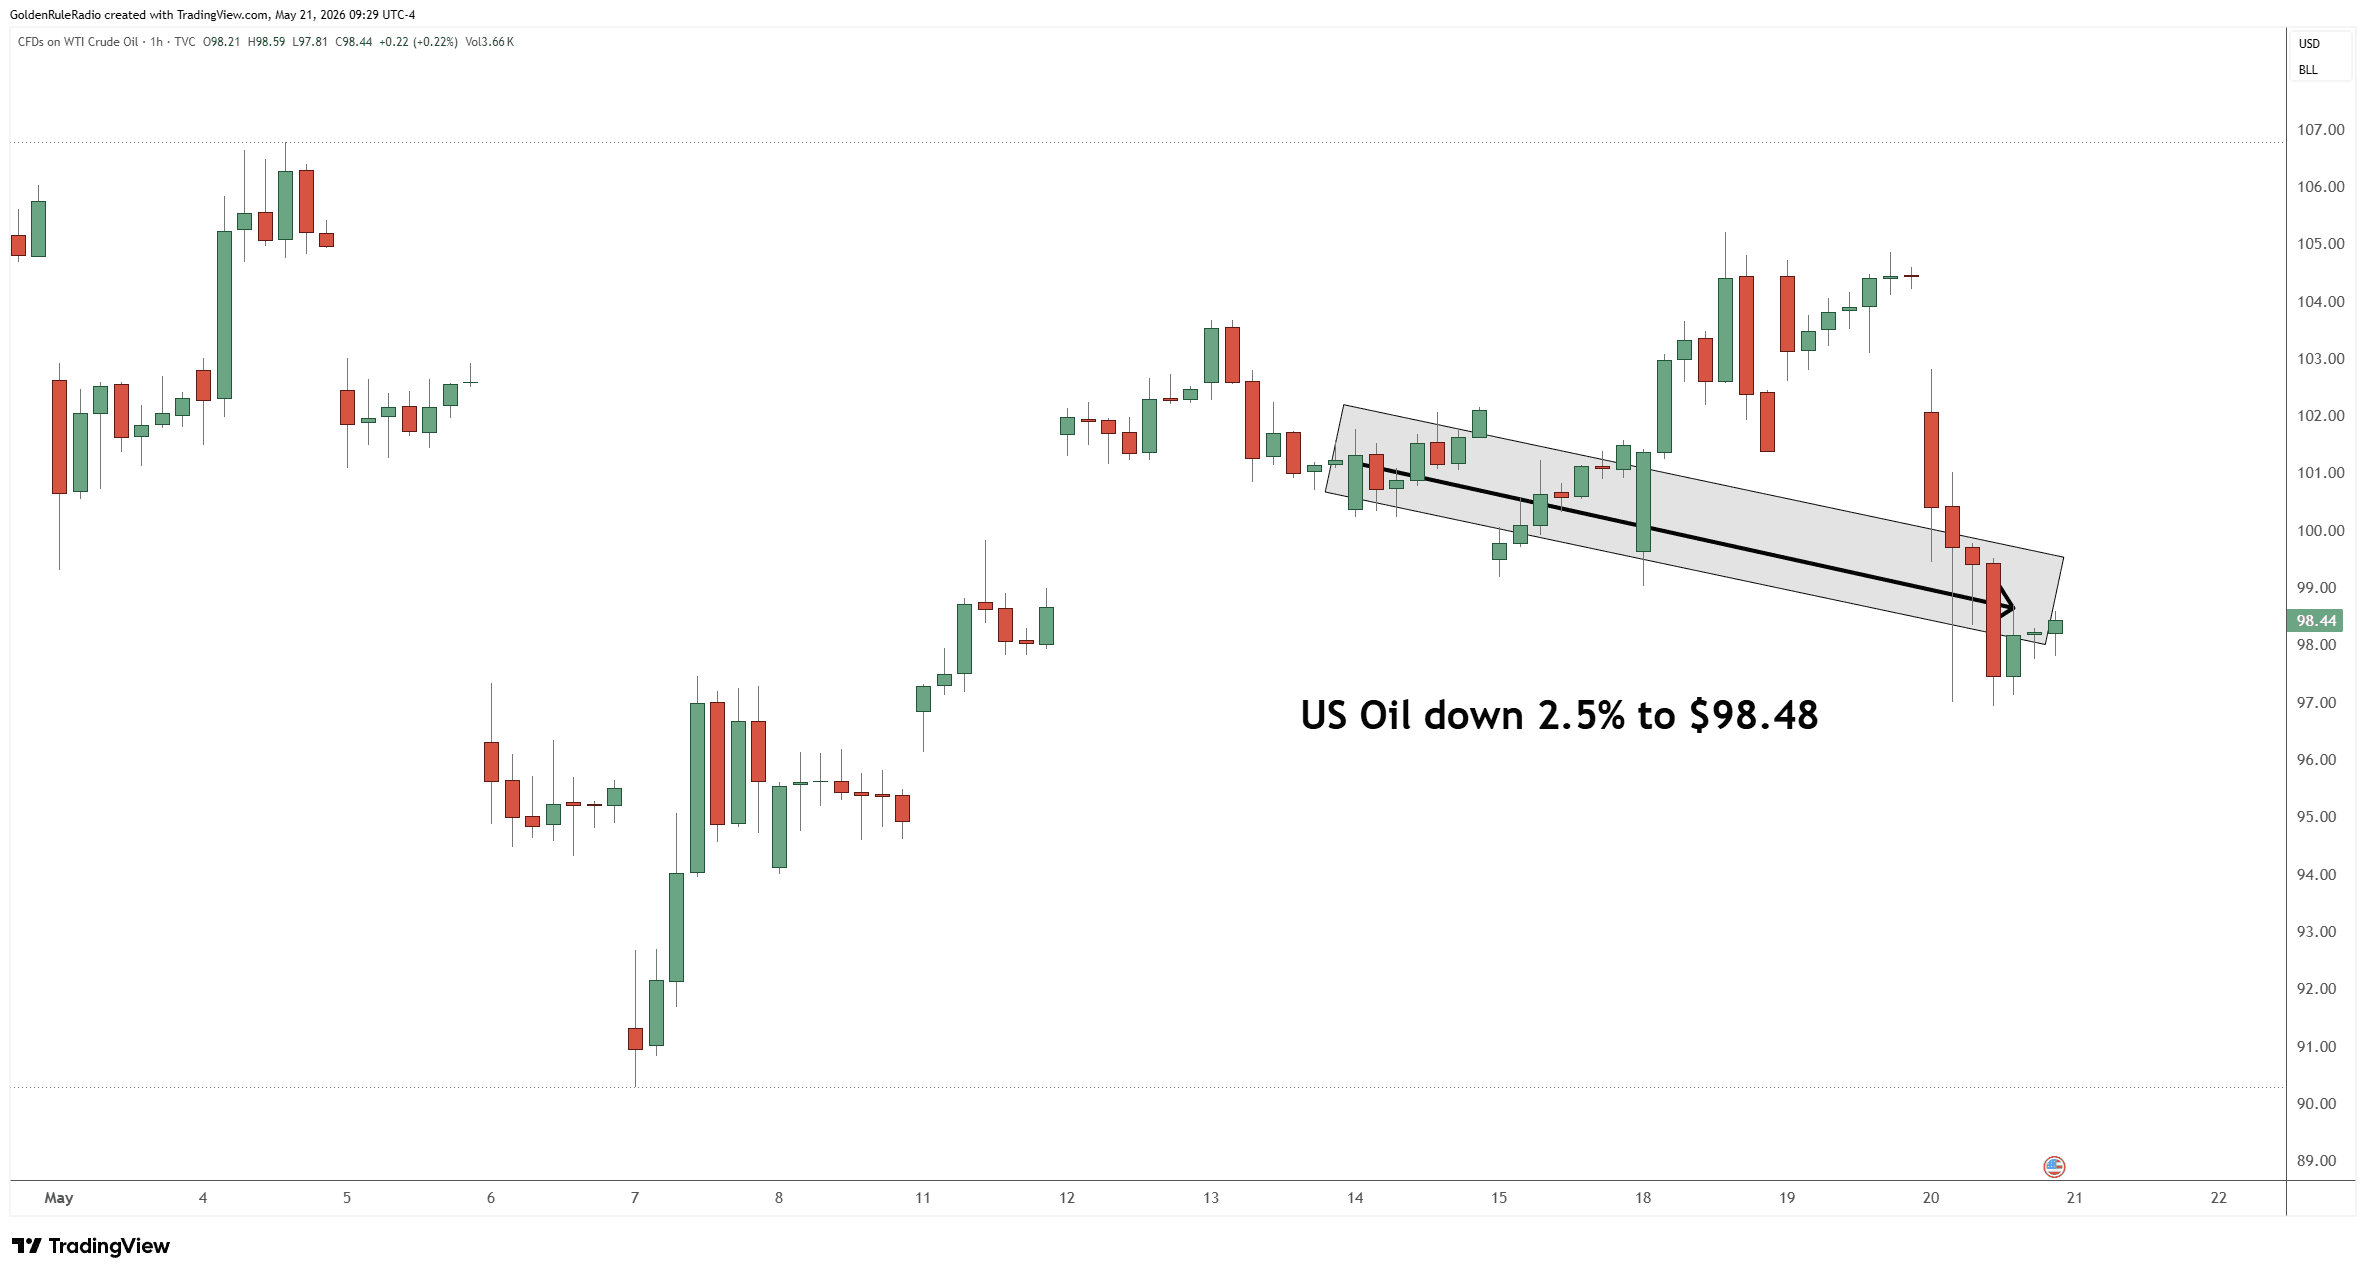
Oil is just below $100 at $98.48.
Despite the week’s weakness, gold remains up about 4.7% year-to-date — a respectable pace, even if it trails the exceptional 15–24% gains seen at this same point in 2024 and 2025.
Gold Retreats, Treasurys Surge
Gold isn’t falling because the bull market is broken. It’s falling because treasury yields are surging, and that’s creating a powerful short-term headwind.
The 2-year yield is just over 4%, the 10-year sits at 4.684%, and the 30-year has climbed to 5.195% — the highest level since 2007, even higher than the yield spikes seen in 2023.
When the 10-year pushes toward 4.4% and beyond, it raises the opportunity cost of holding non-yielding assets like gold, and it signals stress in the bond market that can temporarily pull capital away from metals.
The deeper issue is the national debt picture. The more the U.S. borrows, the higher the yield it must offer to attract buyers — and as confidence in the dollar and U.S. bonds erodes over time, those yields will continue to be a source of volatility for metals in the short run, even as they confirm the long-run case for gold ownership.
Strong Technical Support for Gold
Gold has been tracing a declining short-term channel since the January high, with the 20-day and 50-day moving averages now trending downward. However, the 200-day moving average remains firmly pointed up and currently sits near $4,341 — only about 5% below current prices, and the same level that acted as a major support floor when gold hit its March low around $4,100.
Previous lows and the rising 200-day moving average are converging near the $4,400 zone, which we see as a very strong technical support band. A pullback to retest $4,100 is possible but wouldn’t signal the end of the bull market — just continued short-term dollar strength and yield pressure.
5 Reasons Equities Are Overvalued
While gold corrects from all-time highs, stocks continue to flash warning signs that make the case for metals exposure even more compelling. As evidence, these five valuation measures are all sitting at or near record extremes:
- The Buffett Indicator (stock market cap to GDP) has never been higher
- Price-to-sales is at an all-time high of 3.5x
- Price-to-book is at an all-time high of 5.5x
- The forward P/E ratio of 26x matches the peak of the dot-com bubble
- And dividend yield has collapsed to just 1%, near a record low.
This isn’t speculation — it’s math. And it’s why major Wall Street firms are quietly shifting their model allocations, moving away from the traditional 60/40 stock-bond split toward models that include 20% gold. Research confirms that a portfolio with meaningful gold exposure not only outperforms over time but reduces drawdowns significantly when equity markets correct.
What the Macro Forecasters Are Saying
Despite the short-term choppiness, institutional price targets for gold remain aggressive. Goldman Sachs is forecasting $5,400 by year-end, UBS sees $5,900, Deutsche Bank targets $6,000, and JP Morgan is at $6,300. These aren’t gold newsletter predictions — they’re major financial institutions recalibrating their models around the structural realities of deficit spending, money supply growth, and geopolitical fragmentation.
The Hedgeye “quad” macro framework suggests the U.S. is currently in a growth-and-inflation-accelerating phase, but will likely shift toward slowing growth with persistent inflation by Q3. This is a stagflationary setup that has historically been among the strongest environments for gold. When that eventually forces the Fed’s hand toward rate cuts and balance sheet expansion, the backdrop for metals becomes even more favorable.
The Bottom Line
Short-term price pressure from treasury yields and dollar strength is real, but it’s operating within a long-term bull market that remains intact. The 200-day moving average, converging support levels near $4,400, and strong institutional demand all suggest this is a consolidation phase, not a reversal.
So don’t abandon core holdings during temporary headwinds. Use pullbacks as opportunities to accumulate or upgrade positions, and keep the long-term structural case in view.
The forces driving gold higher haven’t changed. They’re just being temporarily outweighed by yield dynamics that, historically, don’t last.
Get in Touch
To discuss your precious metals strategy, the team at McAlvany Precious Metals is available for a complimentary, no-obligation consultation. Call 800-525-9556.