

Podcast: Play in new window
Metals bounced back this week after a brutal second quarter, with gold pushing back above the $4,000 mark and silver flirting with $60 again. While the last three months delivered the worst quarterly performance in over a decade, the bigger picture — and the technical setup — still favors patient accumulators.
Let’s take a look at where prices stand as of Wednesday, July 1:
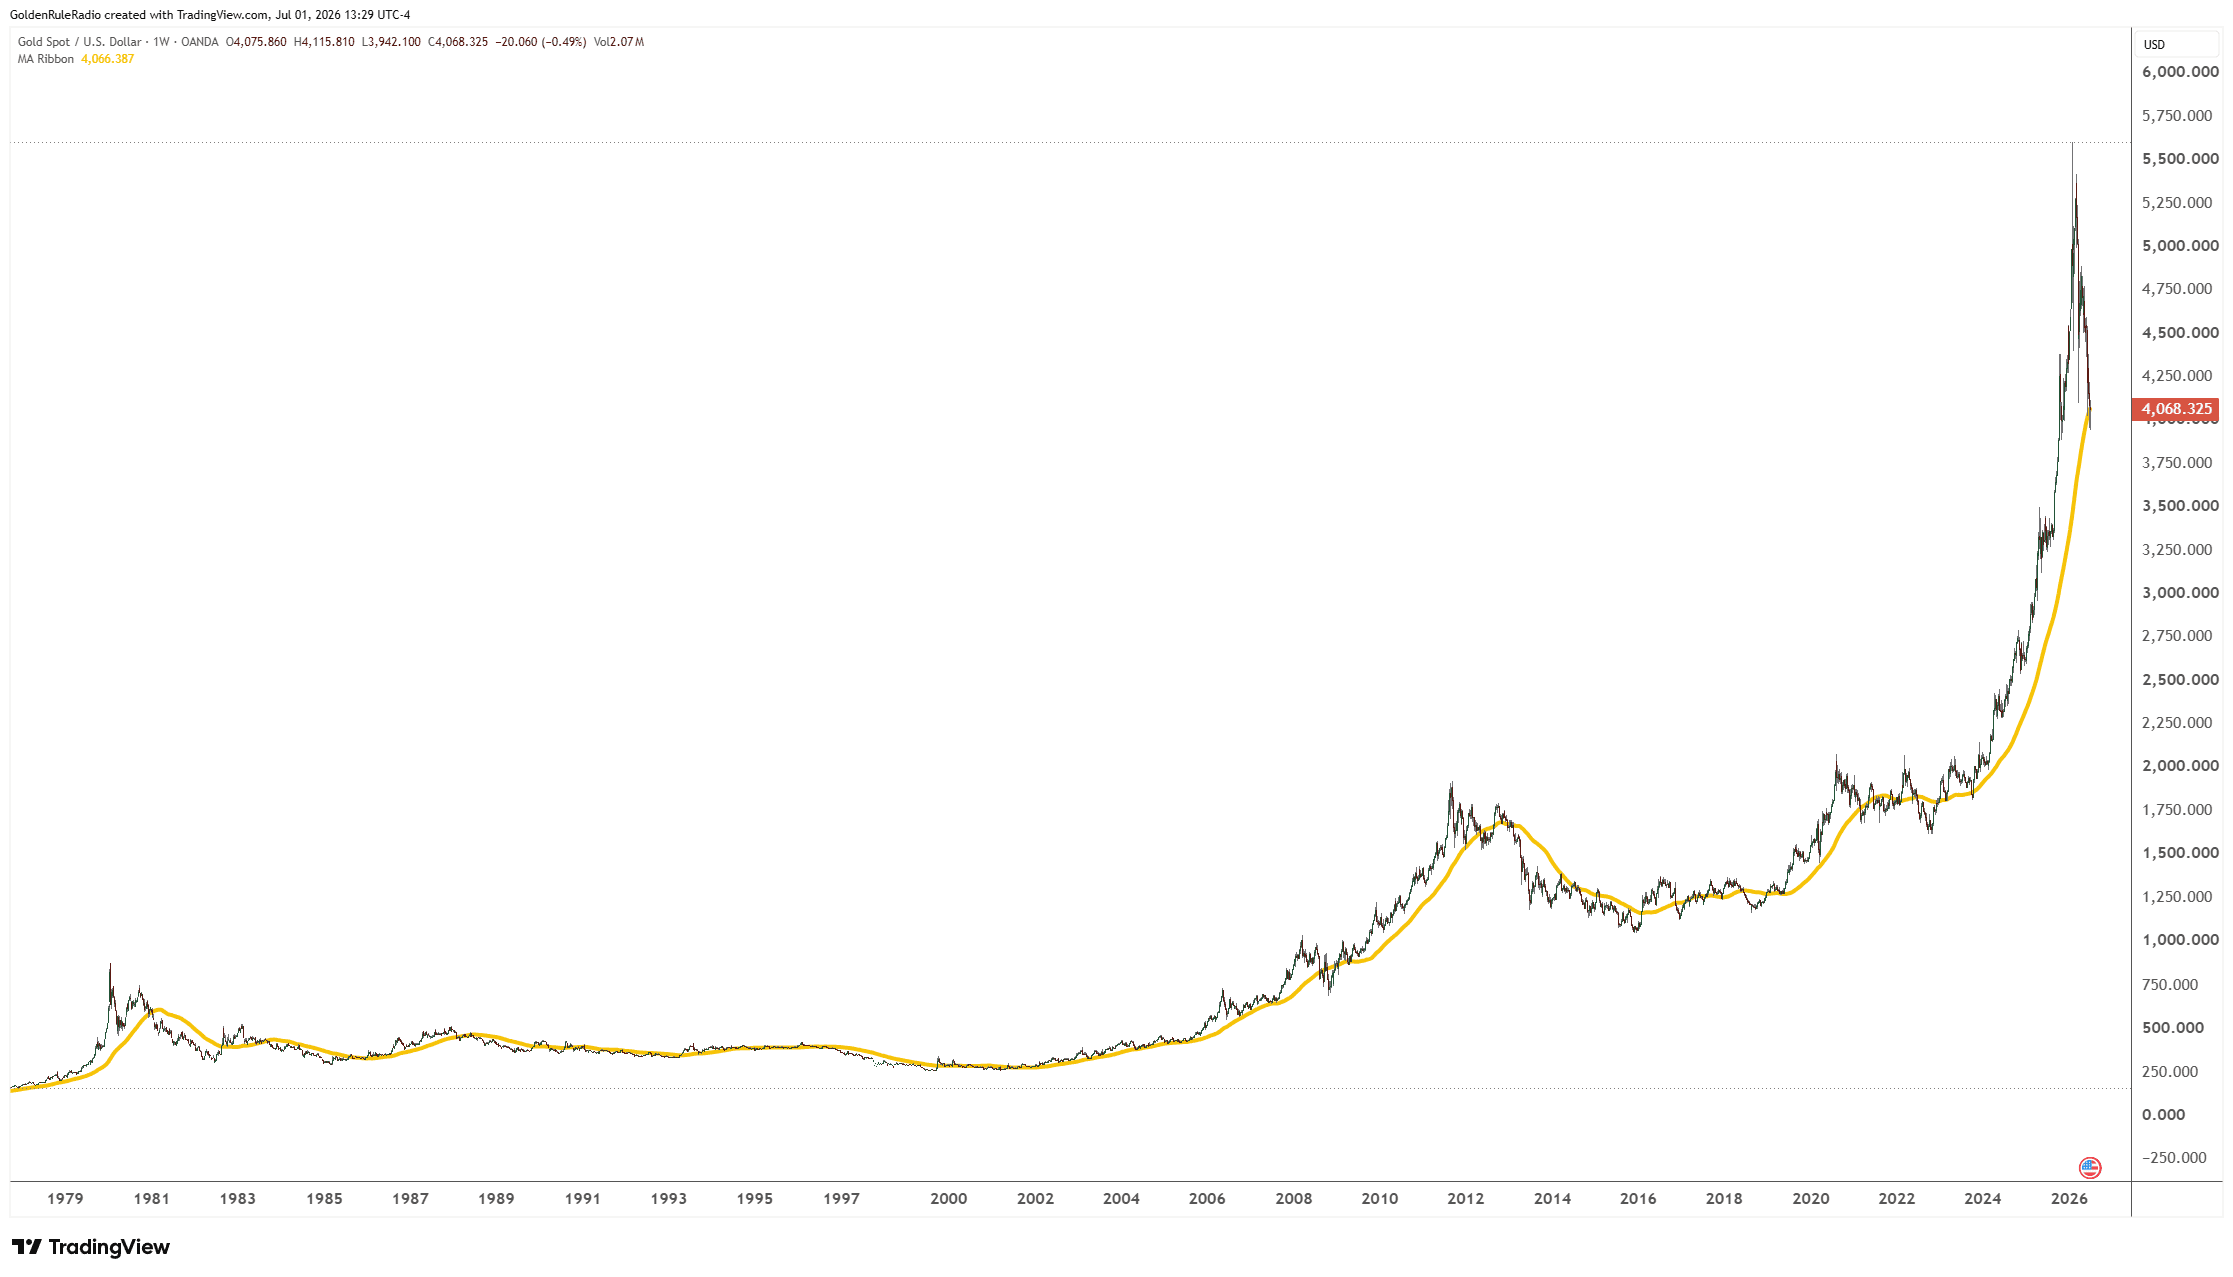
The price of gold is up about 2.4%, sitting at $4,065.
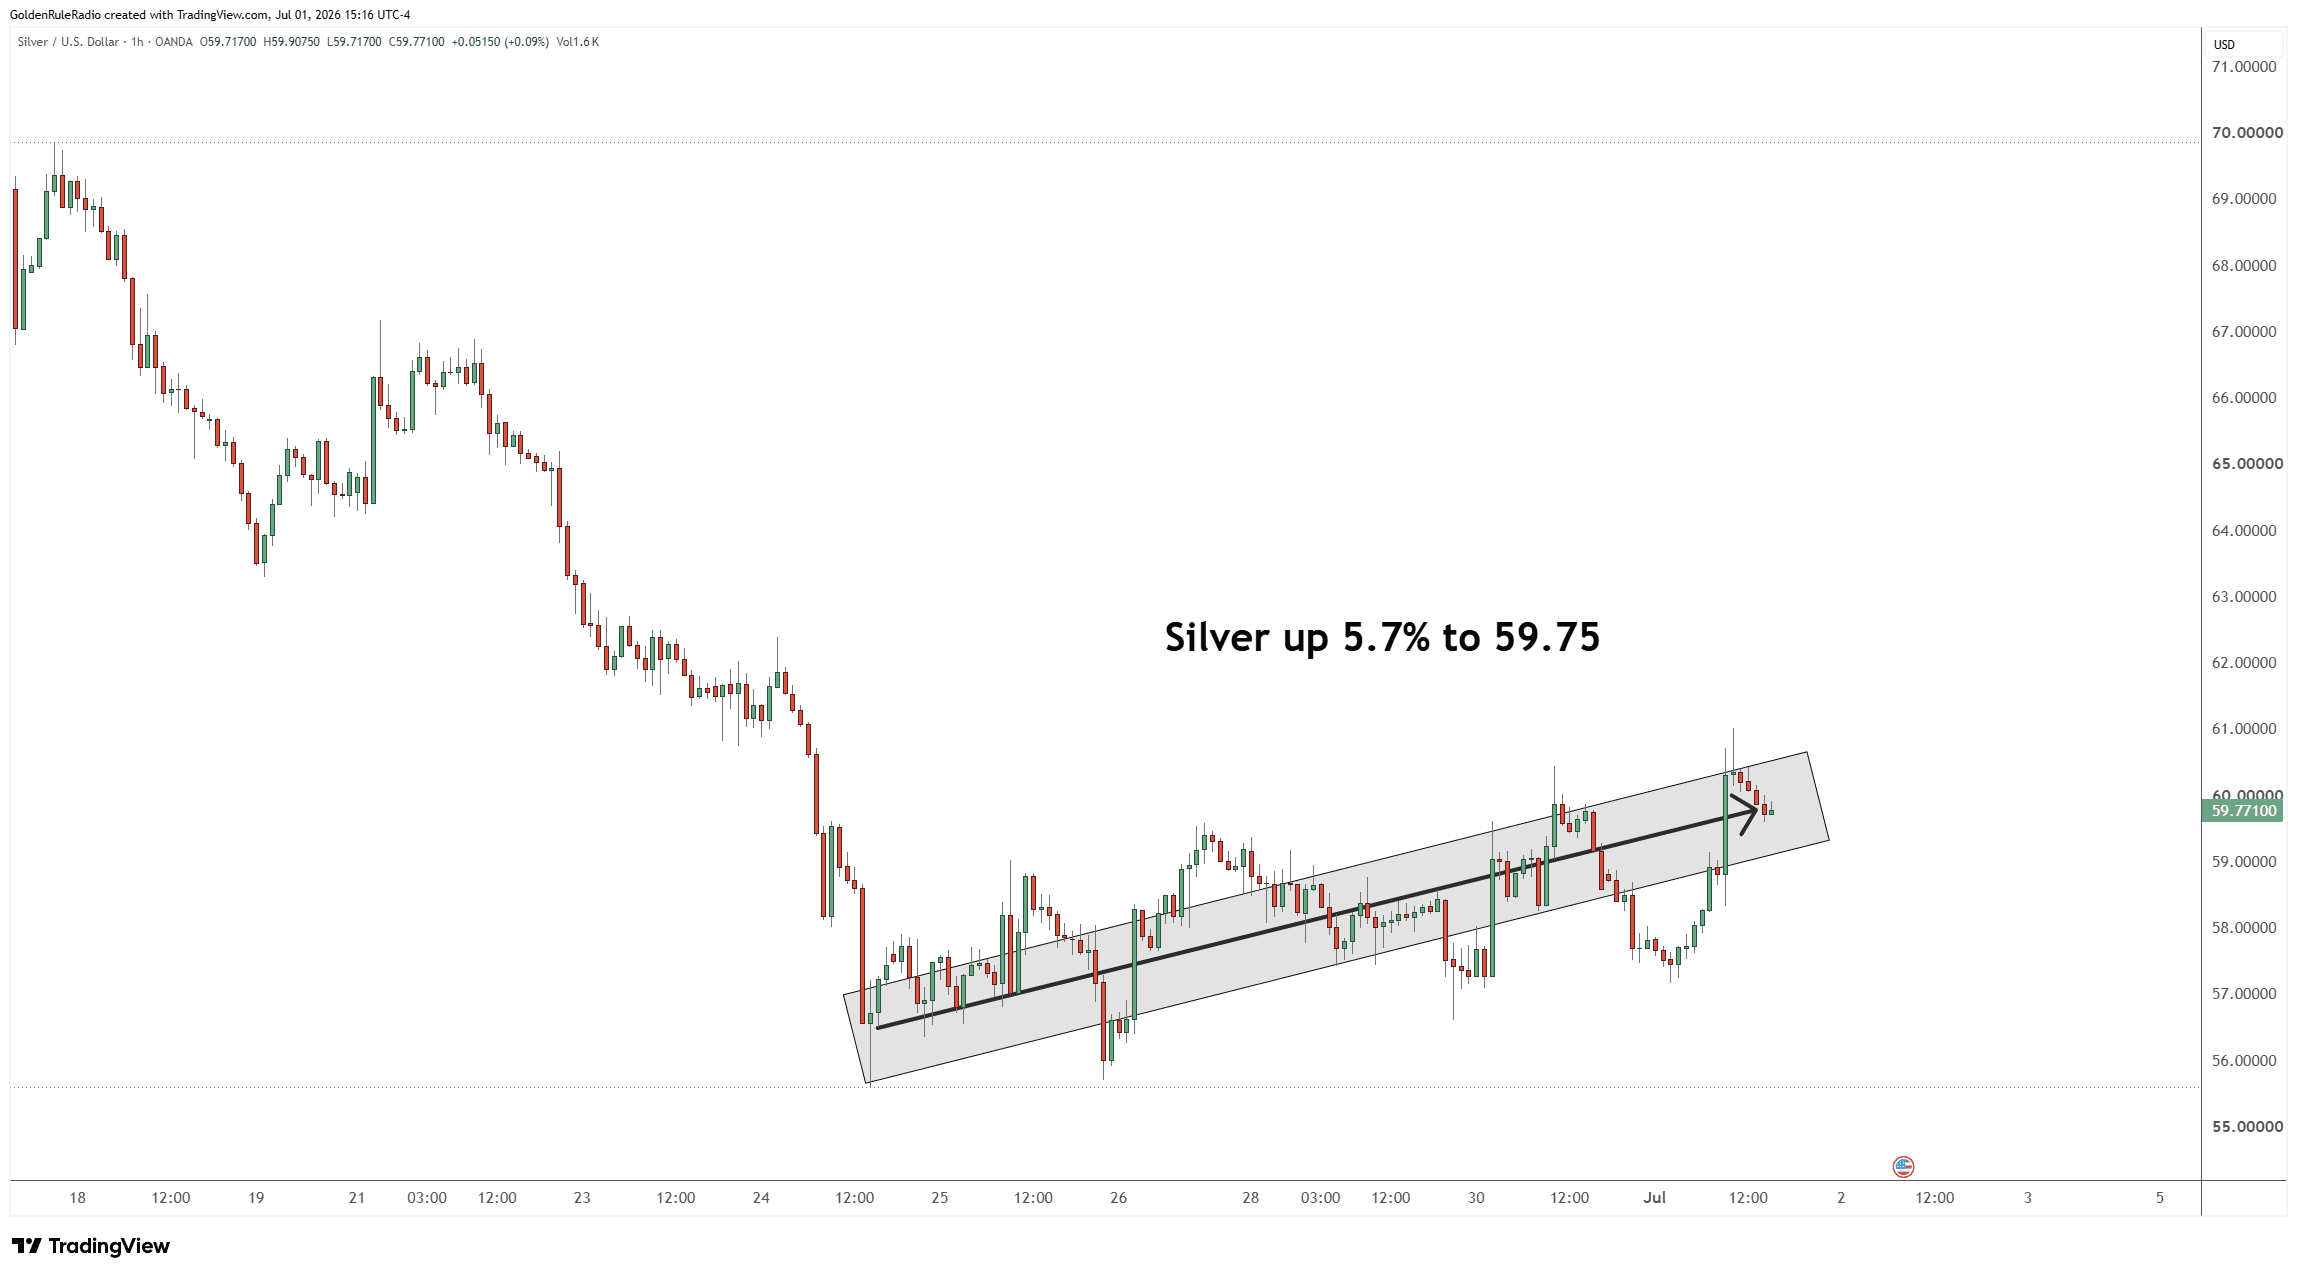
The price of silver is up 5.7%, currently at $60 and flirting with that level again after briefly dipping below it last week.
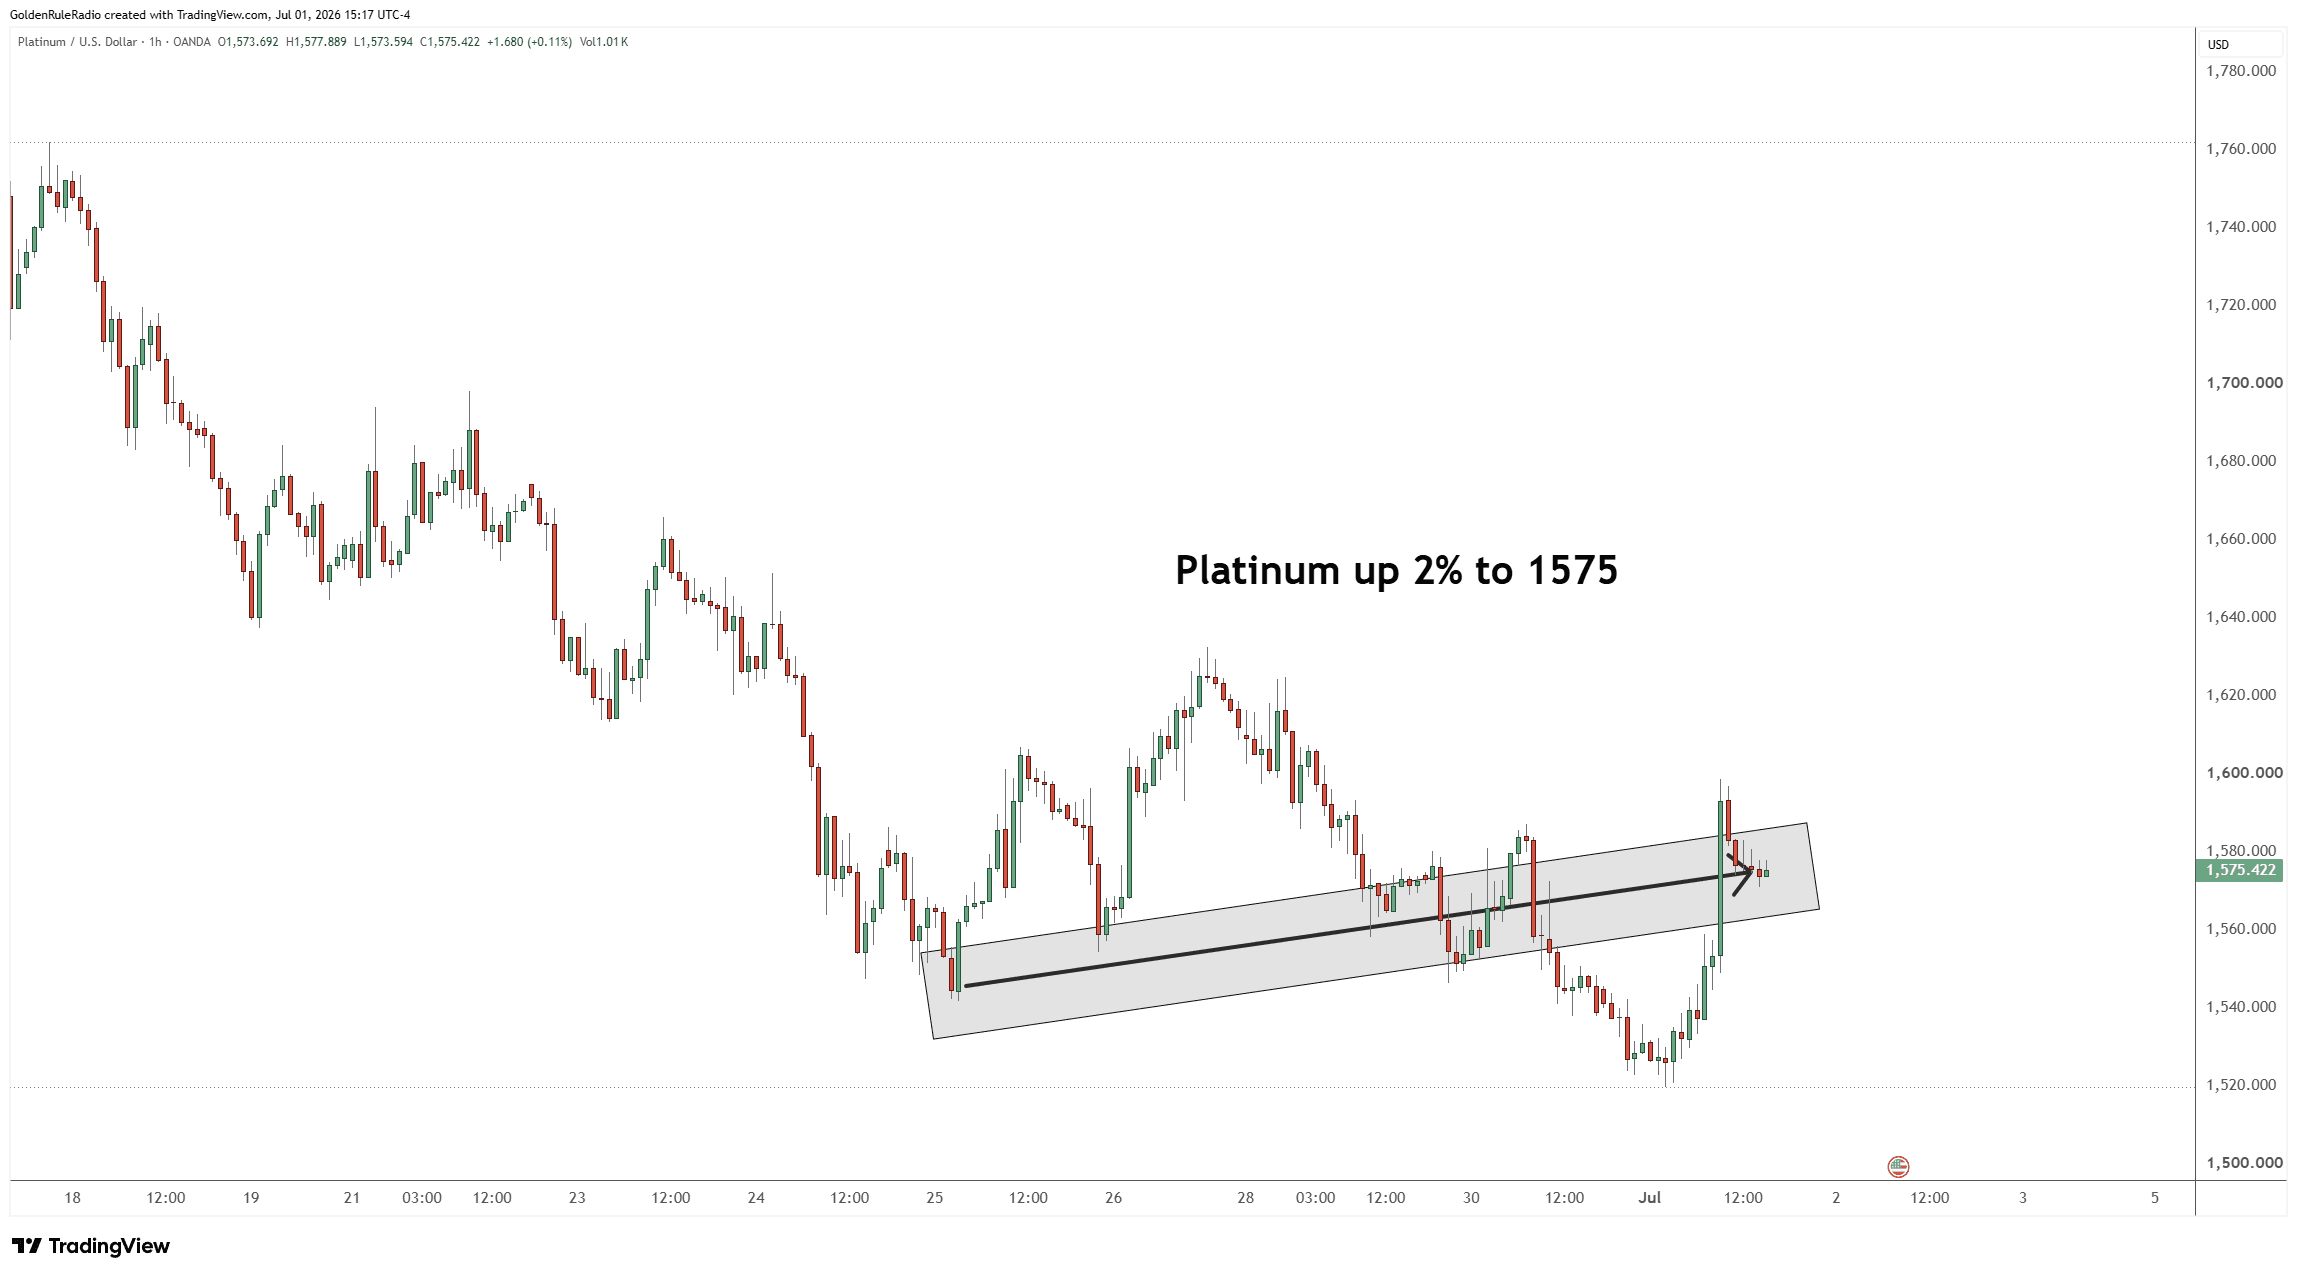
Platinum is up about 2%, sitting at $1,575, still under the $1,600 mark.
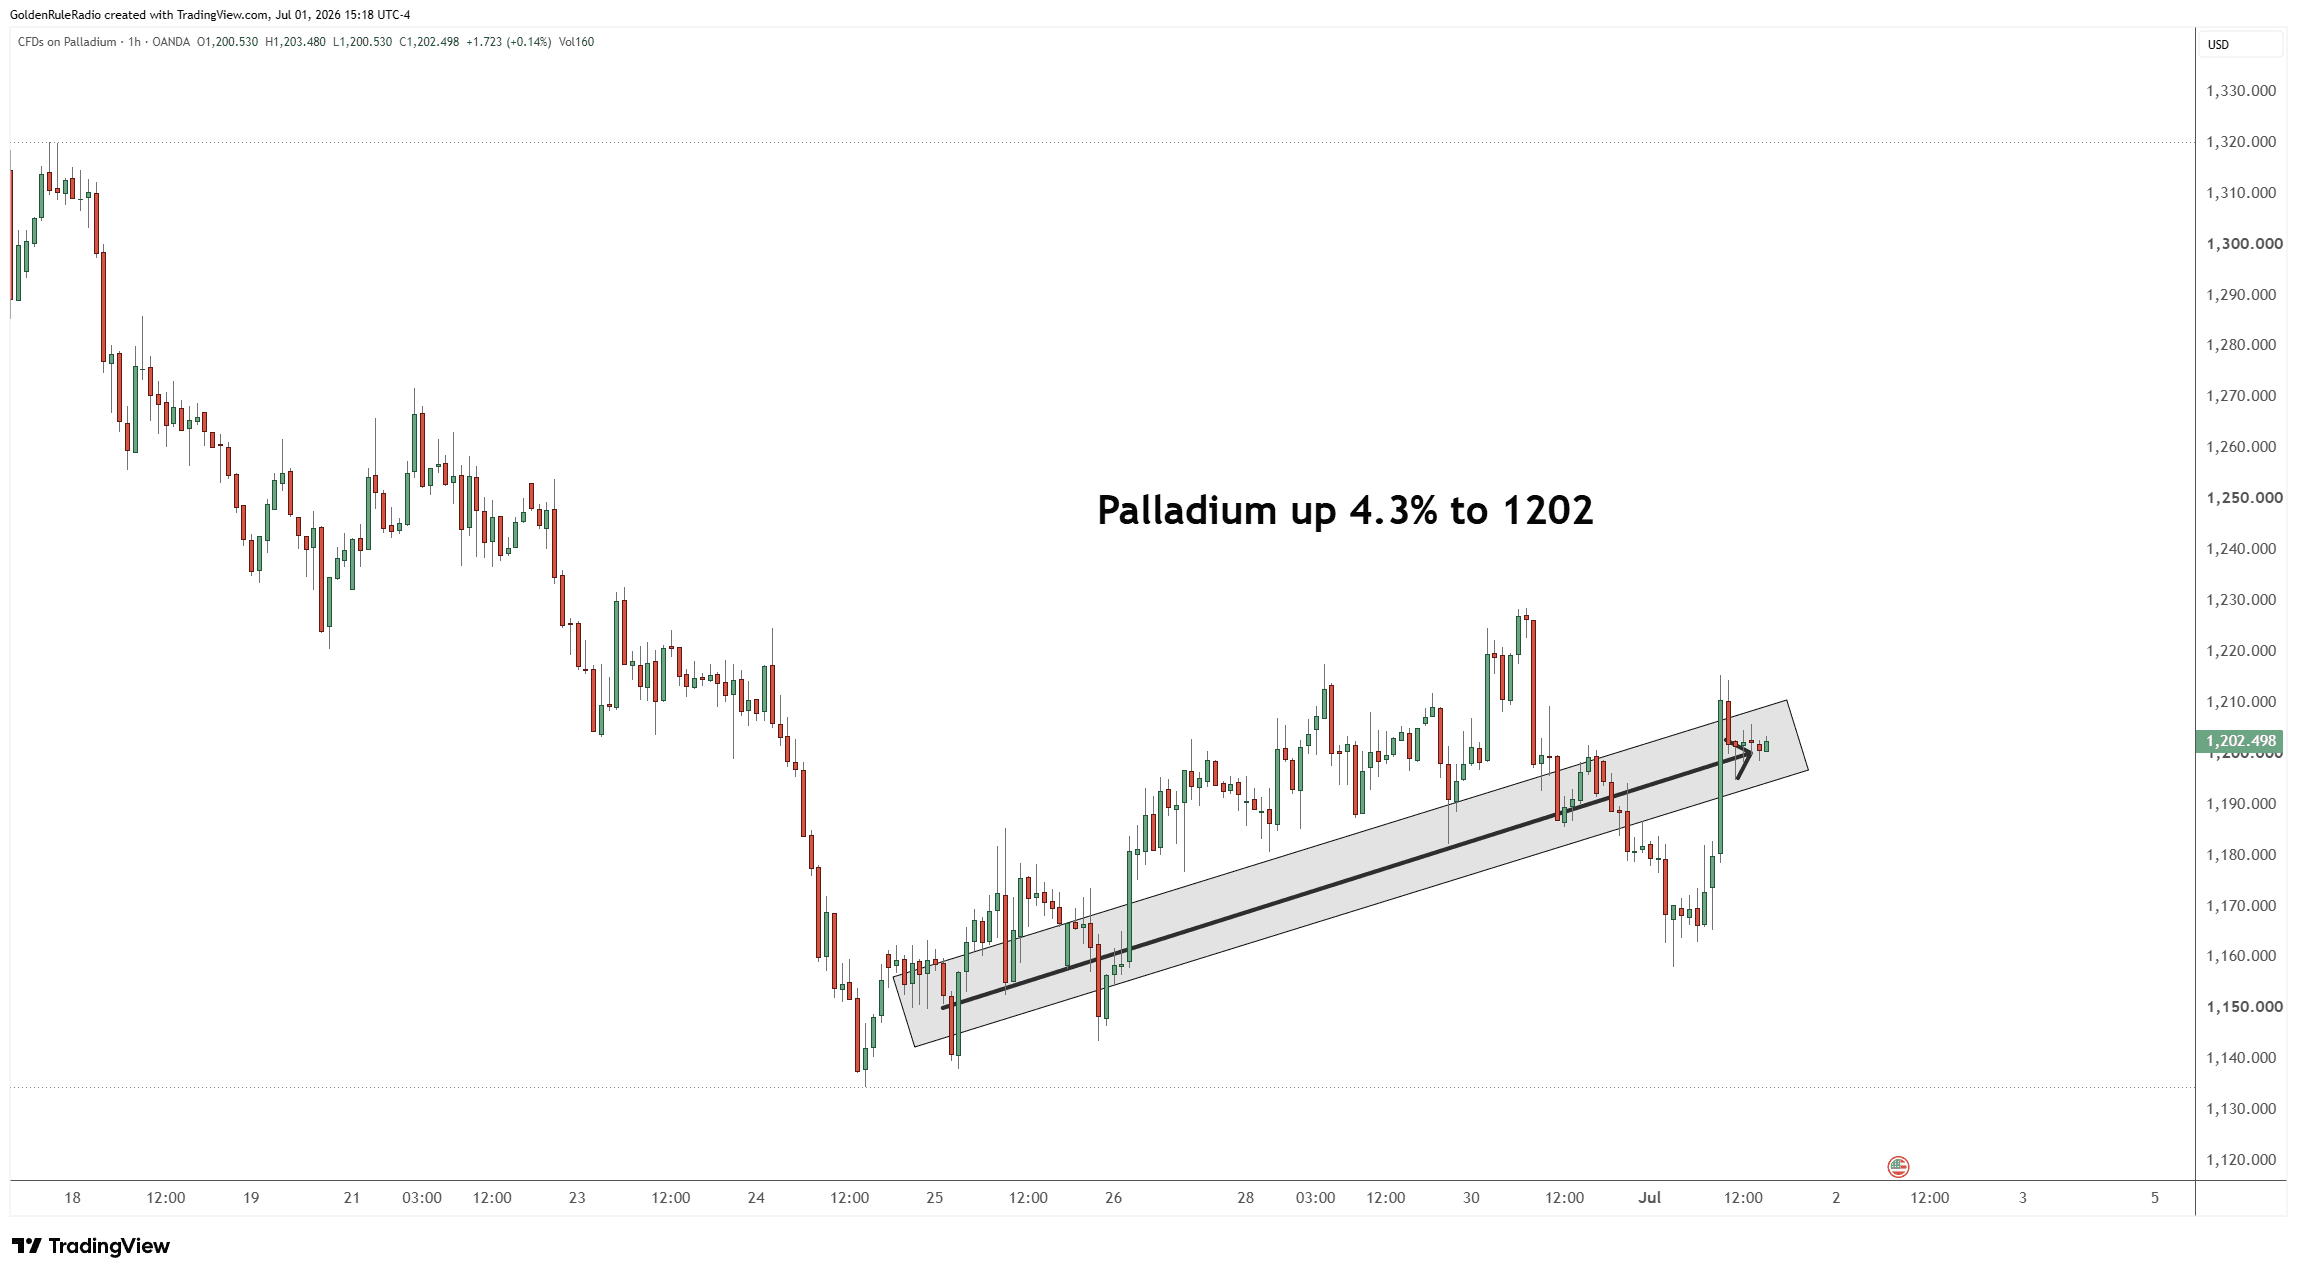
Palladium is up 4.5%, sitting at $1,200.
Looking over at the paper markets…
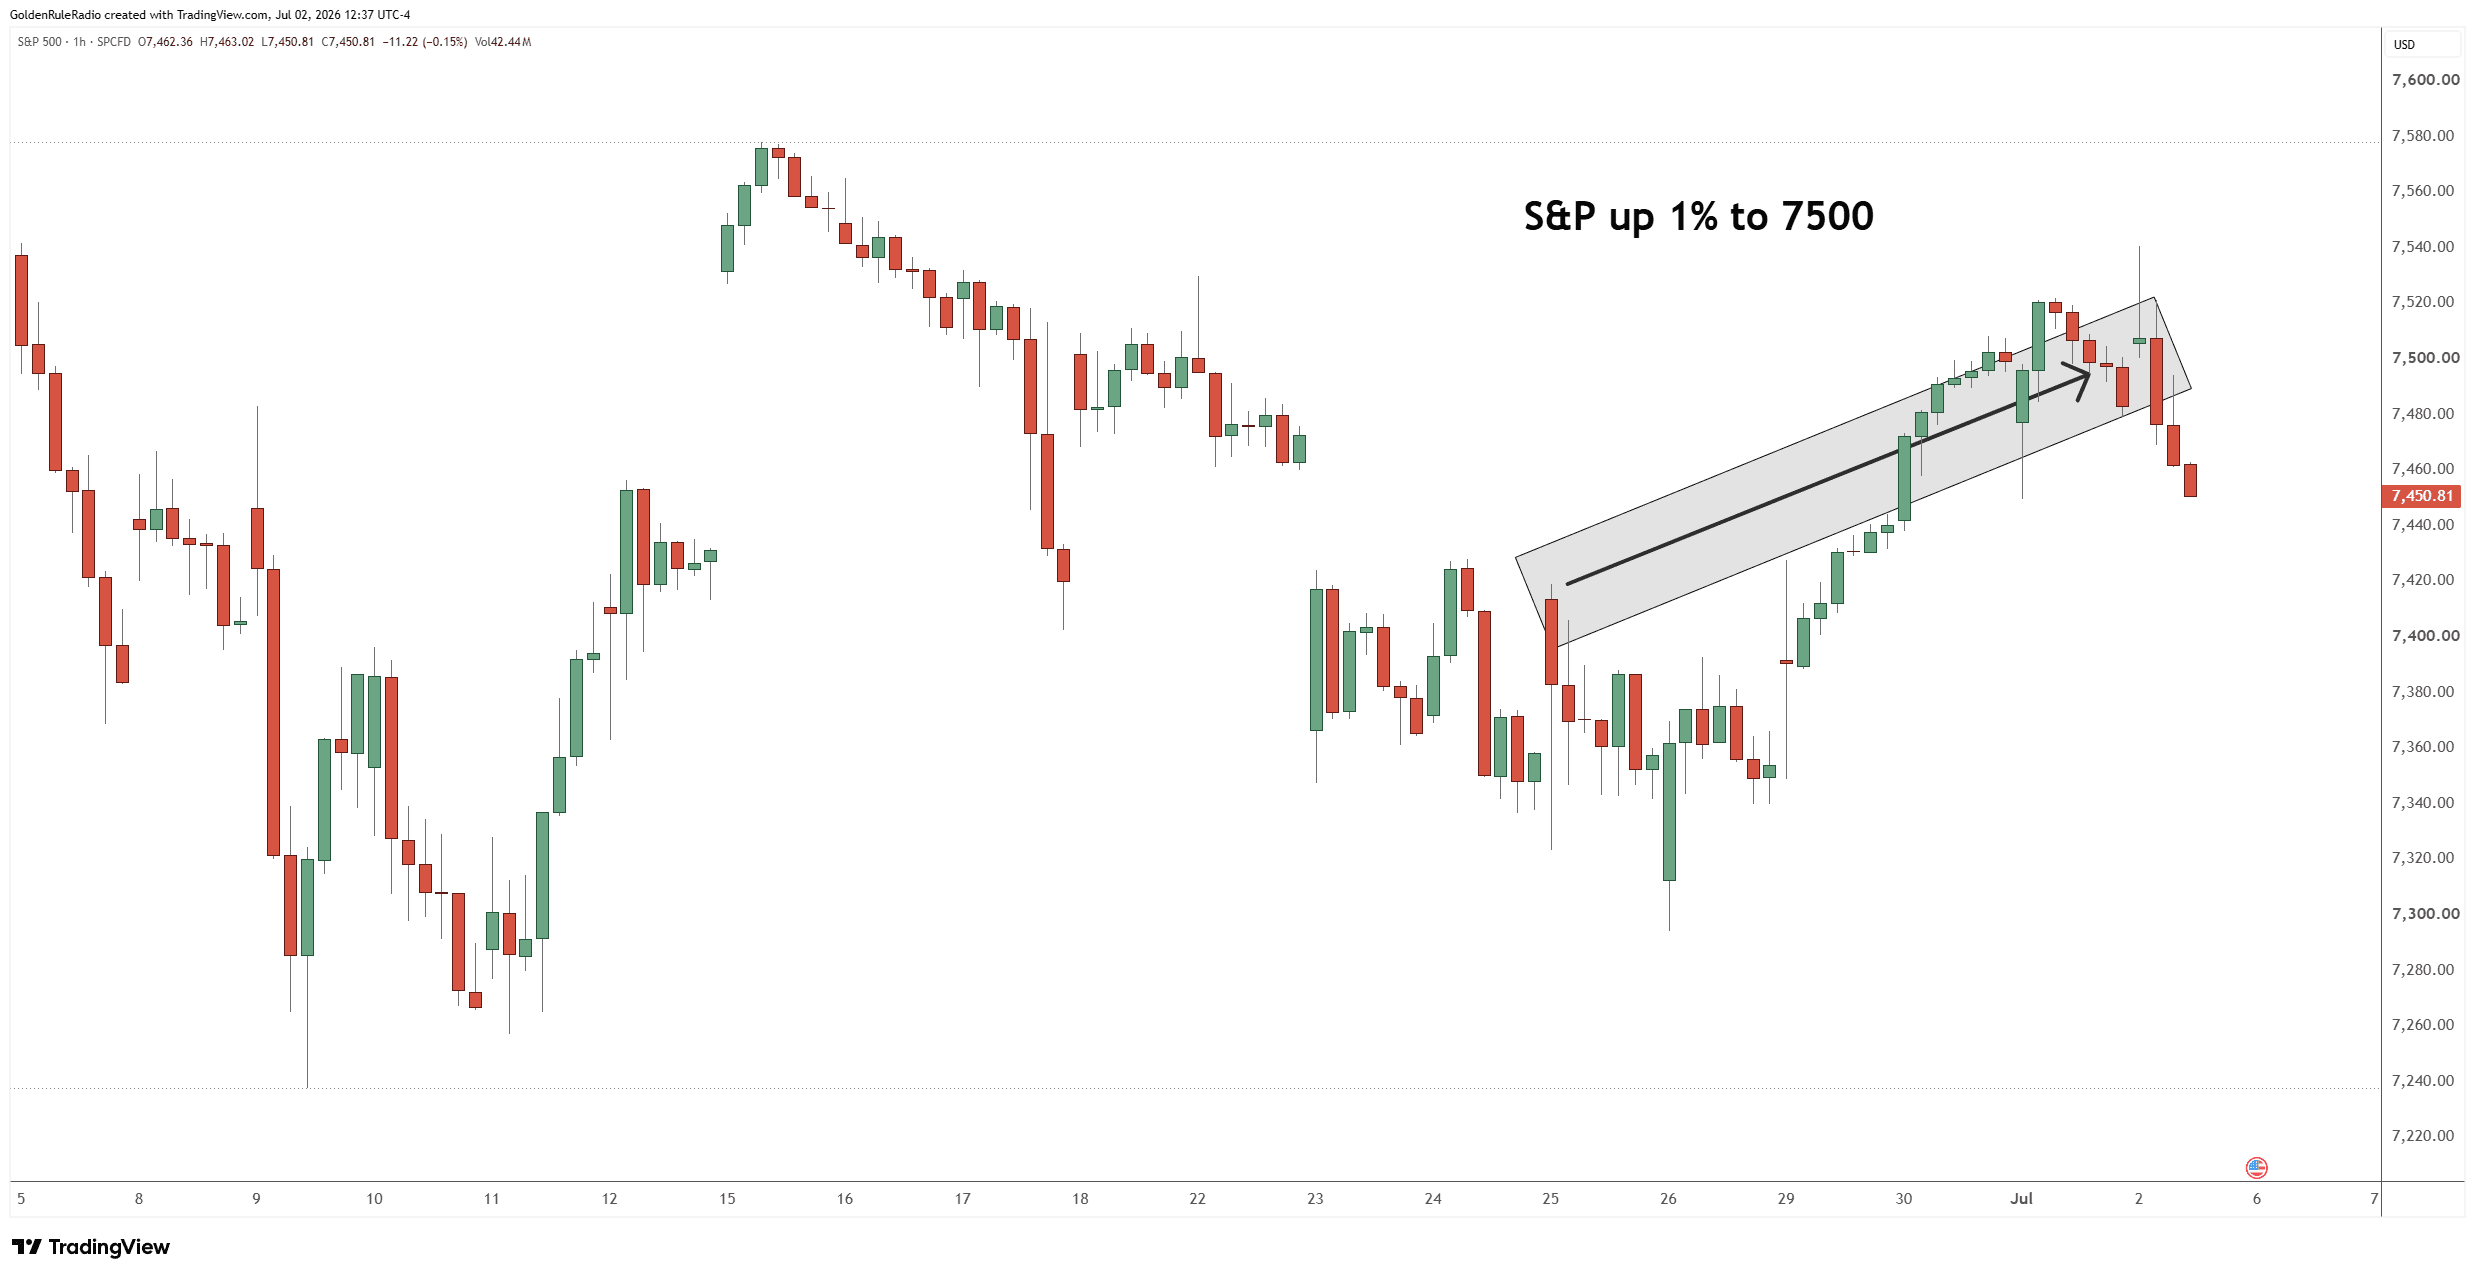
The S&P 500 is up about 1%, bouncing around 7,500. The Dow Industrials and Dow Transports are both up roughly 1% as well.
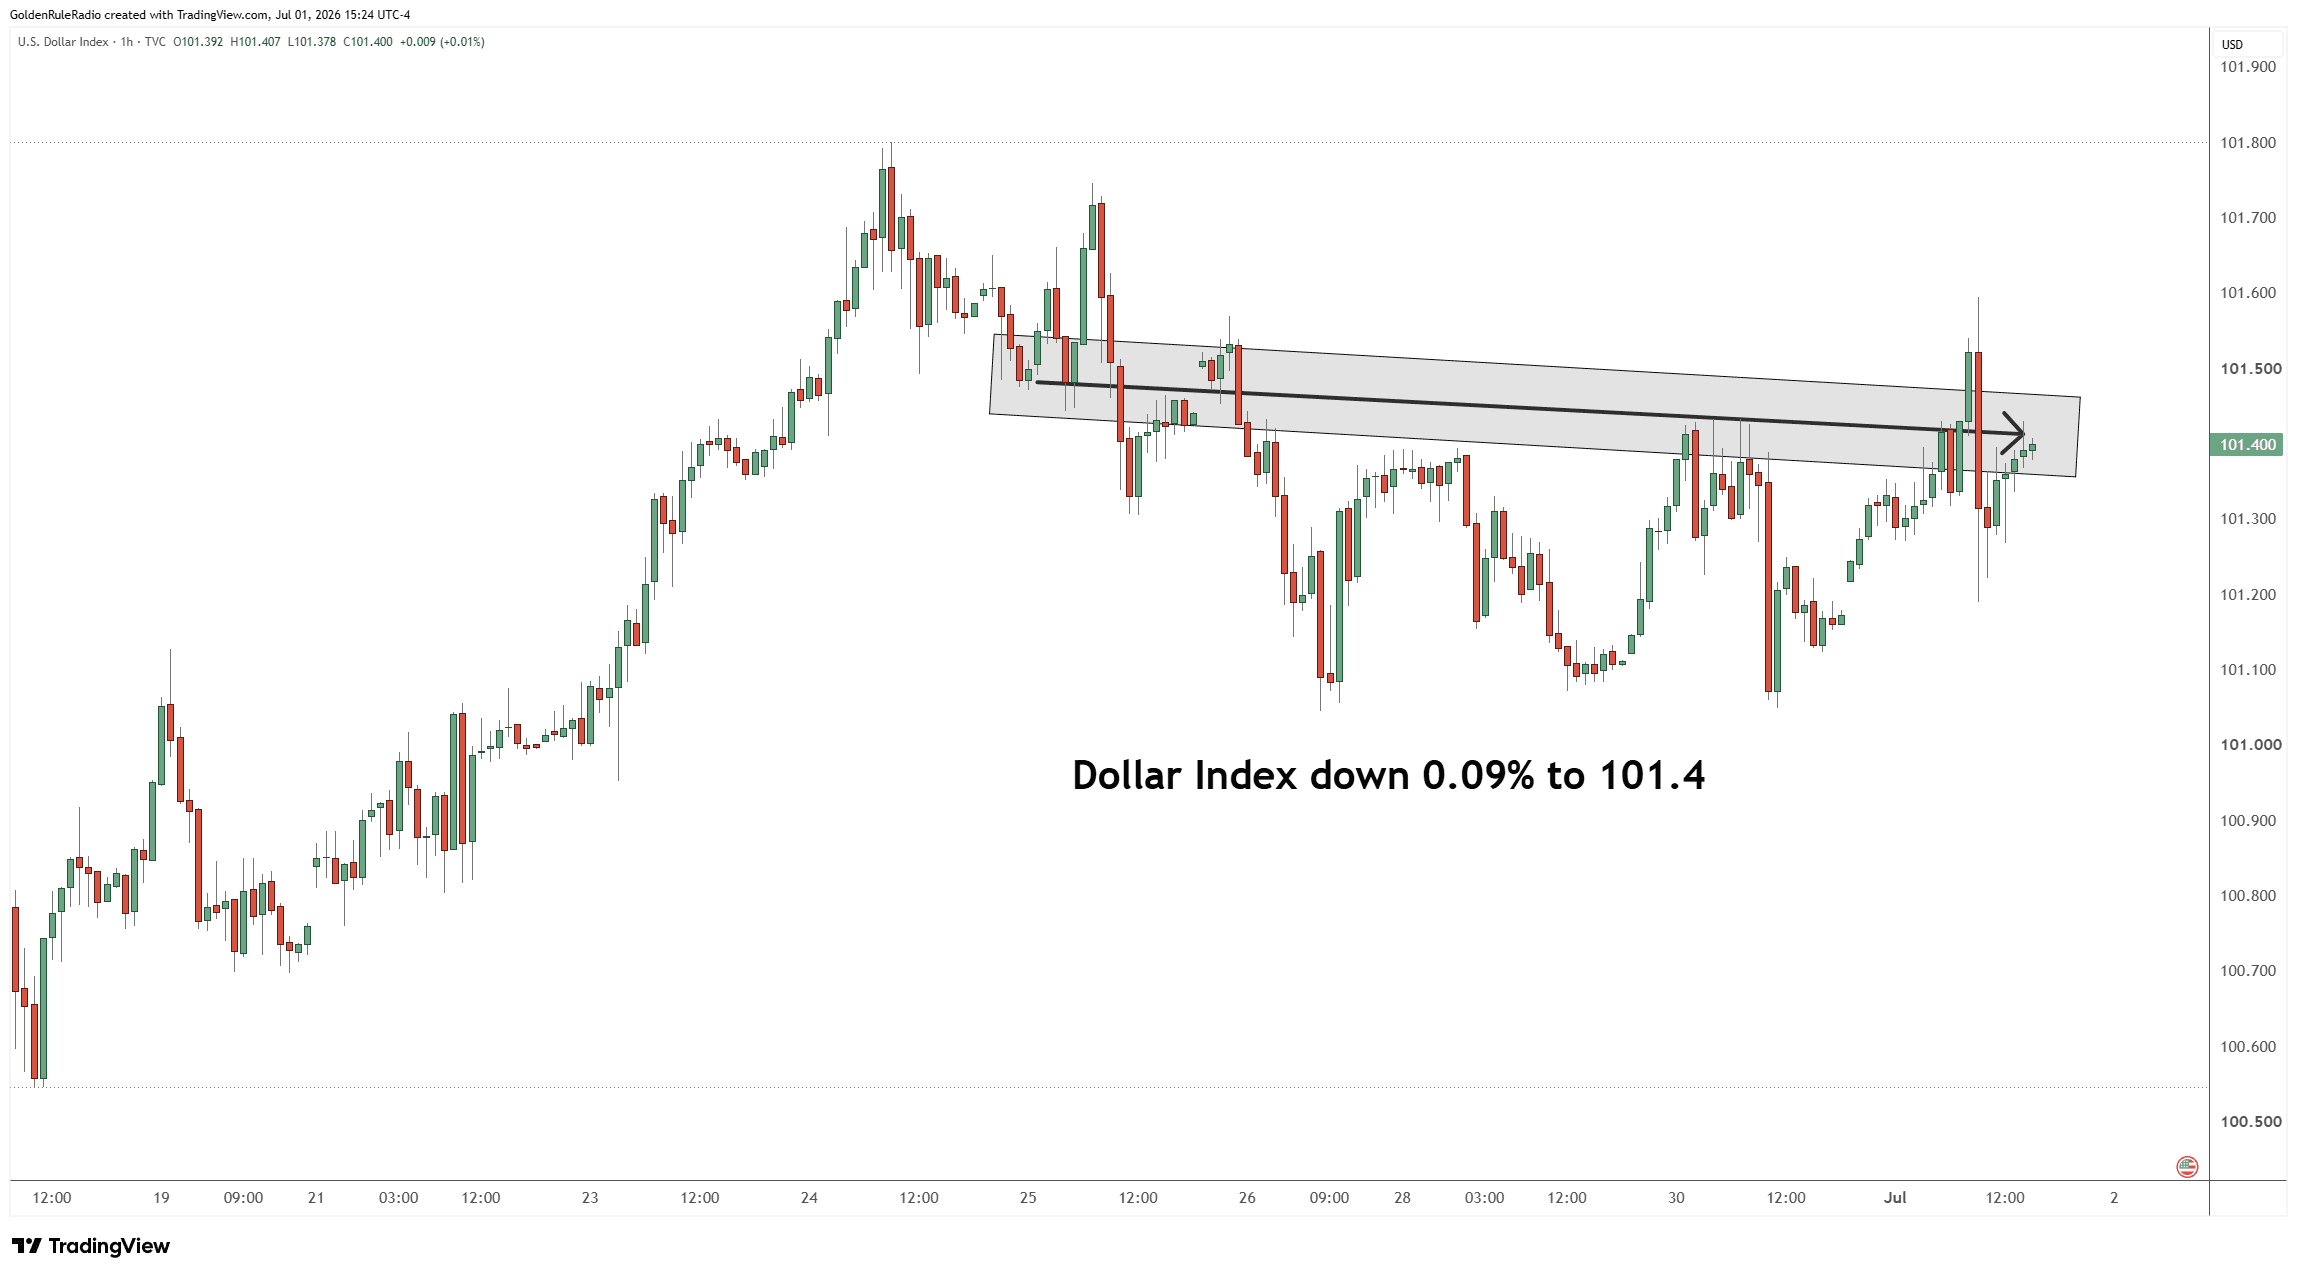
The US dollar index is down 0.1% from last week, sitting near 101.4.
The Worst Quarter in 13 Years — In Context
Let’s not sugarcoat it: Q2 was rough. Gold fell 13.6% for the quarter, the worst quarterly showing in 13 years. Silver and platinum each dropped about 20.5%, and palladium fell around 19%. Year-to-date, gold is down 6.5%, with silver off 16%, platinum down 23%, and palladium down 24%.
But zoom out to the trailing 12 months and the picture flips: gold is still up over 23.5%, silver has gained almost 67%, platinum is up about 17%, and palladium has climbed roughly 10%.
After a seven-month run where gold rose as much as 70% and silver spiked over 240% into the January highs, a sharp retracement isn’t a red flag — it’s simply what happens after an extension into the absurd. Coming back to what would still be considered an outstanding annual return for precious metals isn’t the end of a bull market; it’s digestion.
The Charts Are Lining Up
Gold just touched its 65-week moving average for the first time in a long while, sitting right around $4,000. At the same time, the 50-day and 200-day moving averages are crossing almost exactly where a 38.2% Fibonacci retracement lands — all converging in the same neighborhood, near $4,400.
When several independent technical indicators cluster in the same zone, it’s worth paying attention. The relative strength index is also showing bullish divergence: price has kept printing lower lows, but the indicator itself has been trending higher, which typically signals fading downside momentum. Taken together, this points to a plausible trading range forming between roughly $4,000 and $4,400, with a real chance gold works its way back toward the top of that range before deciding its next major move.
Four Reasons Behind the Pullback
None of the drivers behind this correction represent a change in the long-term fundamental case for metals:
- Seasonality. June is historically the weakest month of the year for gold and silver going back 50 years. July, on the other hand, tends to be a strong month.
- Forced liquidations. Margin calls and liquidity needs — some tied to stress in the bond market — have pushed selling in the futures and ETF markets, independent of underlying physical demand.
- The Iran conflict. War headlines drove a stronger dollar, rising Treasury yields, and an energy-driven inflation spike that pushed the Fed toward talk of rate hikes instead of cuts — all short-term headwinds for gold.
- Overshoot correction. January’s melt-up was, by any measure, euphoric and unsustainable. This pullback is largely just unwinding that excess.
The Fundamentals Haven’t Moved
While price action has cooled, the structural case for gold keeps getting stronger. China has now added to its gold reserves for 19 straight months, and the world as a whole holds more gold than US Treasurys as a reserve asset for the first time in decades. M2 money supply hit a fresh all-time record of $23.1 trillion in May, up nearly $700 billion year-to-date through May alone — and that’s before June’s numbers are even in. Meanwhile, national debt is closing in on $40 trillion with no sign of reversing course. These are the same forces that have driven the multi-year bull market, and none of them have gone away.
What To Do Now
The best entry points in gold have historically come when almost nobody wants to buy — which is exactly the emotional trap most investors fall into. Central banks and institutions tend to accumulate at the bottoms, while individual investors typically pile in closer to the next leg up. If you’re in an accumulation phase, dips like this one are the moments that matter most, not the euphoric spikes.
Our recommendation remains the same as it’s been throughout this cycle: use stair-step buying at technical support levels, stay unemotional about short-term price swings, and remember that a cyclical pullback inside a secular bull market is a feature, not a warning sign.
Here to Help
The team at McAlvany Precious Metals has a collective 75 years experience investing in the precious metals market. We are happy to speak with you about your goals on a no-obligation, complimentary consultation. Reach out to us at 800-525-9556.