Podcast: Play in new window
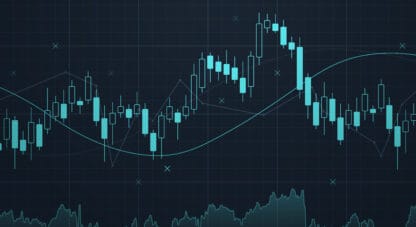
Gold and silver snapped back this week with conviction, with gold climbing 3.5% and silver surging over 8%. Platinum led the metals with a 9.25% gain, reclaiming the key $2,000 level. The reversal comes amid fresh macro pressure on the dollar and growing signals that the physical metals market is quietly reasserting itself over the paper trade.
Let’s take a look at where precious metals prices stand as of Wednesday, May 6:
The price of gold is up 3.5%, currently sitting at $4,700.
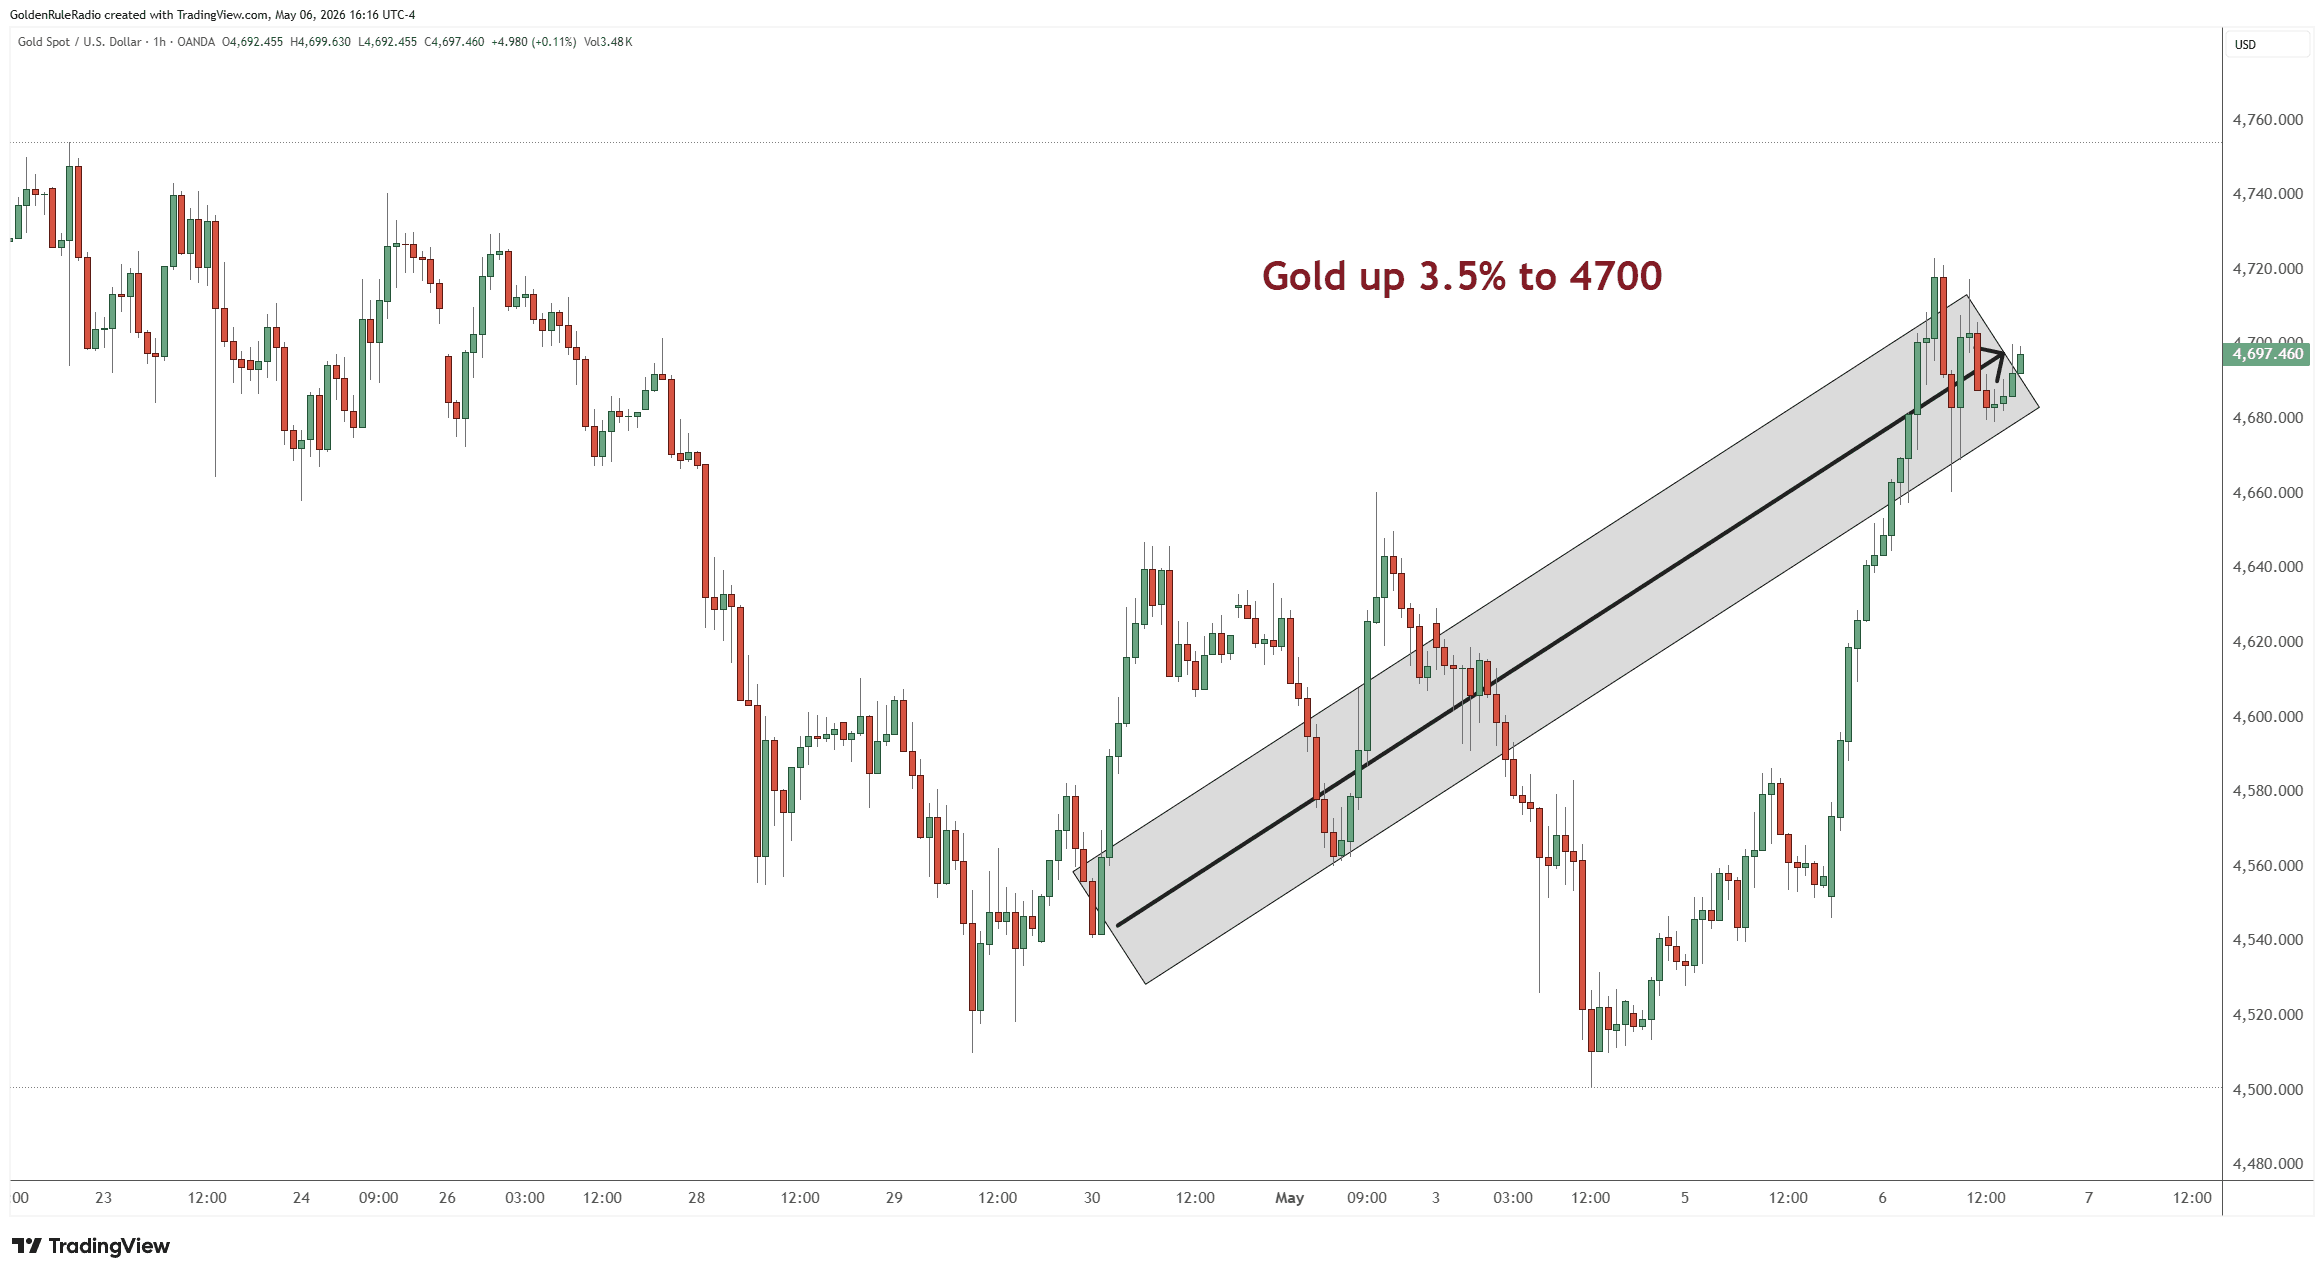
The price of silver is up 8.3%, sitting at $77.55.
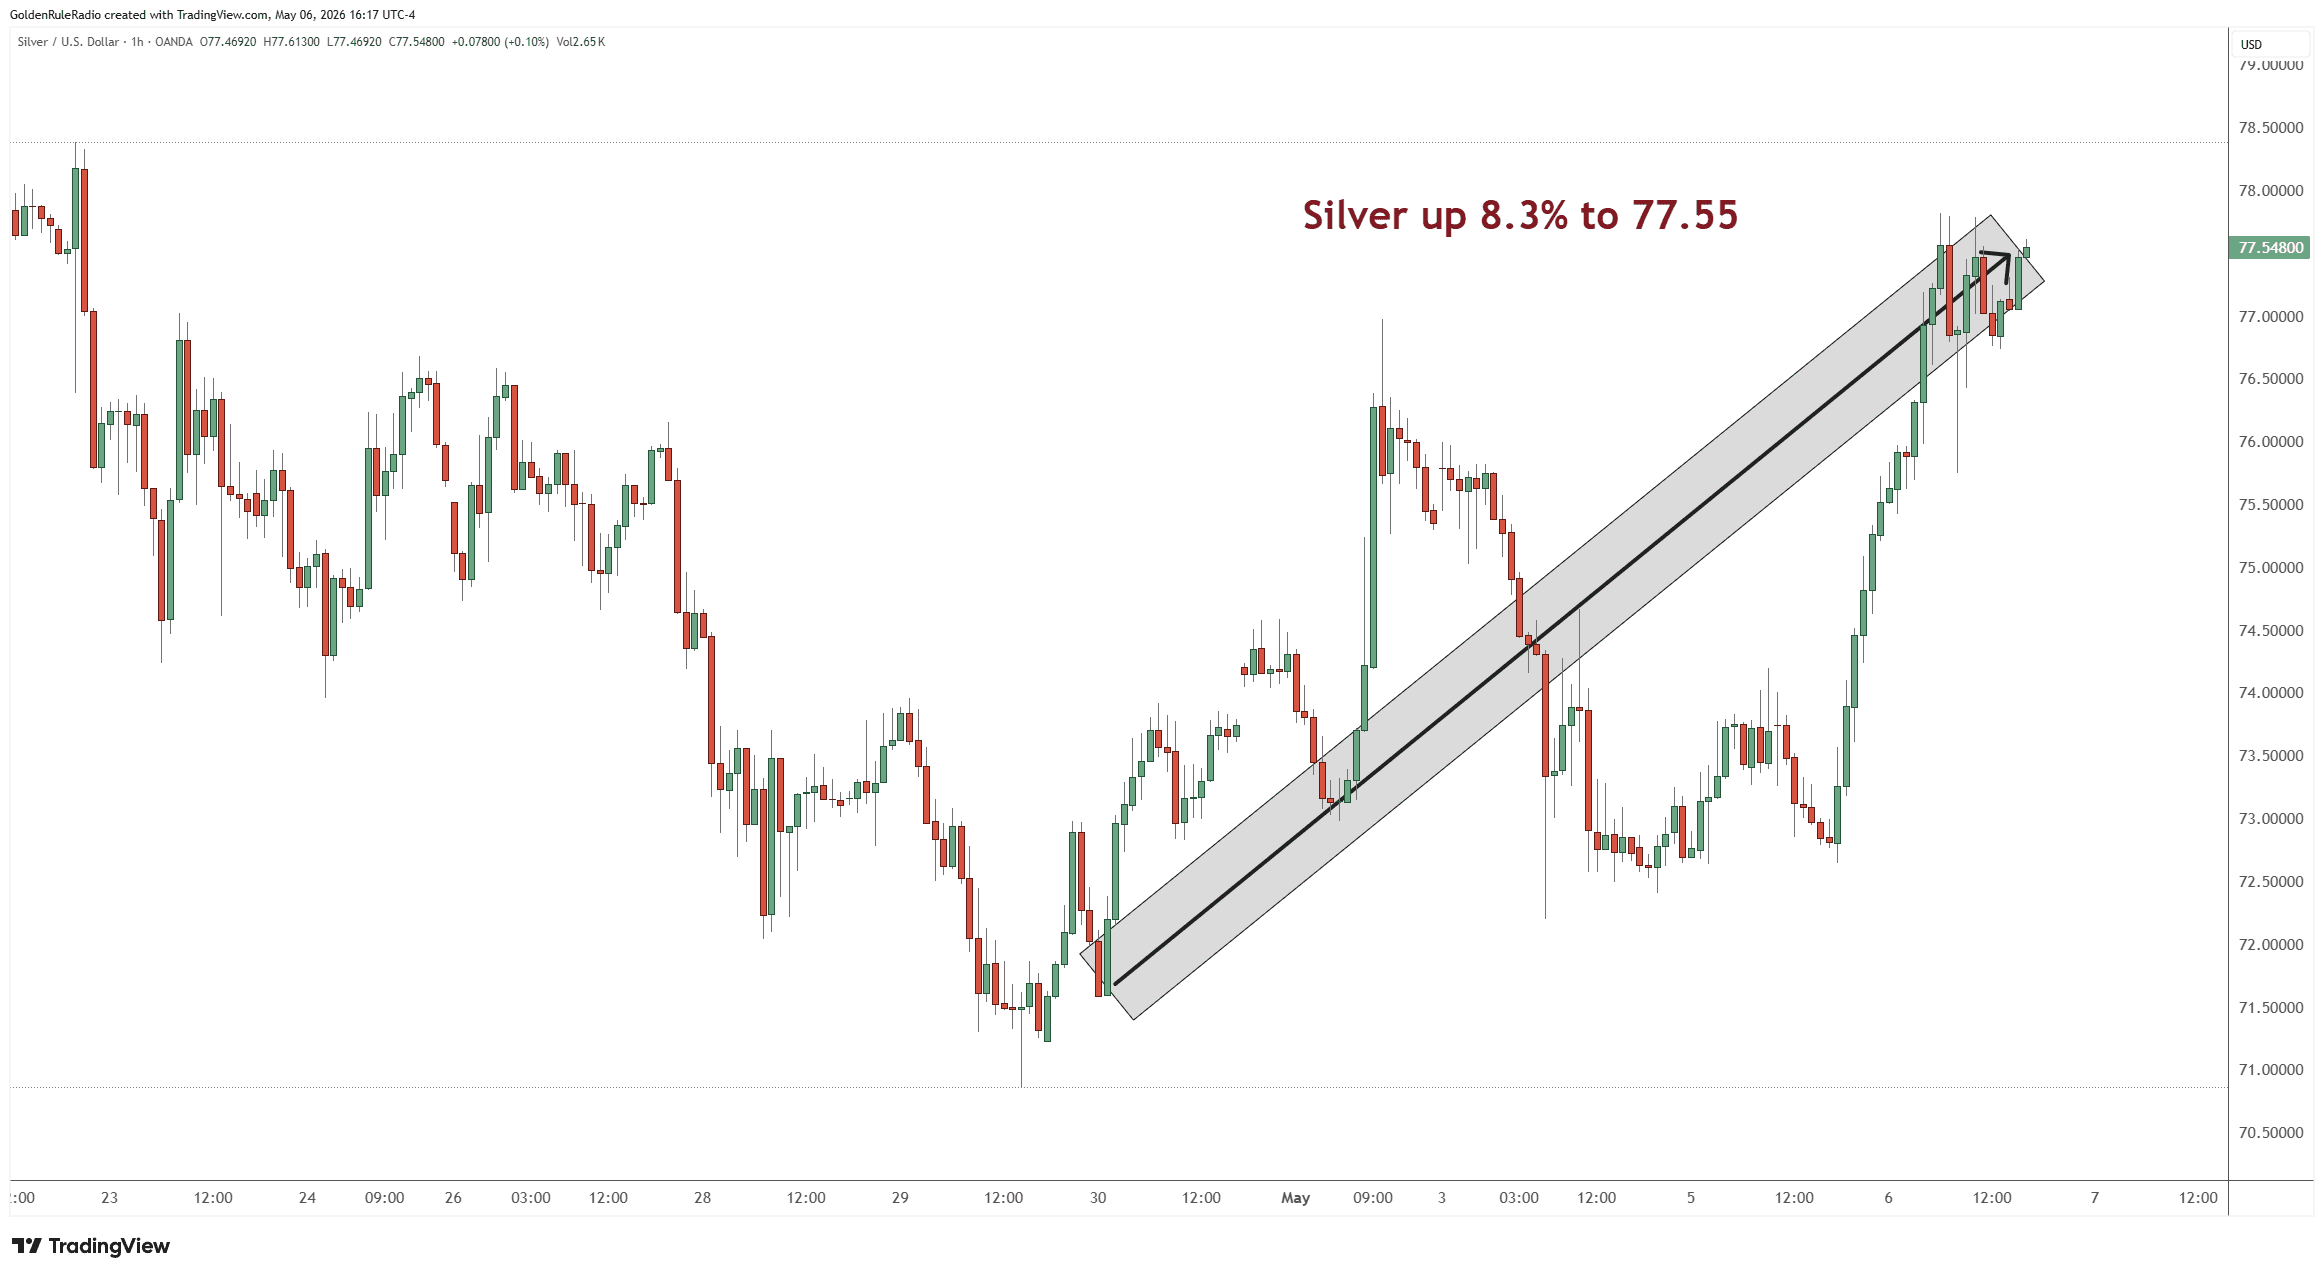
Platinum is up 9.25%, back above $2,000 at $2,055 — a level that has repeatedly served as a line in the sand.
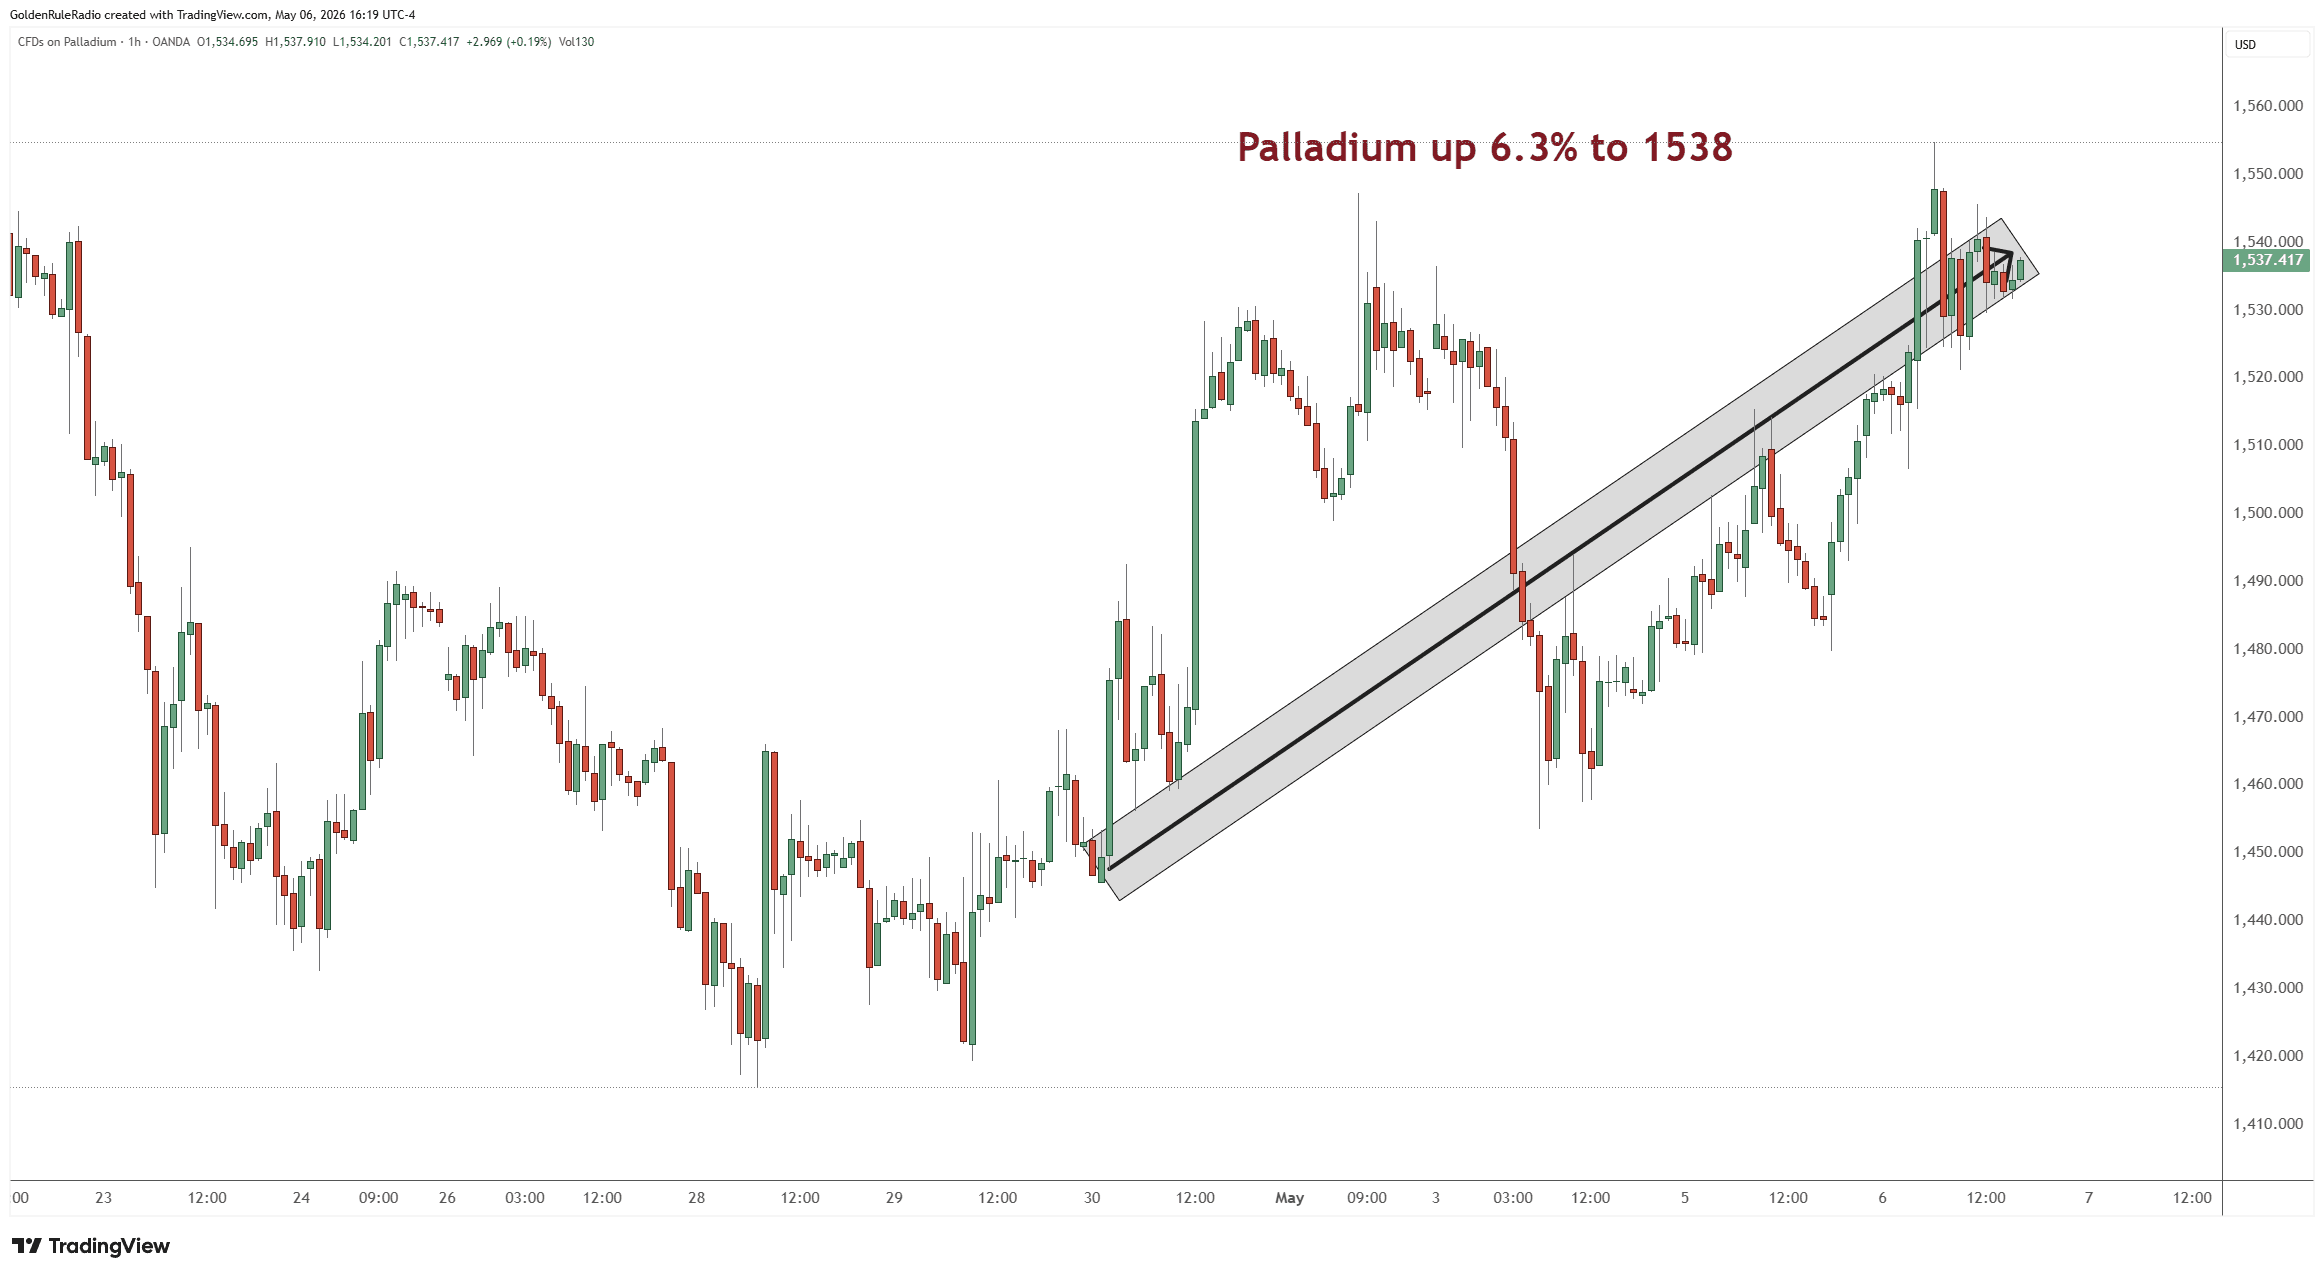
Palladium is up 6.3%, sitting at $1,538..
Looking over at the paper markets…
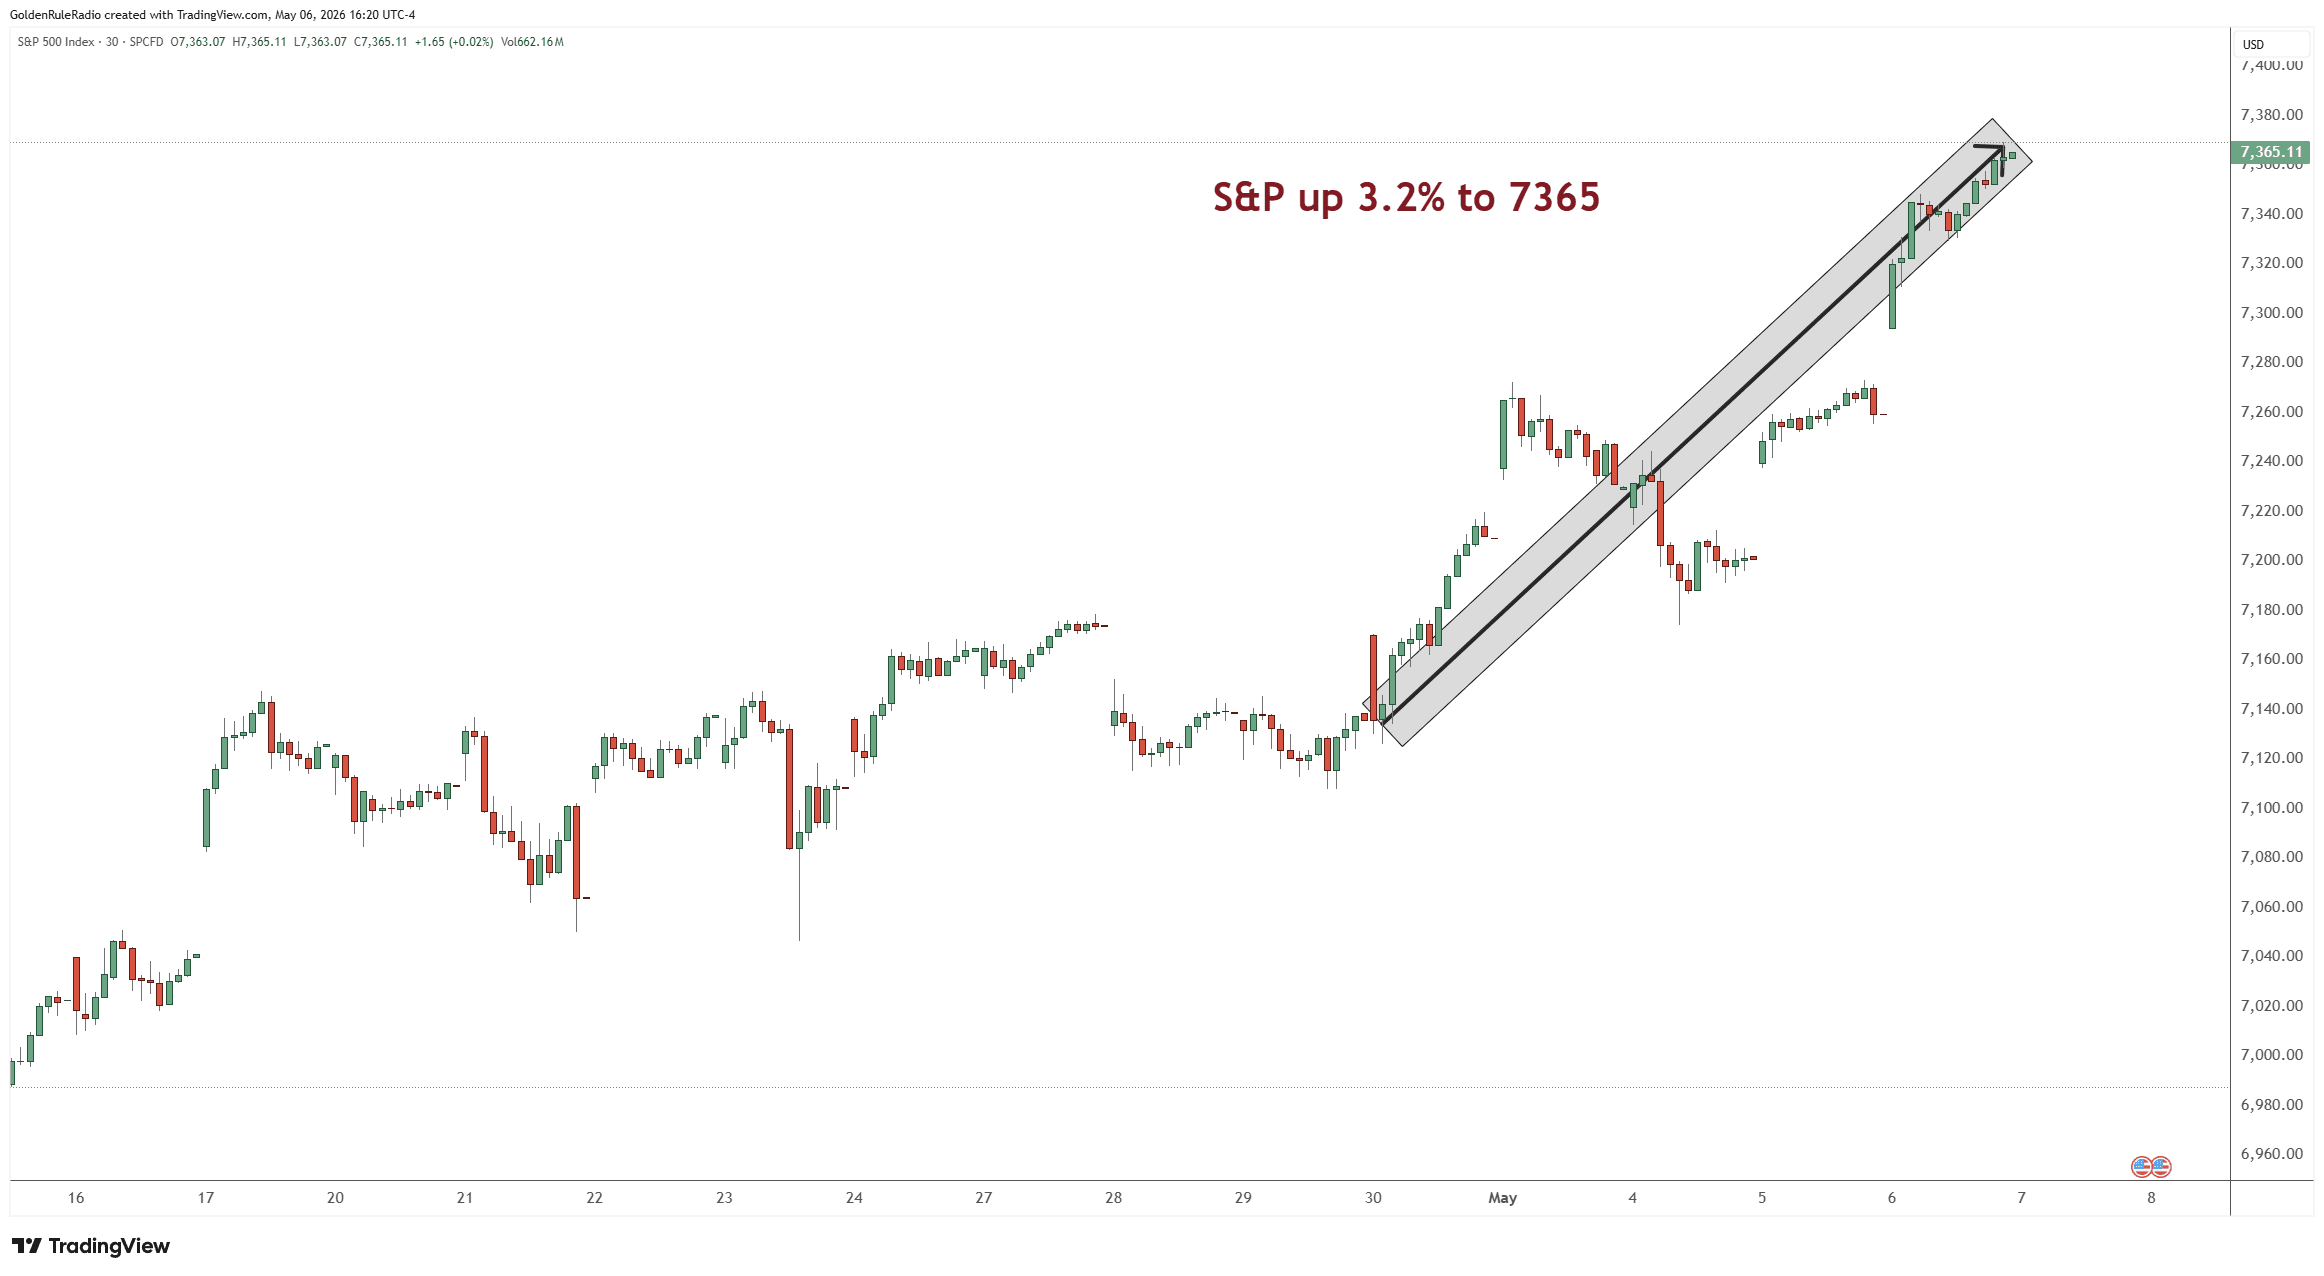
The S&P 500 is up over 3% this week, sitting at 7,365.
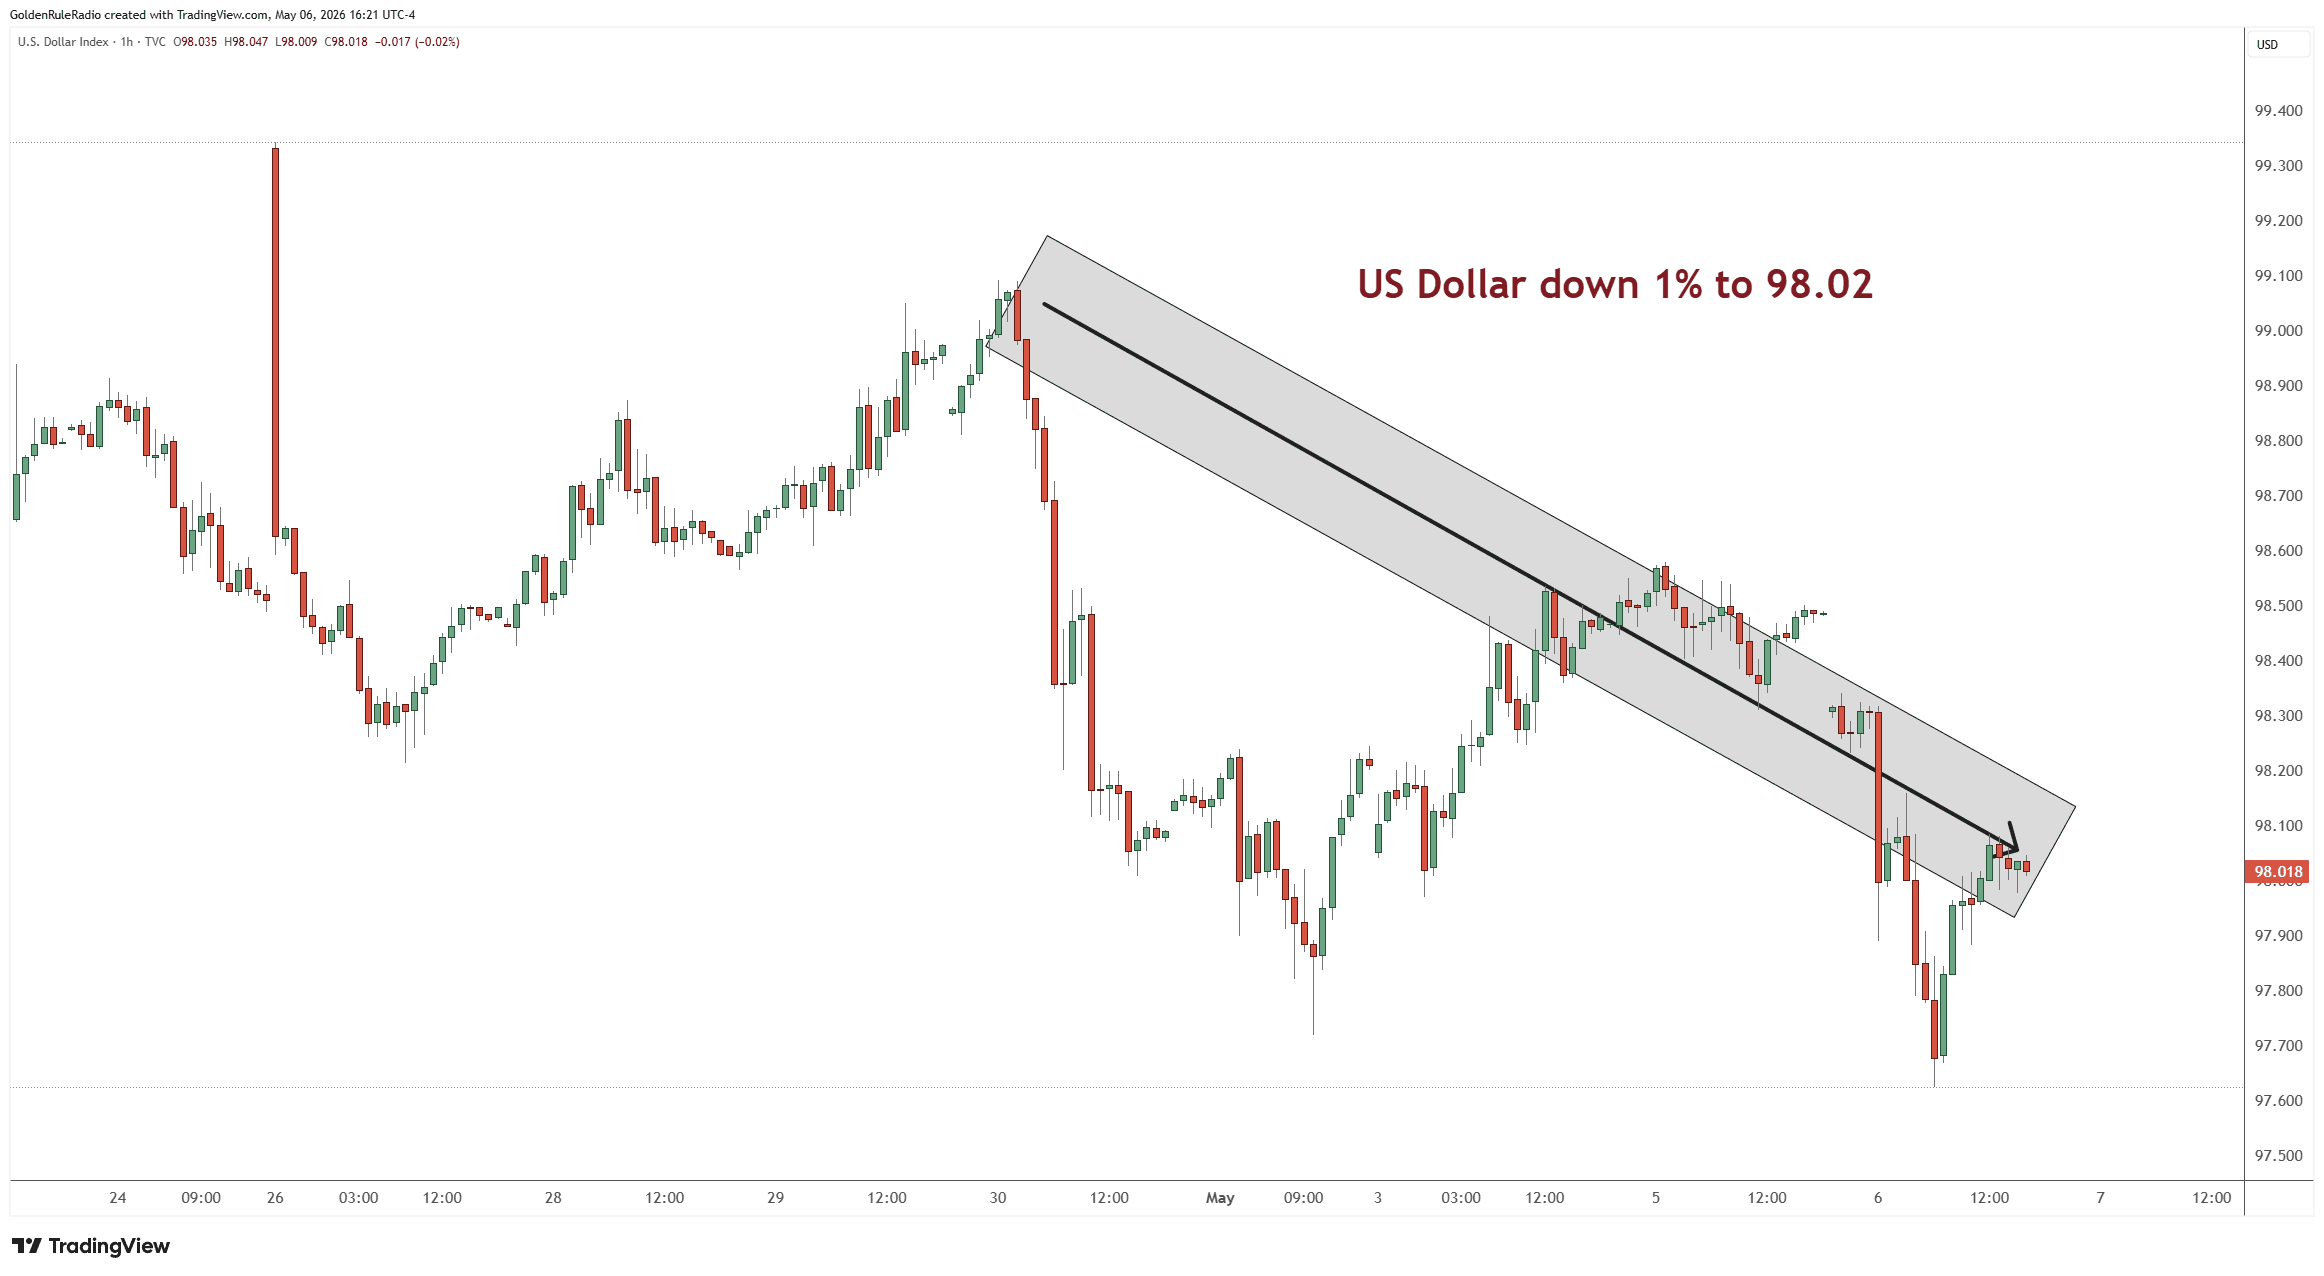
The US Dollar Index is down 1%, sitting just above 98.
U.S. Debt Crosses a Historic Threshold
The publicly held portion of U.S. national debt — the money borrowed from foreign governments, the Social Security Trust Fund, and the public — has now surpassed 100% of GDP. That’s the first time it has crossed that threshold since World War II.
This is not an abstract statistic. It means the U.S. government owes more to the outside world than the entire economy produces in a year, and interest payments will continue to rise as that debt rolls over at higher rates. The pressure this places on the dollar is real and structural. When the dollar weakens under that weight, gold tends to respond — not as a trade, but as a revaluation of what that currency is actually worth.
We’ve seen that dynamic play out repeatedly over the past 18 months. It’s one of the clearest long-term tailwinds for physical metals, and it isn’t going away.
Gold at a Technical Decision Point
After the explosive moves earlier this year followed by the correction and consolidation period of late February through April, gold is now at a pivotal moment on the charts.
Currently, gold is tracing what looks like a parallel declining channel — a pattern of lower highs and lower lows since the January all-time high near $5,600. To signal that this consolidation phase is over, gold needs to do three things in sequence: break above the declining trend line, push past the failed recovery high from late February around $5,400, and then take out the January high itself.
The first step is breaking above approximately $4,800–$4,900. We’re not far from that level now. Days when gold moves $150 in a single session are worth watching, but one day does not make a trend. The key is whether buyers continue to show up and push prices through those resistance levels with consistency. Until that momentum builds, the market remains in a defined consolidation range.
The Physical Market Is Taking Over in Silver
One of the most important structural shifts happening beneath the surface is in silver’s open interest — the number of outstanding futures contracts at the COMEX.
Open interest in silver has been falling. That sounds bearish on the surface, but the context matters enormously: silver isn’t declining because investors are walking away. It’s declining because buyers are taking physical delivery instead of rolling paper contracts. The metal is moving out of Western vaults and heading east, with China importing a record 800+ tons of silver in March alone. That’s nearly double any single month in the prior decade.
Margin hikes that once reliably crushed silver futures have had diminishing effect. The buyers stepping in aren’t leveraged speculators looking for a quick trade — they’re utilities, manufacturers, governments, and long-term allocators who want the metal itself.
For investors holding physical silver, that’s an important distinction. You’re increasingly on the same side of the trade as the buyers who are least likely to panic.
Silver: Real Value, Murky Chart
Silver’s fundamentals are genuinely compelling. Physical demand is strong, inventories are migrating east, and low premiums on circulated junk silver and Morgan dollars are creating some of the best ounce-for-dollar value we’ve seen in years — including products trading at or even below spot melt value.
That said, the chart is anything but clear. Silver is currently carving out an enormous trading range, with meaningful price levels stacked from roughly $48 all the way up through $96 and beyond. Within that range, there are multiple interim levels where the next significant move — up or down — could begin. Silver could break out toward $110 or consolidate back toward $60, and the chart right now gives nearly equal weight to both scenarios.
The honest answer is that silver is at a fork in the road, and claiming certainty about the near-term direction would be overstepping what the data actually shows. What we do know: the long-term fundamentals favor higher prices, physical demand is real, and current premium levels on older circulated silver represent genuine value for patient buyers.
If you’re holding silver, the strategy remains the same — stay consistent, focus on ounces rather than dollar prices, and look for ratio and premium swap opportunities as they arise.
What to Do Right Now
The market is in a consolidation phase, which historically means opportunity rather than danger for long-term precious metals investors. Gold is basing before what could be a significant move higher, silver is offering some of the best product value in years at current premium levels, and the macro backdrop hasn’t changed.
The investors who have done best in this cycle are those who built positions steadily, traded ratios and premiums rather than chasing headlines, and didn’t let short-term volatility shake them out of long-term conviction. If anything, sideways markets are where the best foundation-building happens — before the next leg higher makes entry look expensive in hindsight.
Here to Help
The team at McAlvany Precious Metals has a collective 75 years of experience investing in the precious metals market. We’re happy to discuss your personal situation and develop a strategy based on your goals — with no obligation. Reach out to us at 800-525-9556.