Podcast: Play in new window
Precious metals had a quiet week with gold and silver slipping 1.8% and 1.5% respectively. Beneath the calm price action, discussion around inflation, oil prices, and Fed effectiveness highlighted the importance of finding opportunities to rotate between metals.
Let’s take a look at where prices stand as of Wednesday, May 27:
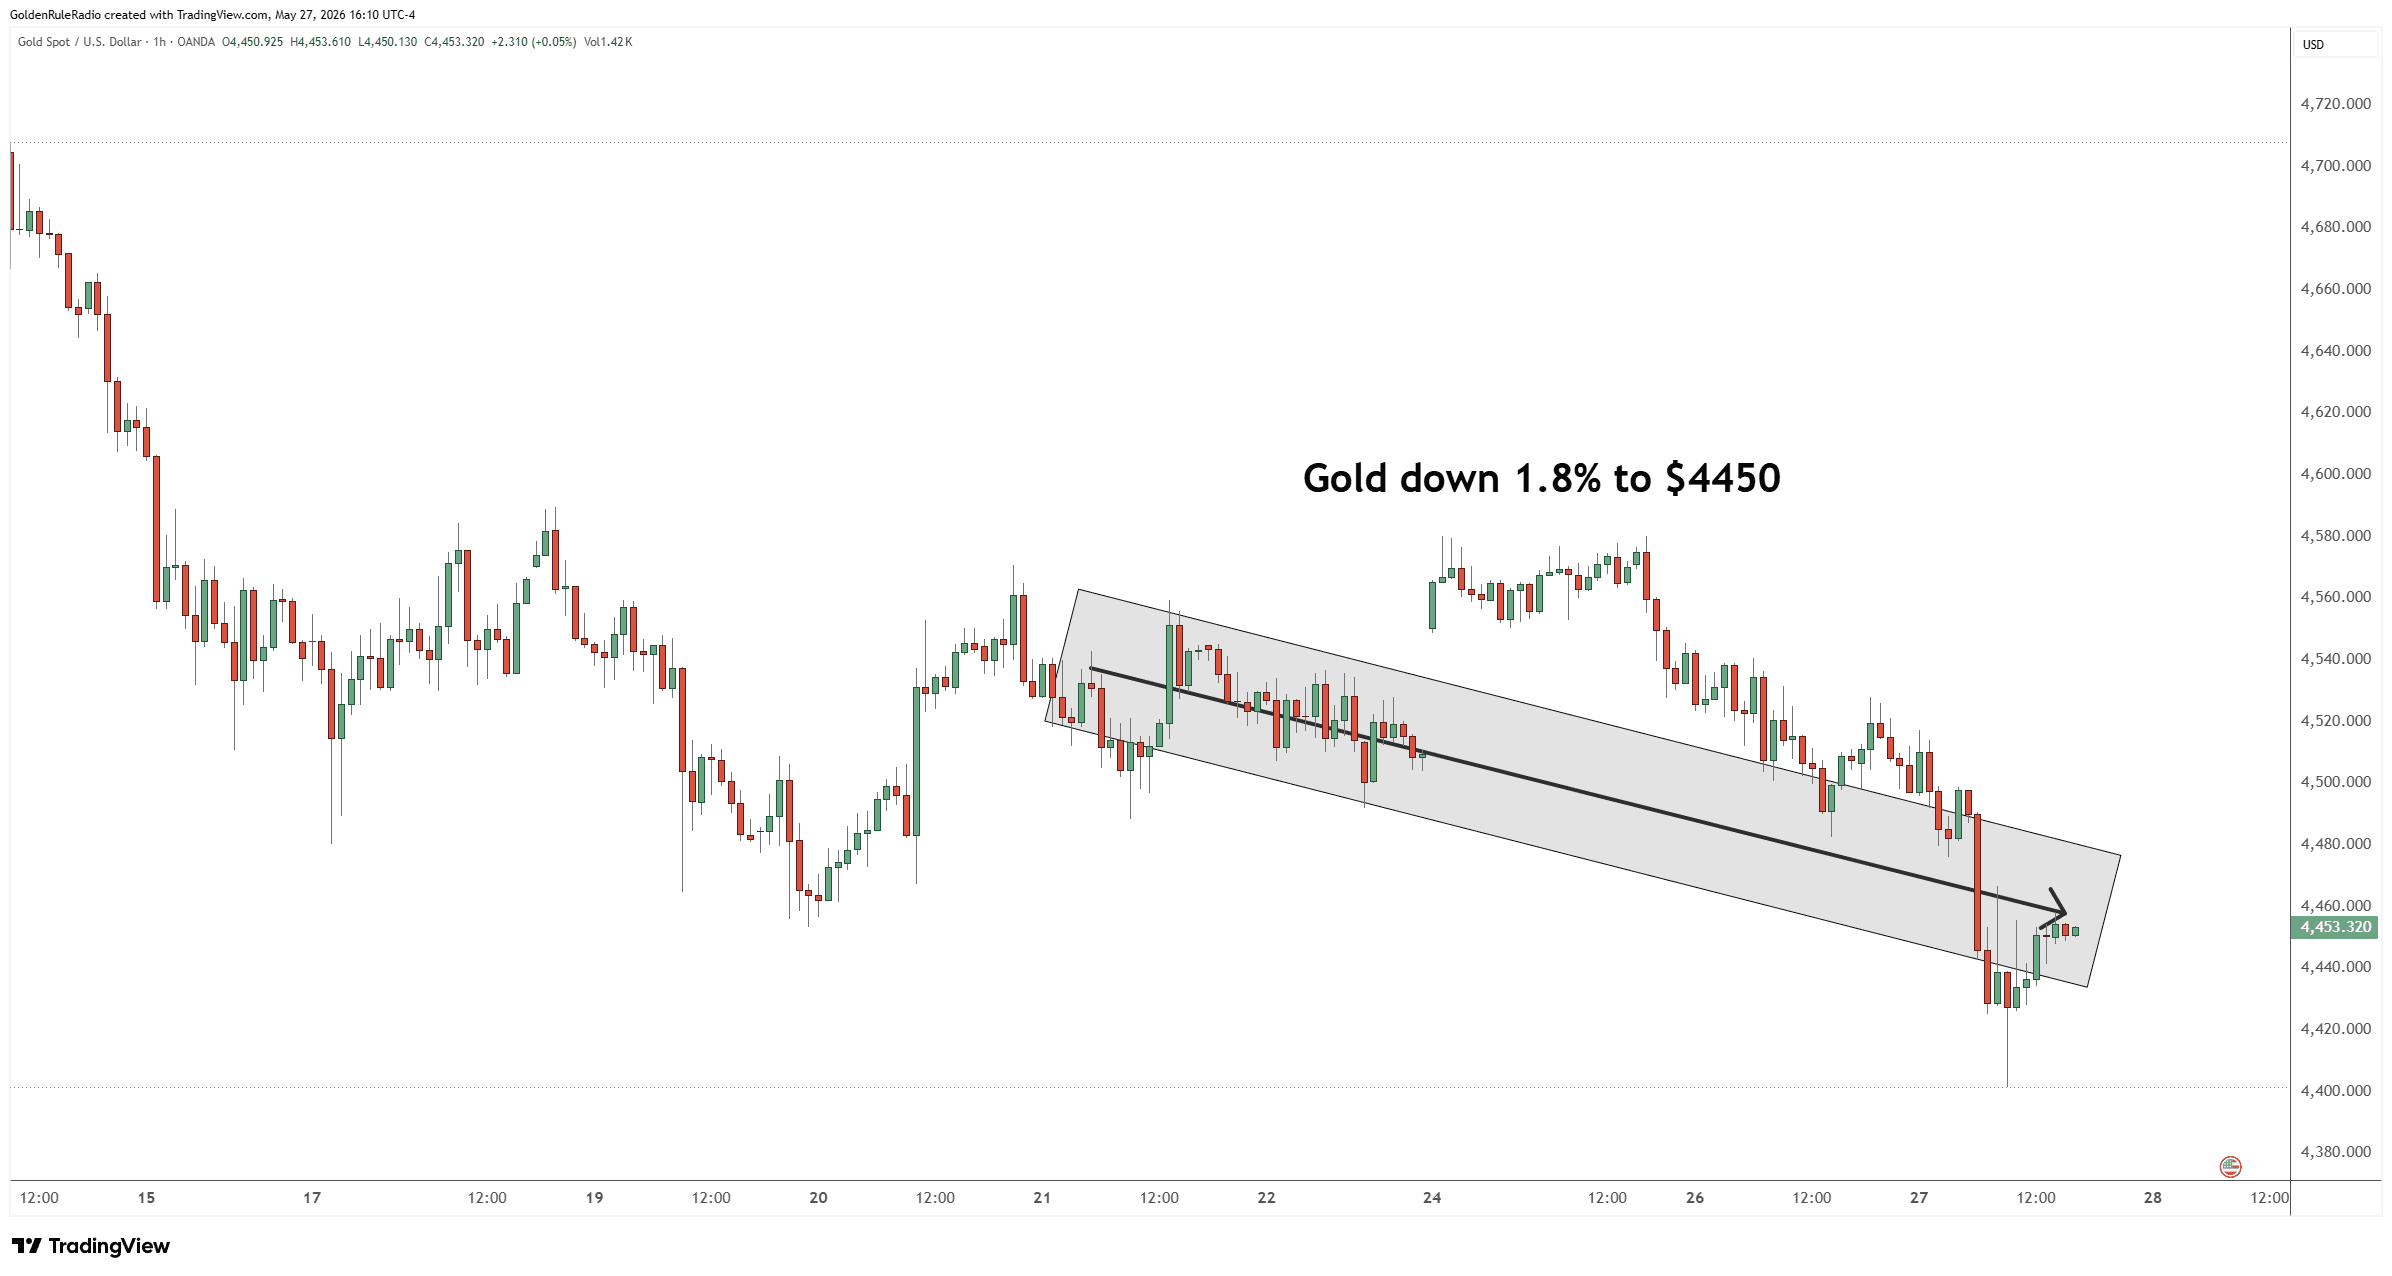
The price of gold is down about 1.8% to $4,450.
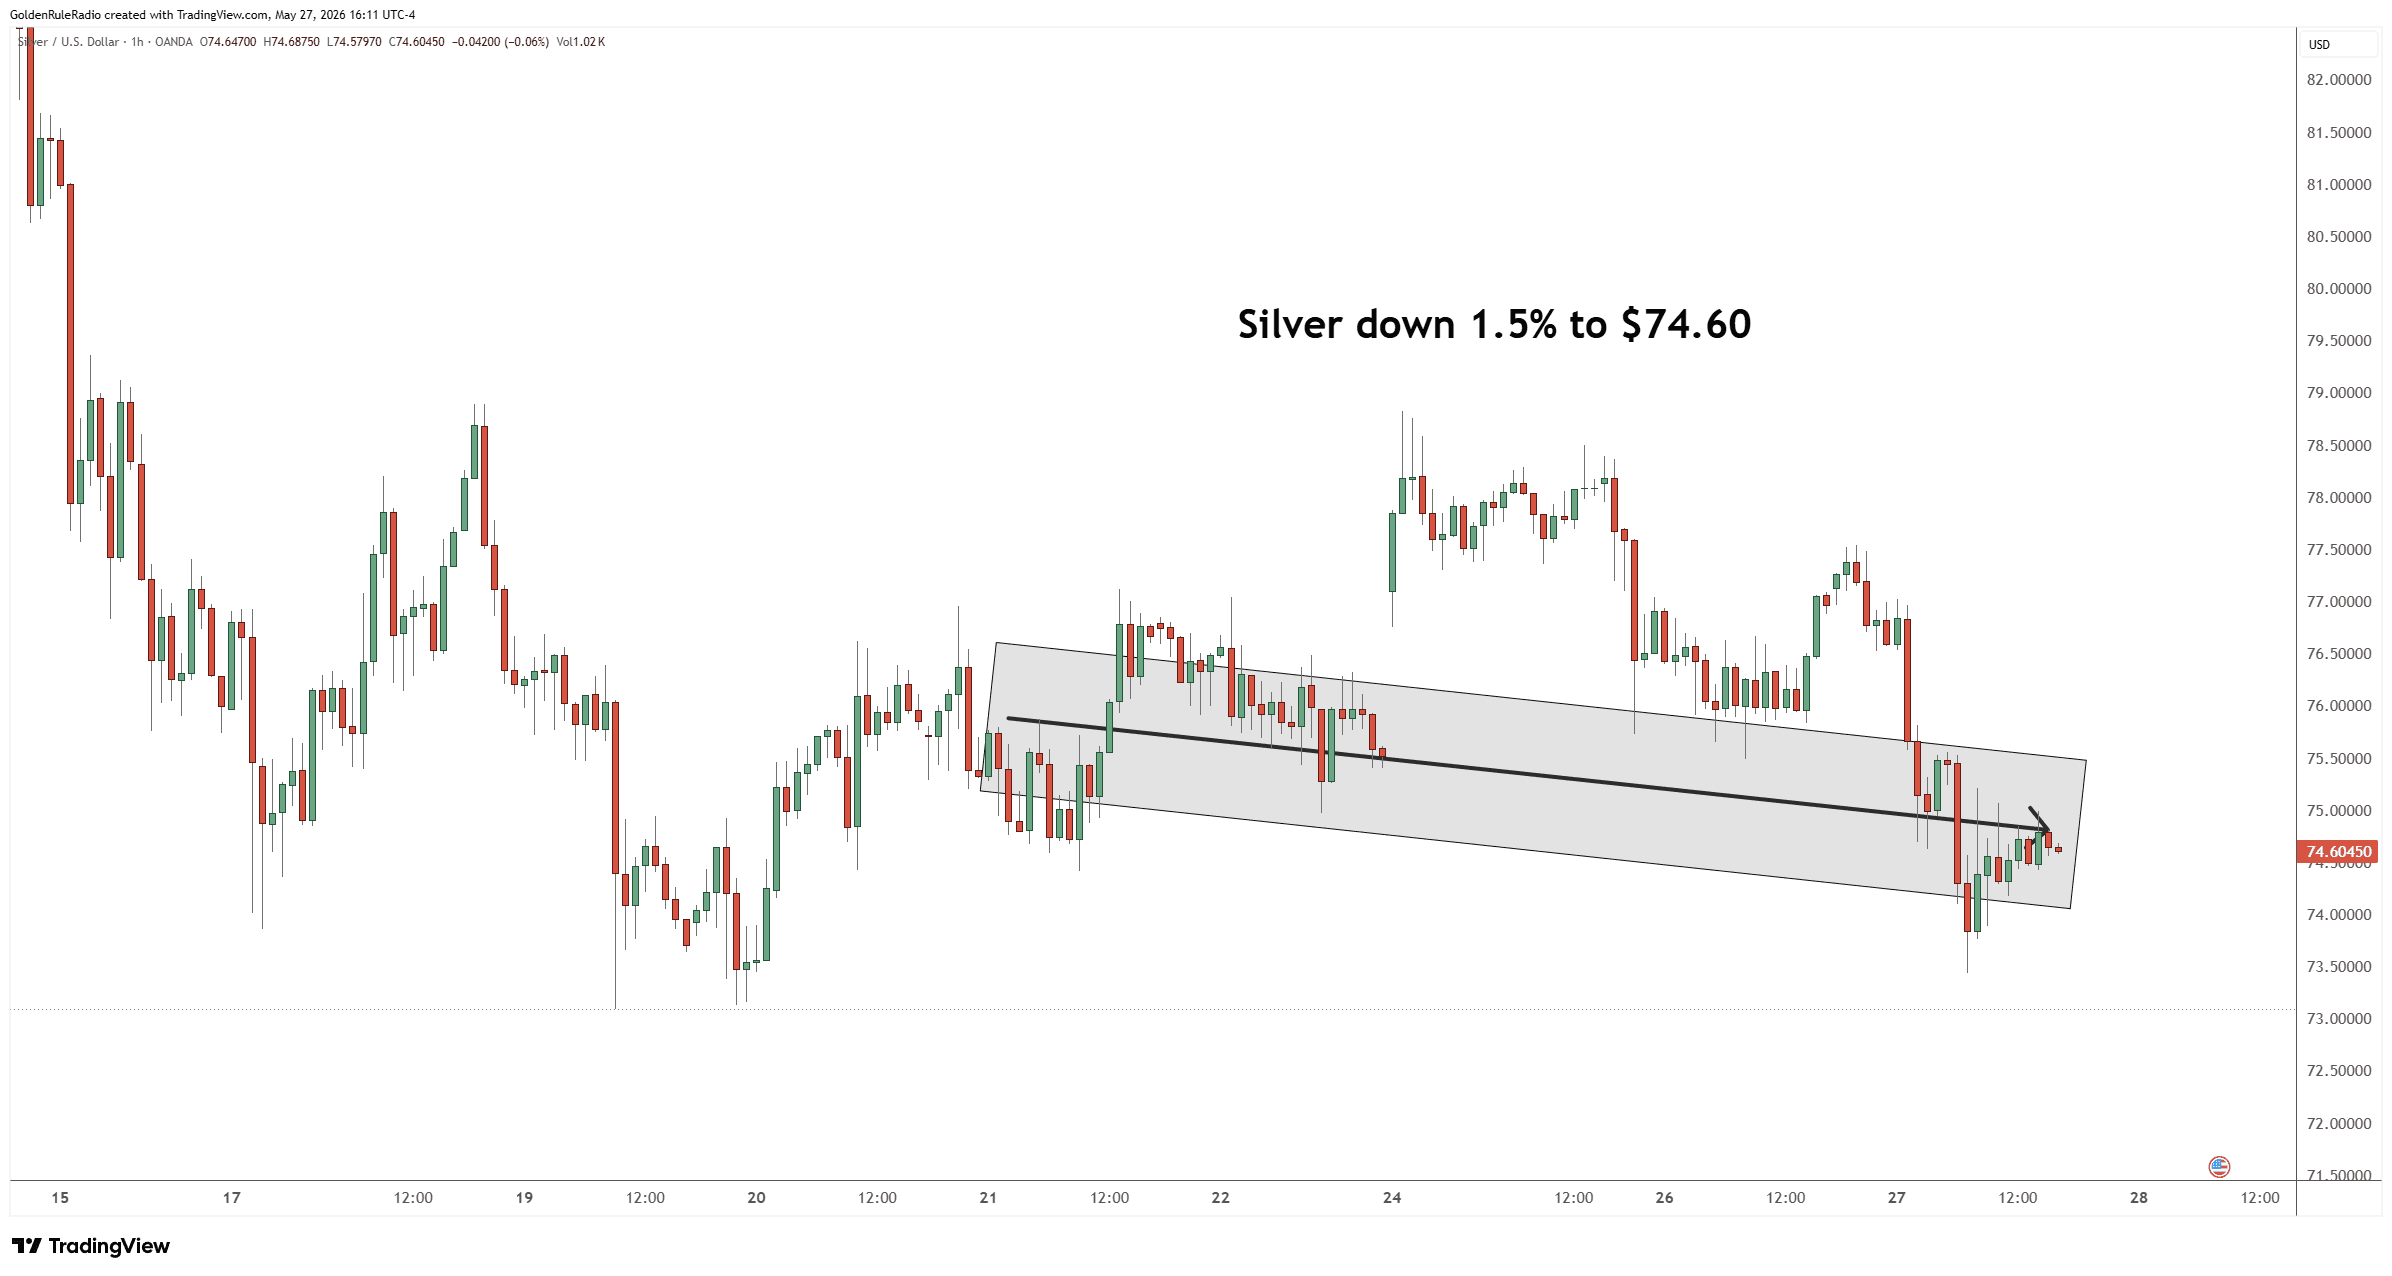
The price of silver is down 1.5% to $74.60.
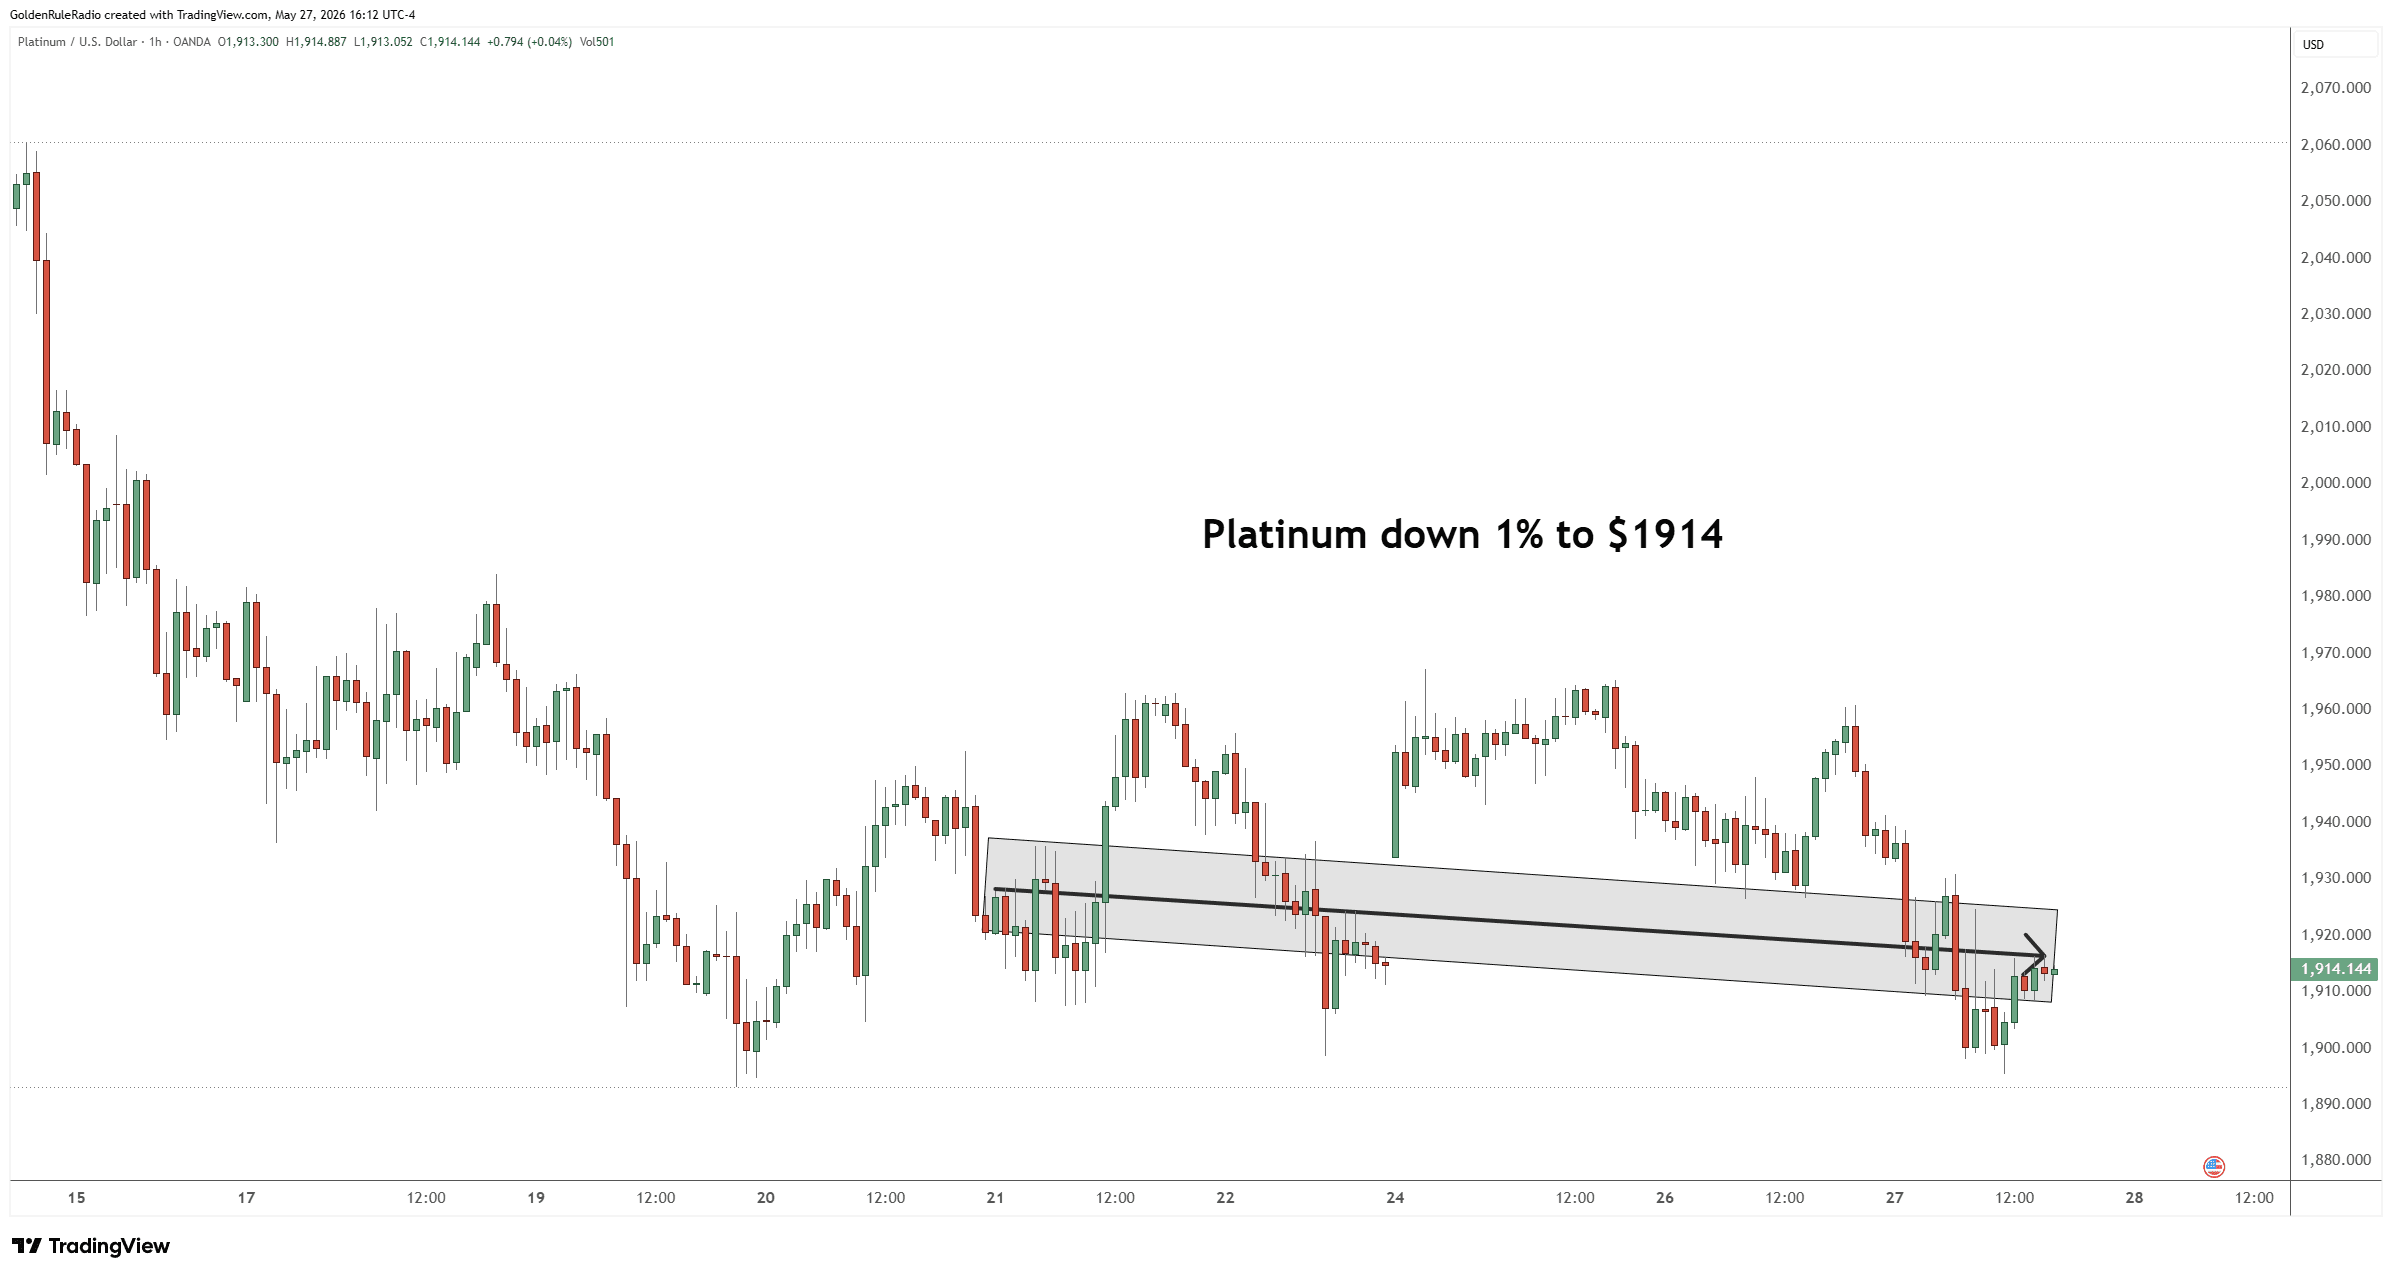
Platinum is down about 1% to $1,914 (back under the $2,000 mark).
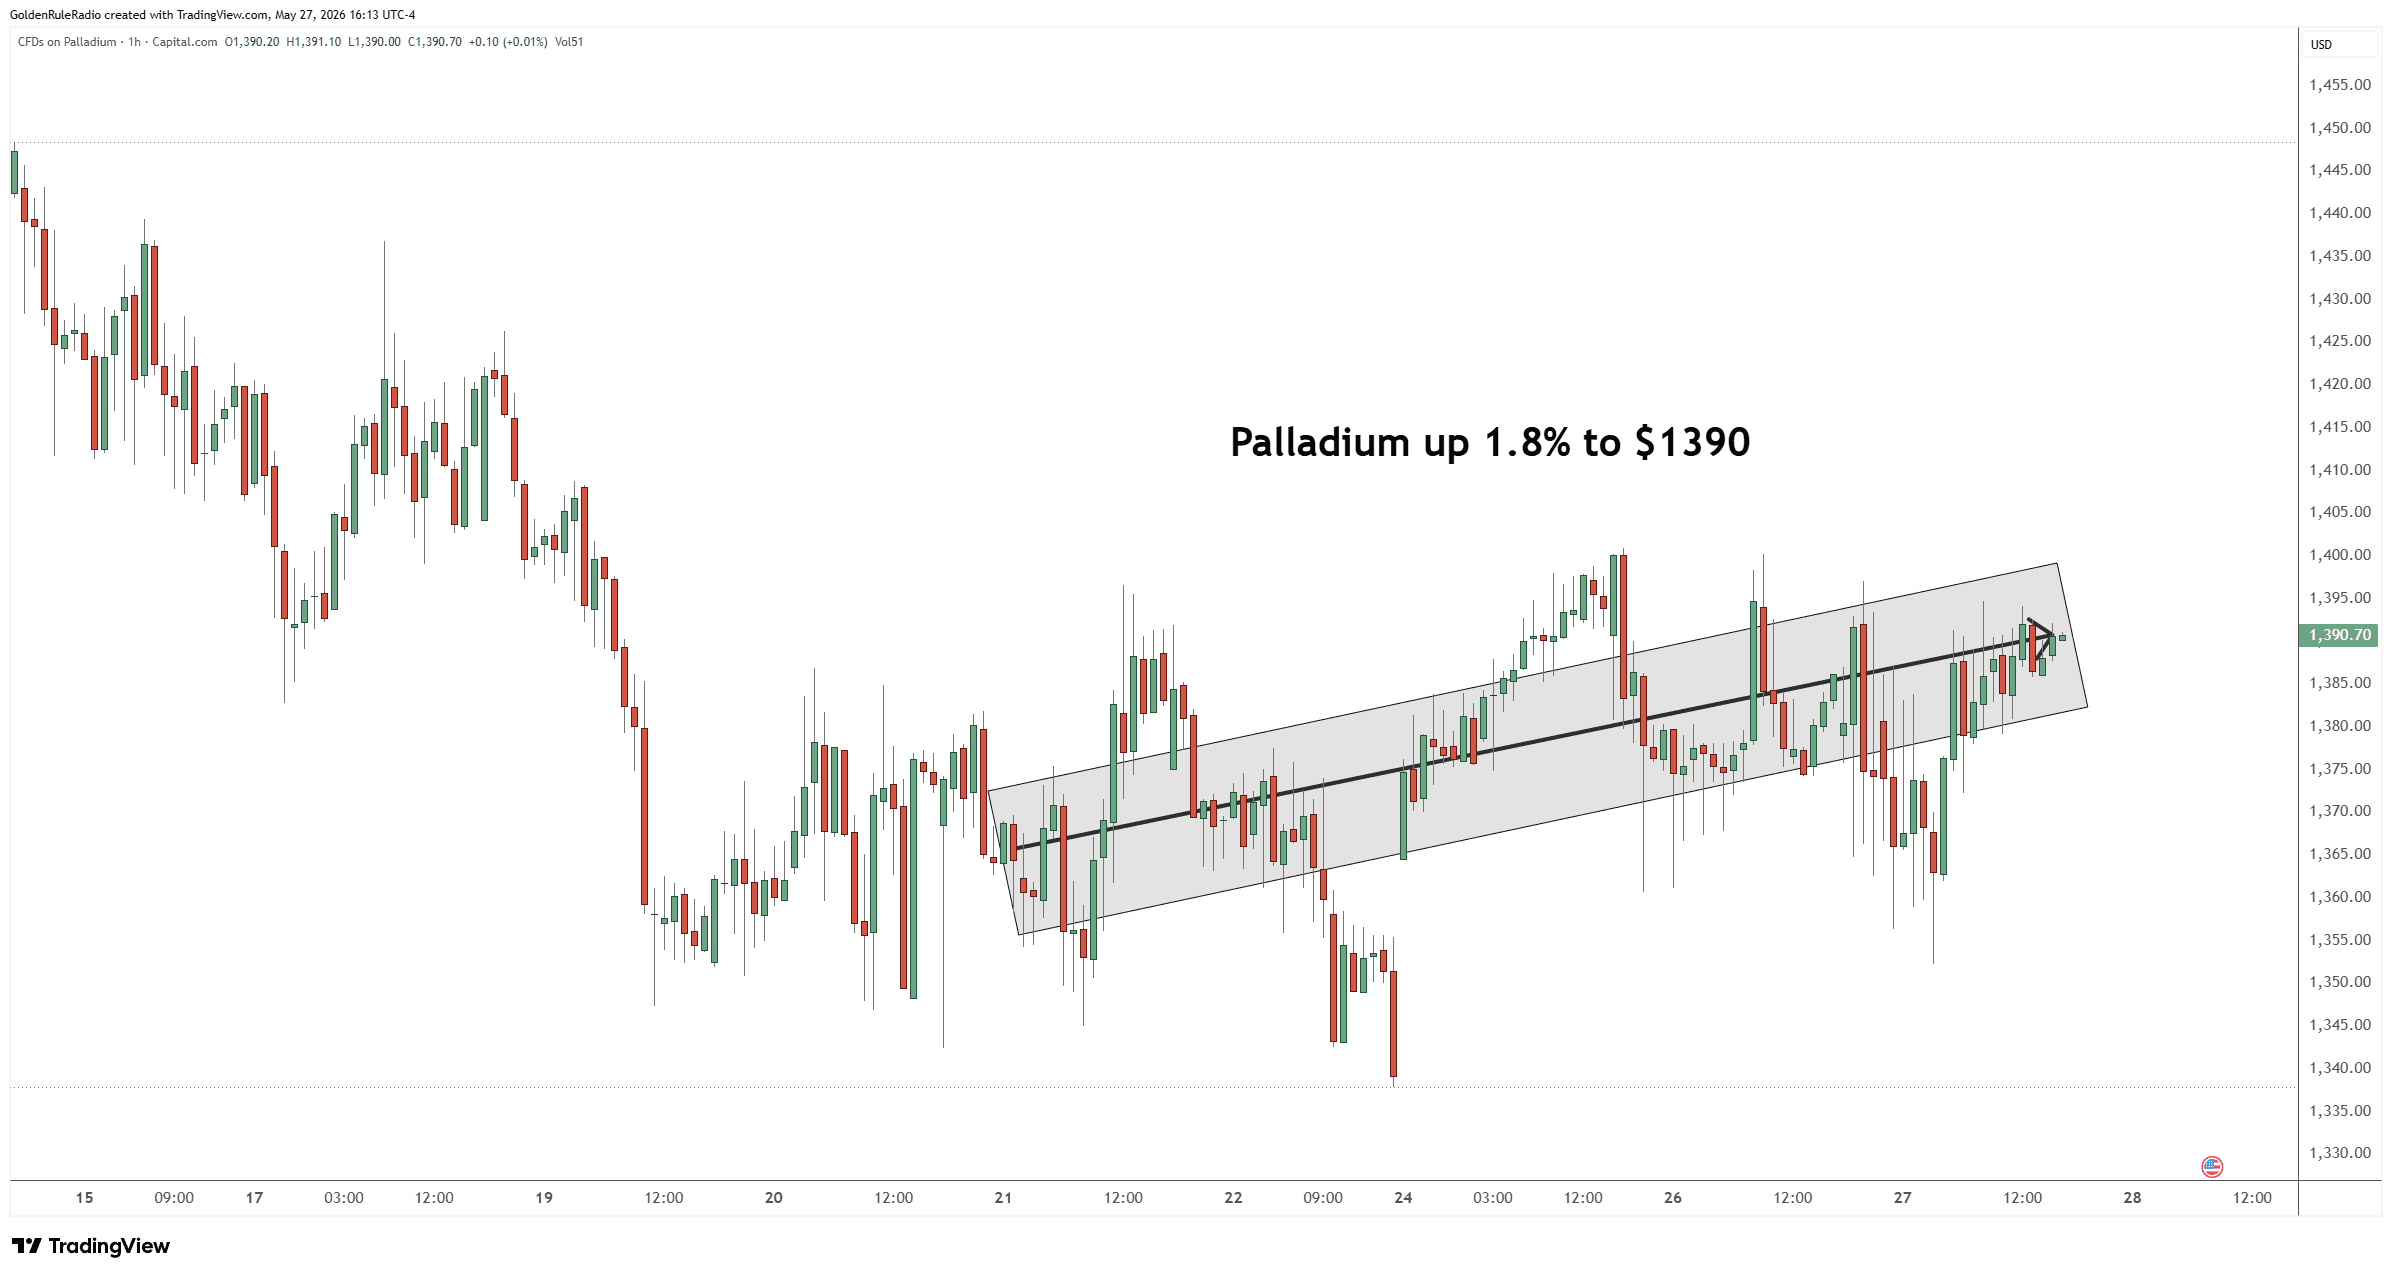
Palladium is up 1.8% to $1,390 (the week’s standout performer).
Looking over at the paper markets…
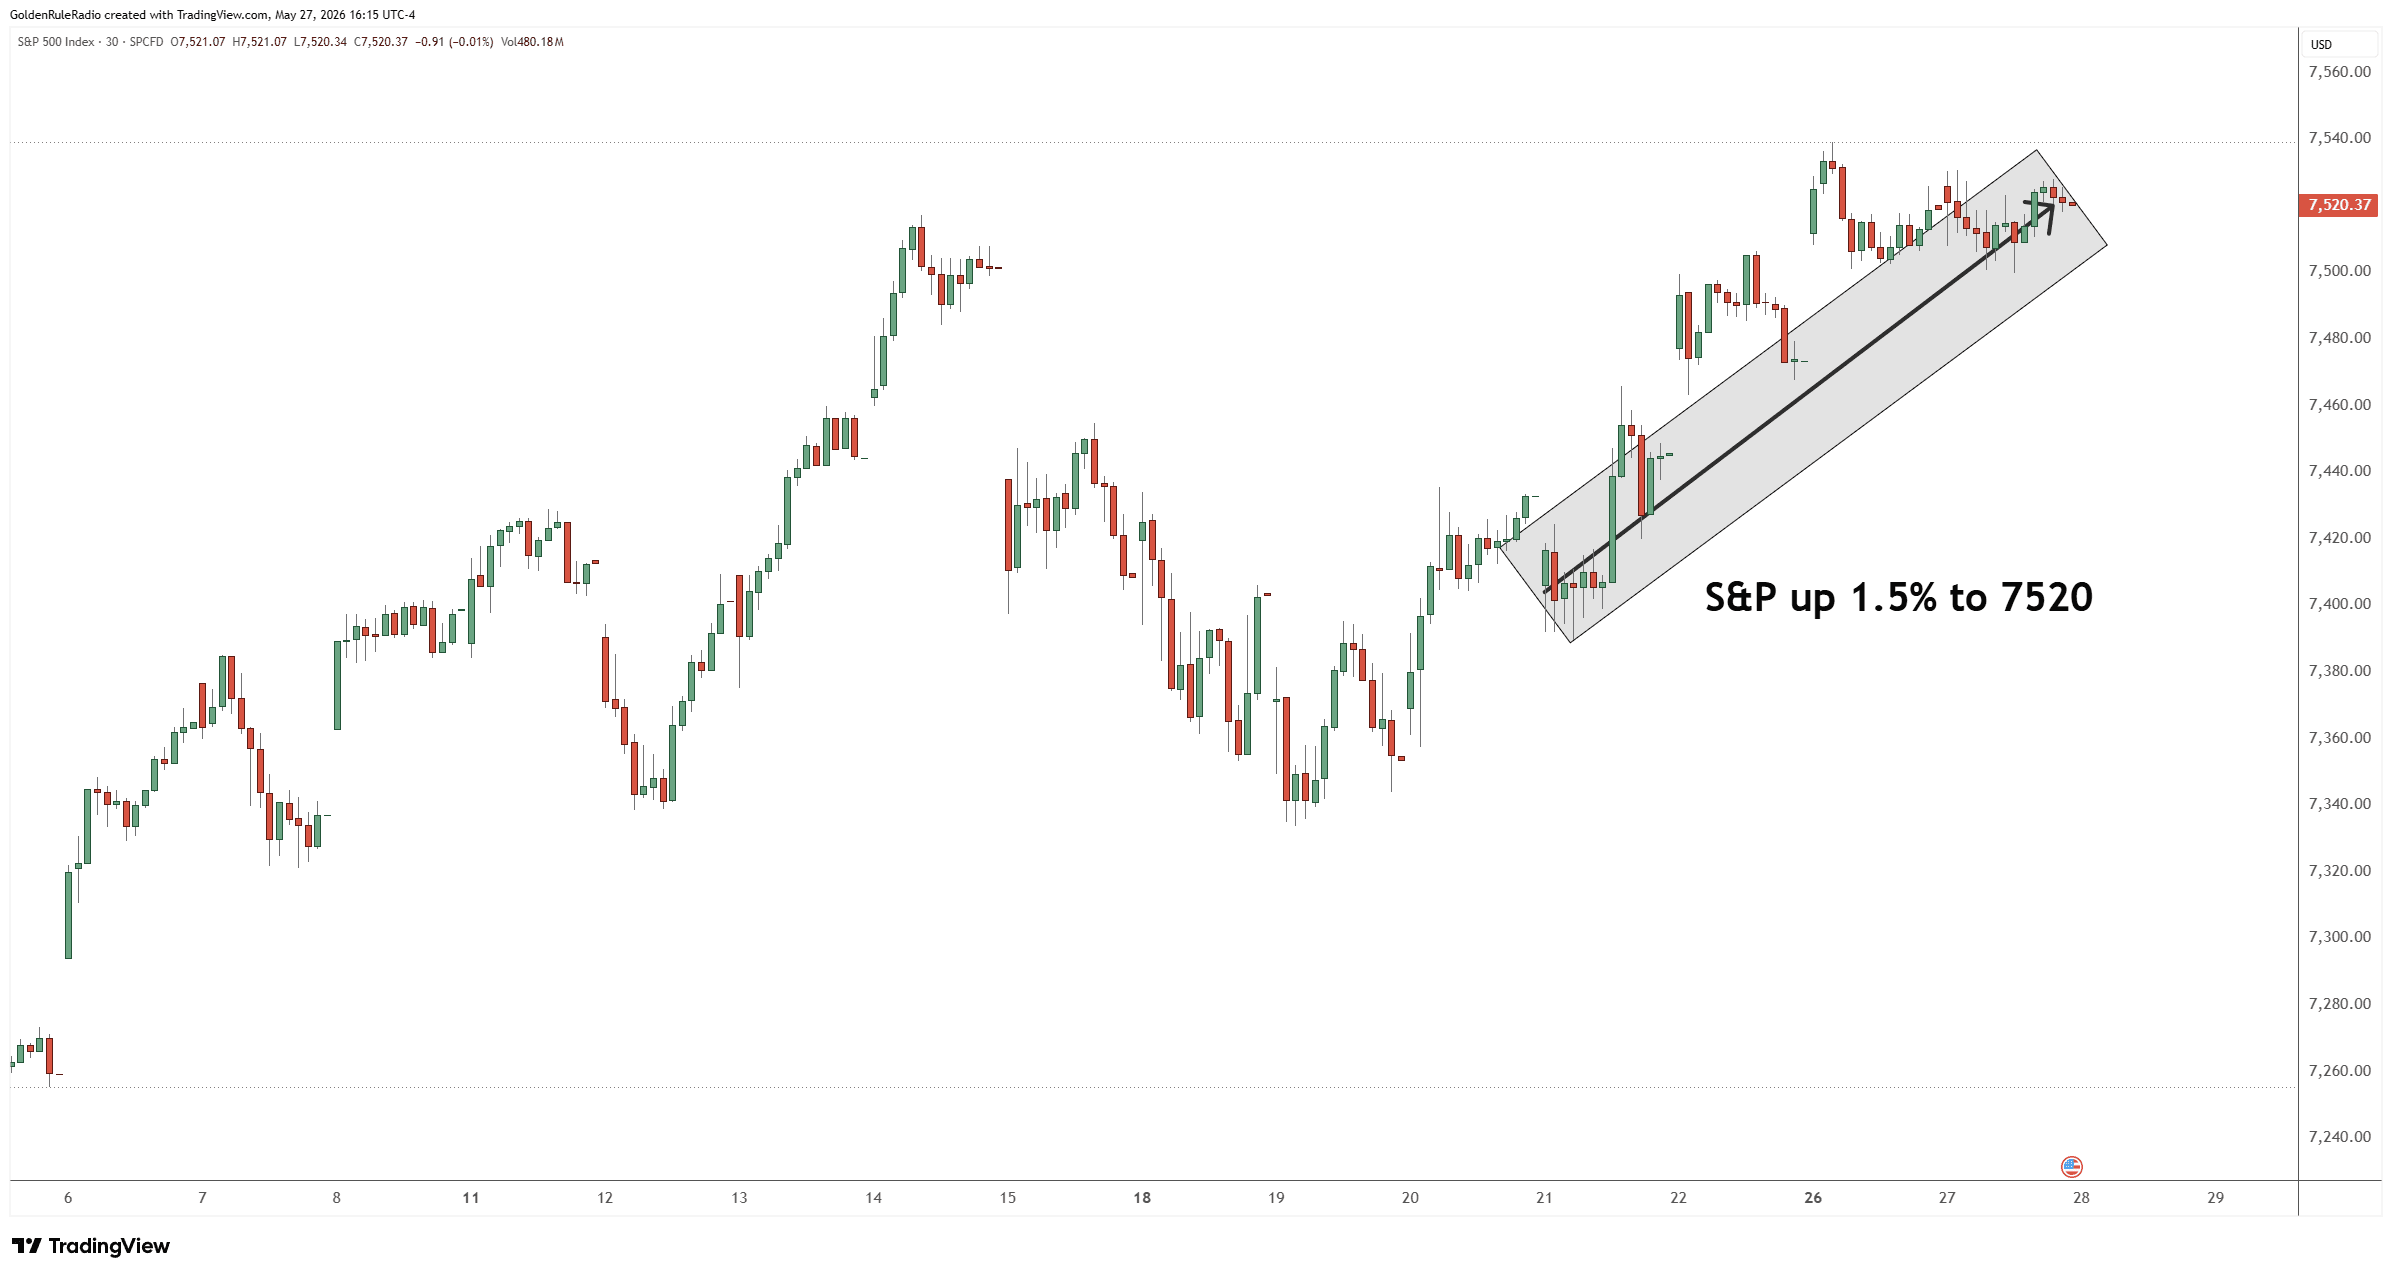
The S&P 500 is up about 1.5%, touching a new all-time high above its previous peak, now at 7,520.
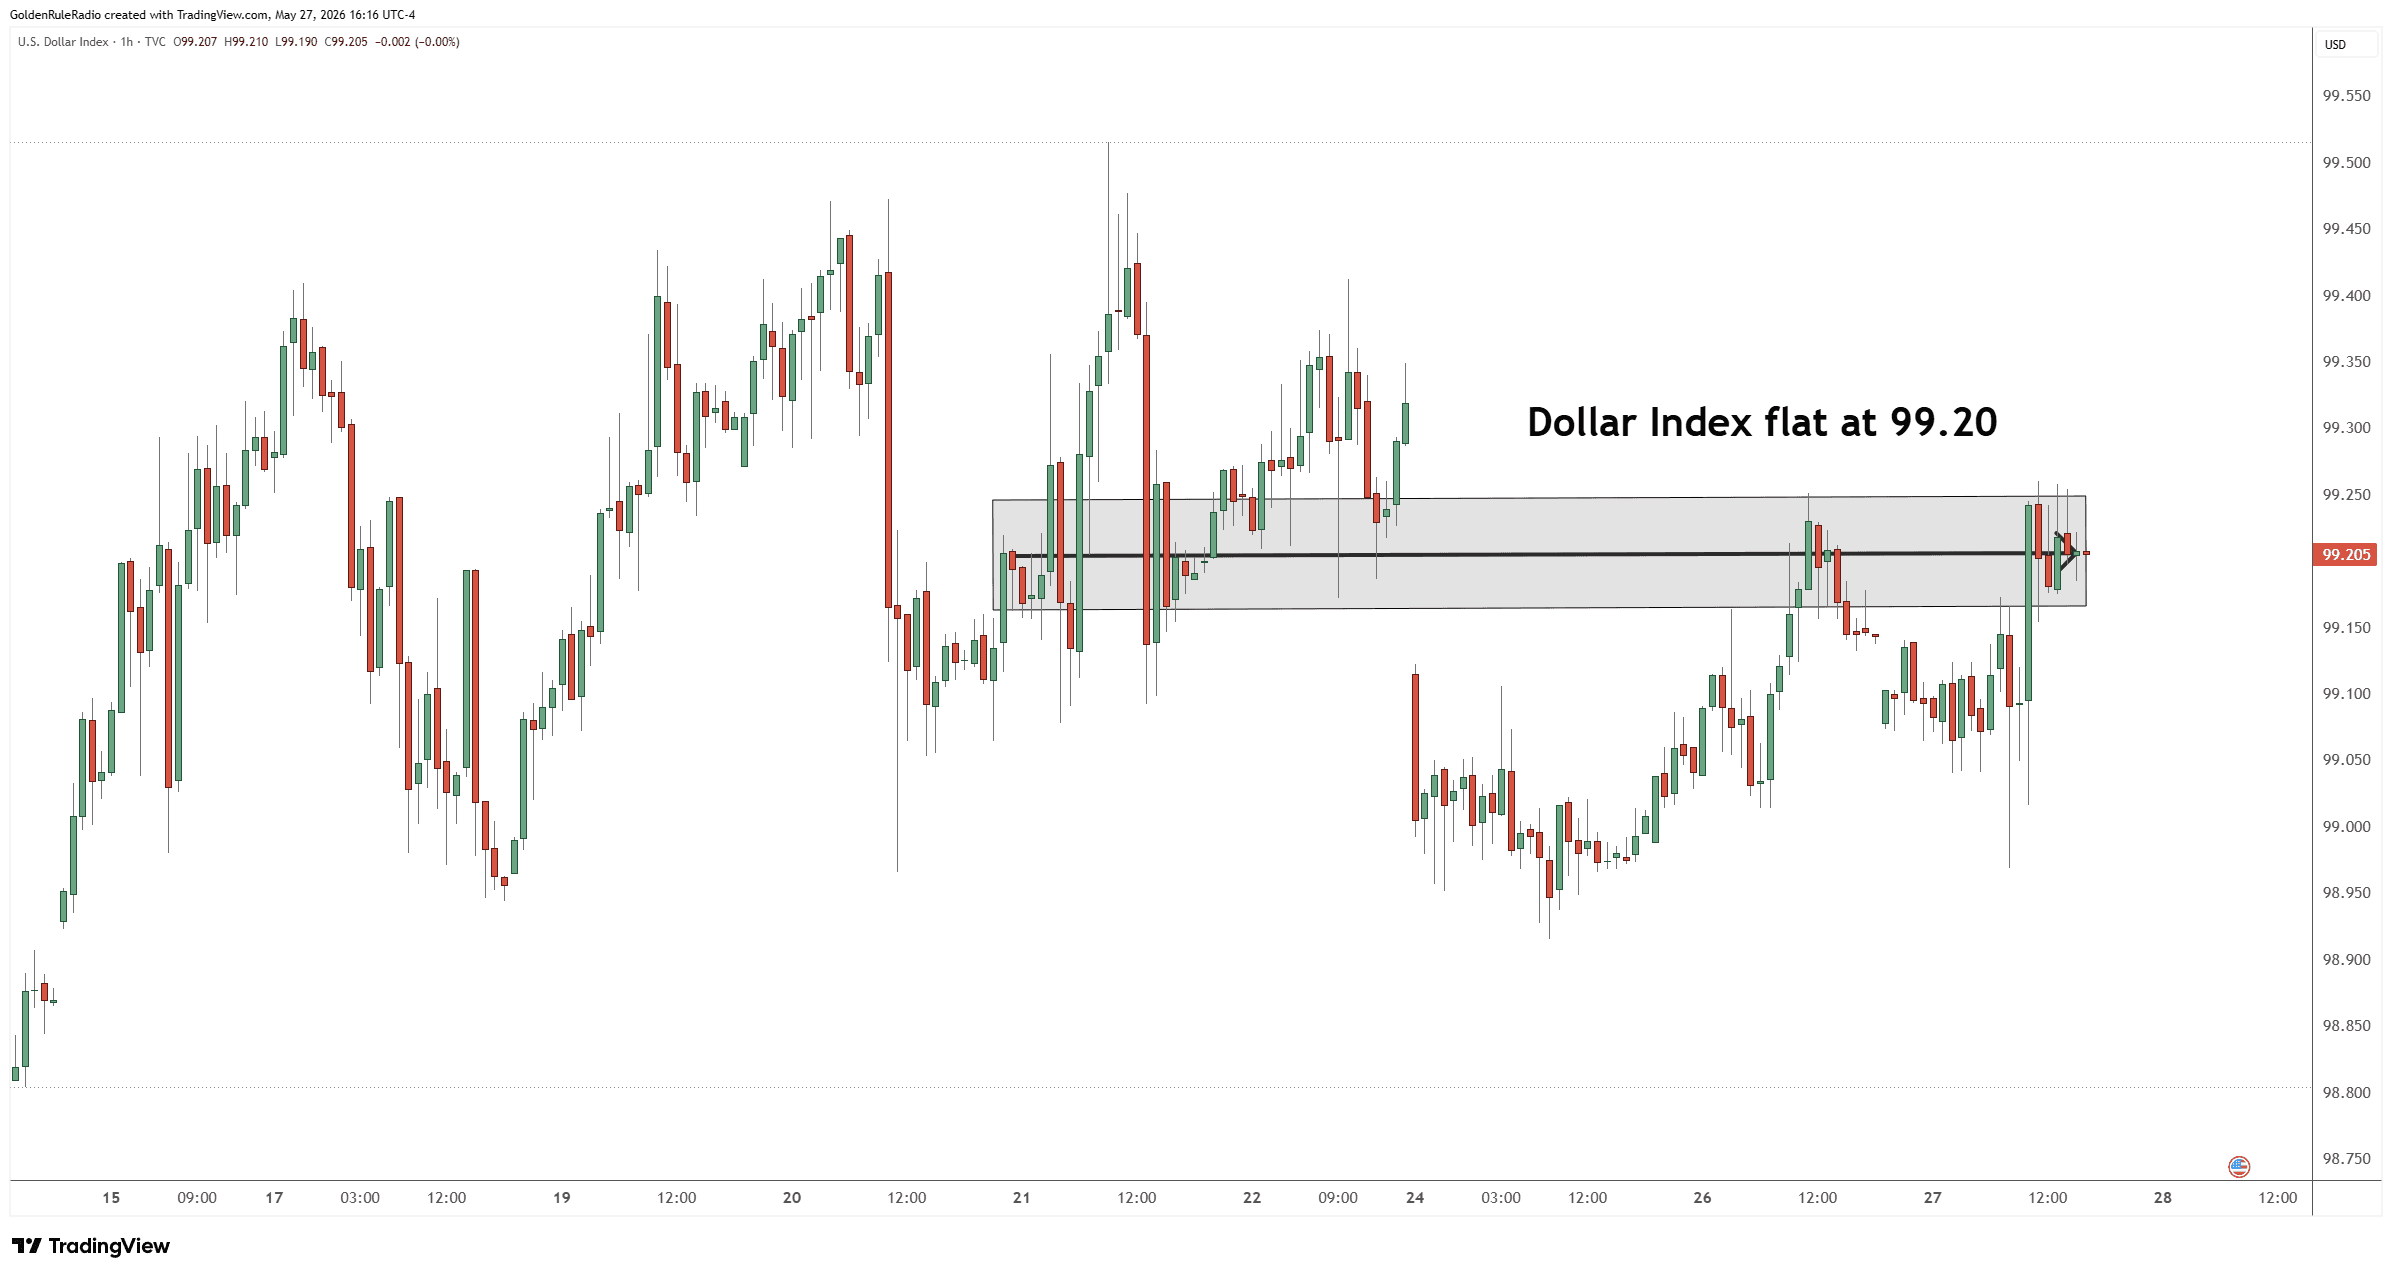
The US Dollar Index is essentially flat at 99.20.
Silver, Platinum Lag in Quad Shift
If you’ve been wondering why silver, platinum, and palladium seem to be underperforming relative to what you might expect, there’s an economic framework that explains it well.
We’ve been looking at Hedgeye’s macroeconomic quad model — a way of understanding where the economy is based on the direction of two variables: GDP growth and inflation. Right now, the U.S. appears to be transitioning from Quad 3 (slowing GDP, rising inflation) into Quad 4 or Quad 2 (growth accelerating alongside rising inflation).
Here’s why that matters for metals: silver historically performs best in Quad 1 — when growth is accelerating and inflation is slowing toward that 2% target. We’re not there yet. Palladium, on the other hand, tends to be more sensitive to raw commodity and industrial inflation — which is why it was the lone gainer this week as other metals softened.
The takeaway? Silver’s near-term path depends heavily on whether inflation can be brought under control, which in turn depends significantly on oil prices — and oil prices depend significantly on what happens in the Middle East.
The Fed Is in a Corner
New Fed Chair Kevin Warsch made a striking comment in prepared remarks in Germany last week: he can no longer rule out rate hikes further down the road if inflation doesn’t abate. That’s a hawkish signal that caught markets off guard.
But here’s the bigger picture: the Fed’s traditional tools are losing effectiveness. Rate cuts and rate hikes have been over-relied upon for years, and neither has produced the intended results cleanly. What’s increasingly likely is that the real mechanism going forward will be balance sheet expansion — the Fed buying U.S. debt to keep yields from spiraling out of control. That’s yield curve control by another name, and it is, at its core, money creation.
Meanwhile, the U.S. continues adding roughly $2 trillion per year to the national debt. With roughly a quarter of outstanding U.S. debt rolling over this year and banks being positioned to absorb more Treasury issuance, the structural case for owning gold as a non-debt monetary asset remains as strong as ever. A Fed that is cornered into expanding its balance sheet — regardless of what it says publicly about fighting inflation — is a Fed that is ultimately favorable for precious metals over time.
Oil, Iran, and the Stagflation Wildcard
One of the most consequential near-term variables for metals right now is oil. Elevated energy prices act as a “force multiplier” on inflation throughout the entire economy — every good that requires transportation to reach you becomes more expensive. The longer oil stays elevated, the harder it becomes to bring CPI back toward 2%.
Negotiations with Iran have been ongoing, and any deal that brings oil prices down would improve the inflation picture, potentially moving the economy closer to that Quad 1 environment that silver needs to really shine. But Iran has historically been a patient negotiator — this isn’t a situation where a quick resolution is guaranteed.
For metals investors: geopolitical resolution would be a tailwind for silver specifically, while gold tends to remain well-supported regardless, given its role as a monetary reserve asset across all regimes.
The Gold-Silver Ratio Watch
The gold-silver ratio — currently sitting around 60:1 — is one of the most important tools we use to guide our clients on which metal to hold and in what proportion.
Here’s the context:
- The ratio over the last 10 years has averaged around 80:1
- The ratio over 30 years has averaged around 67:1
- At its extreme high during COVID, the ratio touched 125:1 — a signal to load heavily into silver
- At its recent low in January 2026, the ratio compressed to around 47:1 — a signal to begin rotating back into gold
- Today, at roughly 60:1, we are below the long-term average but not at the extreme lows that justify aggressive silver accumulation
Don’t wait for a perfect ratio to act. Some clients who bought silver above 100:1 have already made meaningful swaps into gold at 50:1 and below, locking in ounce gains of 50–70%. For those who haven’t yet acted, the mid-50s to low-60s range still offers an attractive opportunity to begin — not all at once, but in stages.
If you’re sitting on a 60–80% silver position, it’s worth considering stepping down a portion now. The historical trend for the ratio over the past 40 years has been rising — meaning gold has been trending more valuable relative to silver. The floors keep getting higher. Don’t hold out for a 16:1 ratio that may never come and, even if it does, may take another 15 years to arrive.
The practical approach: Work with your McAlvany advisor to identify your entry ratio, your exit ratio targets, and the percentage of your position you want to move at each level. A staged approach — three to five tranches — takes the emotion out of the decision.
Gold’s Floor Is Forming
From a chart perspective, gold has built a fairly solid floor in the $4,375–$4,450 range — a level it has tested and held in recent sessions. Prices are currently sitting right at the lower end of this support zone, which means the next few weeks will be important to watch.
Silver, despite its softness, is sitting near the bottom of a short-term rising channel — which means there could still be another opportunity to see the ratio compress back toward the high-40s or even sub-50 before it moves higher again. For investors who haven’t fully acted on ratio trades yet, this window may still be open — but probably not for long.
The broader message from the charts aligns with the fundamentals: we are in a correction phase within a larger bull market, not at the end of one. Higher highs and higher lows remain intact for gold. The question isn’t whether to own metals — it’s how to position optimally within the trend.
What This Means for You
This is not a moment to panic or sit on the sidelines waiting for “perfect” conditions. It’s a moment to be methodical:
- If you own silver acquired at high ratios (80:1 and above): Begin scaling out in stages. You don’t need to sell everything, but taking some wins now — especially inside an IRA where there’s no immediate tax drag — grows your gold ounce count without adding fresh capital.
- If you’re holding cash waiting for an entry: The current range in both gold and silver represents a reasonable entry zone within a long-term uptrend. Dollar-cost averaging over the next several months is a disciplined approach.
- If you’re concerned about inflation and the Fed’s direction: Gold remains your core holding. The structural case — deficits, debt, money supply expansion, and global central bank accumulation — hasn’t changed.
As always, the team at McAlvany Precious Metals is here to help you think through your specific situation, whether that’s a ratio trade inside an IRA, building a new physical position, or reviewing your overall allocation.
Here to Help
Ready to talk through your precious metals strategy? The advisors at McAlvany Precious Metals have a collective 75+ years of experience in the market. Reach out for a complimentary, no-obligation consultation at 800-525-9556.