More
Presented by Doug Noland since 2012
* * *
Kevin: Welcome to the McAlvany Weekly Commentary. I'm Kevin Orrick along with David McAlvany.I have gone back multiple times, Dave, to the webinar that you and Morgan and the other guys gave. And there are some key questions that we continue to receive, like, can gold have a meaningful rise if the consumer doesn't actually enter the market? And, how high do we think gold might go when it does go? Those are questions that you all went into detail on. I'd like to go back and look, during this particular Weekly Commentary, at some of those key moments.David: Kevin, with the Commentary, we're always looking for the appropriate framing and wanting to establish a healthy context so that investors can have a different appreciation for the dynamics that are in the marketplace, and make wise decisions. It would be easy to get lost in one month, two months, three months of market volatility and forget the bigger picture. And so, just as a review, to look at regime shift, some of the most significant regime shifts in our lifetime that are happening now, that will have defined and will continue to define the direction of the gold market in the months and years ahead, I think that review is helpful, and the Q&A will be helpful as well.Kevin: Yes, Dave. And this is actually from our McAlvany Wealth Management webinar from a few weeks ago. And for the listener who wants to see more than what we're about to show today, we will put a link to the entire webinar in the comments below.David: The rage today amongst investors, both professional and non, are data centers, are large language models, AI, semiconductors. And as we witnessed with the launch of SpaceX in recent days, the rage is companies that are likely to transform how we vacation on the moon and visit our intergalactic in-laws. These abstractions, enabled by ones and zeros and truly spectacular engineering feats, do have value, but not without reliance on practical physical realities—practical realities like energy, industrial commodities, construction materials, agricultural commodities, precious metals.Today, faith in the abstract may prove to be perfectly legitimate, may even extend to cryptocurrencies and quantum computation. But never forget, never forget that price is what you pay, value is what you get. If you overpay, you are likely to have performance problems with your portfolio. Prices paid for today's most popular investments are a performance problem in the making. Kevin Warsh, the newly elected Fed chair, recently shared that AI, in his opinion, will be the source of the next economic miracle, a miracle of productivity. Maybe he's right. Time will tell. What we are interested in, and we'll spend some time just discussing today, are the perceived fallen angels within the markets, and a particular kind of halo that only those hard asset companies can wear. So, let's dive in.* * *
David: March 29th marked the lows in the equity market. Massive rally at month end and quarter end was spurred by headlines and announcements of the war ending soon, along with massive derivative short covering. US GDP was recovered, has recovered from the fourth quarter slump. We had the government shut down, which left its mark in the fourth quarter, about a half a percent growth, shrinking the full year number to 2.1%. Real Q1 growth has been revised lower to 1.6% with the Atlanta GDP marking the last several months closer to 4%. And last week's GDPNow figure from the Atlanta Fed has shrunk yet again to 2.8%.The White House very enthusiastically points to 5 to 6% GDP growth by year-end. Probably aggressive, in our mind. Bear in mind that the White House uses nominal GDP, which ignores inflation. Thus, the difference between what is reported and projected, they're like nominal versus real.Business investment was massive, has been this year, was setting a record pace last year and we're blowing out those numbers so far this year. So, business investment in Q1 surged to an annualized 8.6%, largely attributable to the AI CapEx arms race. Government spending also very significant, increased by 4.4%. Consumer spending remained anemic at 1.6% growth.The big theme, AI, CapEx spending. No limits budgeting for competitive AI edge, regardless of near-term returns on investment. Near term in that space is years, even 10 to 15 years out. When you combine government spending with business CapEx investment, it's no surprise that GDP as a measure of economic health is as strong as it is. Throw in the wealth effect for good measure as liquidity gets recycled through the economy, through the financial markets and into the economy over and over again, and GDP growth remains positive.The GDP deflater, which is the inflation assumption used in GDP, is not the same as CPI, not the same as PPI or PCE. And in fact lowballs the inflation issue, marking inflation at less than 3%. So frankly, if a more realistic inflation number were used, GDP growth would be closer to zero. Another bump in inflation, and I think we have real GDP in the negative territory. In that context, you're talking about stagflation. What GDP does not reflect is the bifurcation of experiences within the economy. Economists refer to the K-shaped economy, which captures this bifurcation along socioeconomic lines.The upper end of the K is your upper middle and upper classes. They're asset rich, they have buoyant balance sheets, which are enhanced by asset inflation, driven by ample liquidity in the financial markets. And of course this translates into spending numbers. The top 10% of wage earners account for 50% of all consumption—consumption making up nearly 70% of GDP. If you contrast the upper part of the K with the paycheck-to-paycheck crowd, the lower extended leg of the K is feeling the pinch from consumer price inflation without the offsetting increase from stocks and other investments. So, there's no wealth effect for most Americans.For middle America it already feels like recession, and sentiment indicators reflect that very strongly. Again, using a more realistic inflation number reveals that the average American is feeling the pinch. And it explains the University of Michigan sentiment numbers, which are at record lows, below the levels we reached during COVID if you can believe that.Enter the energy shock, and just remember that official inflation statistics were in fact creeping higher prior to the Mideast conflict. But with a reduction of 15 to 20% of global oil supplies, you now have inflation saturating the economy. CPI, PCE, and PPI, the wholesale price inflation index, all reflect higher levels of inflation. And over the last 90 days, the expectation of rate cuts have flipped to rate hikes. 100% probability of a hike by year-end, 67% probability of two hikes by this time next year. If you're watching the rate markets after the Warsh commentary today, the rates markets are expecting higher rates. Inflation brings a host of economic impacts and financial market complications, which will become obvious as the year proceeds. Morgan will discuss Fed monetary policy and bond market implications a little bit later.Not to get off track, inflation is not the only problem the bond market is dealing with. Yes, a 4.2% CPI print, 6.5% PPI print, they're meaningful, particularly for the bottom of the K-shaped economy, but too much supply—this is the big issue—too much supply and waning demand is also pressuring interest rates higher regardless of Fed monetary policy. Bonds face bear market dynamics, which many investors will in fact be surprised by.As for equities, I'll provide a few highlights. In summary, we are negative on the big indices like the S&P, the Dow, and the NASDAQ. This is in stark contrast with hard asset-related equities where we remain very bullish.Breadth in the main indices has narrowed. Only a few names are carrying the indices to new highs, which is never a healthy dynamic. Again, breadth is this [indicator of] how many companies are on the move to the upside. When there's only a few, that's an unhealthy dynamic. 50% of the year-to-date gains in the S&P 500 are from five companies.Valuations are between two and a half to three standard deviations from the mean. And on that basis, expected returns will hug the low single digits going out a decade. We look at the Shiller PE, we look at price to sales, we look at market cap to GDP for those valuation metrics.Examples might be helpful here. The median price to sales for the S&P 500 is 1.6. It currently trades at a very rich three and a half times. Compare that to Nvidia at 20 times; at Palantir, 63 times; or SpaceX at today's pricing of over 110 times price to sales. This is why I suggest that expected future returns based on those valuation metrics will hug the low single digits going out a decade. You are overpaying for those kinds of hype narratives.So what do we like? Hard assets continue to make sense today. We have built that case over recent years. We have built a diversified portfolio of companies that fall into four categories, all a unique expression of the hard asset theme. Global natural resources, infrastructure, precious metals mining companies, and real estate exposures in the form of publicly traded REITs.Each of these categories is like its own portfolio within the total framework—four portfolios in one. In this new cycle, we are witnessing gold as the tip of the spear, leading to further sequential opportunities in hard assets as the markets adjust to regime change.The studies we've undertaken and the portfolio allocations we're pursuing are gaining traction. As they gain traction, they also gain an audience. As the audience grows and capital begins to flow, positions that we are squarely in are positioned for growth. From a Goldman Sachs report released March 24th of this year titled "The HALO Effect: Heavy Assets, Low Obsolescence in the AI Era," I quote, "After more than a decade of under‑investment, Goldman Sachs Research analysts believe that higher real yields, geopolitical fragmentation, and supply chain rewiring have shifted equity leadership back toward tangible productive assets. They introduce the HALO framework—Heavy Assets, Low Obsolescence—to identify companies that are less exposed to technological obsolescence."So, now we have an acronym: HALO. Goldman and others are concluding in 2026 what has been in our minds for some time. While hard assets, or heavy assets, as Goldman likes to call them, are fresh on the minds of investors concerned about the implications of AI, we arrived at the same conclusion for a different set of reasons.AI is one more buttress for our argument. Hard assets are capital-intensive. Hard assets have low obsolescence. Hard assets rest in the middle of a scarcity bullseye. Hard assets provide resilience and are of great strategic value. Hard assets are on the diversification path for investors wanting to move from crowded tech, called capital-light trades, to a capital-heavy undercrowded domain.Commodities are breaking away from a floor-pinned position and rising in relative value to the popular abstractions of our day. Capital-intensive businesses have been on the move for several years, but their performance has been largely obscured from view by the capital-light companies outperforming them with their value tied to abstractions like intellectual property and brands. Examples of Nike and Coca-Cola come to mind, or companies that are selling software as a service and data flow, Microsoft, Adobe, Salesforce, or your leveraged networks and platforms, Airbnb, Uber, and things like that.Our perceived fallen angels have some advantages, which, to many investors, look like disadvantages. Operational complexity, resource scarcity, high sustaining capital requirements, energy and labor intensity, regulatory constraints, massive permitting requirements, long project timelines, all of which, again, most people would see as negatives, but these qualities provide the moats and cyclical advantages we're looking for in a period of rising inflation and rising interest rates.As an example, picture the copper mine built 30 years ago for 1.5 to $2 billion. To replicate that copper mine today might cost 15 to $20 billion, not the domain of a startup company, unless you're SpaceX, of course. This is not new-world stuff. In fact, it's old-world stuff. But guess what the irony is? The new-world stuff still depends on the old world, and that is a sweet revenge. Over time, a replacement is prohibitively expensive, permitting becomes harder, environmental limitations increase, skilled labor, which is very, very blue collar stuff, it's harder to find. And the asset-heavy nature of the companies reprices upward during inflationary regimes.Morgan: Former Treasury Secretary under Presidents Nixon and Ford William E. Simon famously said, "I continue to believe that the American people have a love-hate relationship with inflation. They hate inflation, but love everything that causes it." Now, for the last 50 years, it is the structure of the post-1971 dollar-based global system, or petrodollar system, that's allowed US policymakers to do everything that causes inflation without reaping the full massive inflationary brunt of their policy consequences. But now that post-'71 monetary system is beginning to break down and we believe the Iran war is the latest significant accelerant of that monetary regime change trend. We expect the current conflict with Iran will have deep and long-lasting implications for the post-1971 US dollar-centric global system. And since the war started, we are not alone in that view. The Iran war seems to have been a catalyst for Western media to begin to awaken to the reality of global monetary regime change, and to China's central role in facilitating it.In late March, there was a Bloomberg article titled "Iran War Could Be Making of the Petroyuan, Deutsche Bank Says." Then in early April, Bloomberg Macro Strategist Simon White penned an article titled "Iran War Has Caused Lasting Damage to the US Dollar System." Both articles pointed to very real and growing strains in the post-1971 global US dollar system.Both articles focused on how the Iran conflict could be the catalyst for both erosion in petrodollar dominance and the emergence of a competitive petroyuan, citing media reports that Iran was allowing the passage of ships through the Strait of Hormuz only if oil payments were made in yuan. Furthermore, both articles warned that the erosion in the petrodollar regime could have "significant downstream effects" to the dollar's use in global trade and savings, as well as to the dollar's role as a reserve currency.Also in April, Peter Alexander, CEO of Z-Ben Advisors, a Shanghai-based consulting firm essentially aiming to bridge the information gap between West and East, penned a very important article on Substack titled "China's Killer (Geopolitical) App." In the article, Alexander adds great detail to both the threat of damage to the US dollar system and to the golden origins of the petroyuan.As Alexander put it, "For more than a decade now, the Beltway consensus held that the US dollar system operates as a geostrategic choke point that can be deployed to alter the behavior of other state actors. Books have literally been written on this very topic, and it may have been true for a moment in time.What has yet to be recognized is that, in present day, a US dollar choke point has, in fact, run up against hard limitations on its efficacy. The American move to nakedly weaponize the US dollar system was a message received by Beijing with immediate effect. The risk, no matter how remote, of China being blocked access to SWIFT was existential. A solution was required and the People's Bank of China was tasked with finding a workable alternative.In 2015, that task was completed and the cross-border interbank payment system SIPS officially went live. SIPS conducts all functions—again, via RMB—from messaging to clearing to initial fiat settlement. It also became the first system to seamlessly integrate payment and settlement of the onshore and offshore RMB, CNH and CNY.Perhaps more consequential when it comes to the great power competition, SIPS resides fully outside the New York correspondent banking network. The very parties that sought to apply economic coercion for the purposes of altering unwanted behaviors are now blind.Obviously the introduction of SIPS was meant to directly benefit China. It is now also the case that the network is providing an attractive solution to a host of global south countries in an era where the Trump administration has ratcheted up the deployment of coercive economic and financial tactics as points of leverage.Now, Western critics of the viability of a petroyuan argue that in a global US dollar-dominated system, participants in the SIPS network would be stuck with too much unwanted excess yuan. But there are two important rebuttals to that argument. First, over the last decade plus, China has undeniably become the factory of the world, meaning there is no limit to the menu of offerings foreign nations can purchase from China with yuan. Second, the SIPS network utilizes a gold-based or gold-linked yuan for neutral net settlement in an emerging network often referred to as the Golden Road.As Alexander explains, SIPS is just the payment network. With China's capital account opened via the gold window, any trading partner holding RMB surpluses can directly convert all fiat balances into physical gold. That gold can be held in a Shanghai vault well beyond the reach of America's foreign policy of sanctions and tariffs, as well as the newly opened Hong Kong vault and vaults soon to be expanded into Saudi Arabia, Singapore, Malaysia, and eventually additional hubs plan for Dubai and Russia.And in addition to acting as a neutral reserve asset and facilitating non-dollar trade settlement, the entire China gold complex is also being positioned to act as a substitute for another critical component of the US dollar system. In this new system, gold can replace, at least at the margins, the role of US Treasuries in acting as global collateral. While not as liquid as US Treasuries, the usage of gold as collateral is meant to be levered as a mechanism to support a host of cross-border trade activities, including usage as a financial tool for invoicing of any return trade of physical goods. Beijing has been executing plans for this entire gold settlement solution for the better part of a decade. Its overt objective is mitigating the inherent risk of America's leverage over the US dollar system. The system is functional. It's now operational. And it's now expanding rapidly. More recently, in late May the Financial Times also picked up on the emerging petroyuan story and elaborated on it.In a May 21st article titled "Iran War Open's Golden Window with China's Renminbi," the FT, like Alexander, explicitly tied the rise of the petroyuan to China's SIPS international payment system and its gold link. Furthermore, the FT referred to the Iran war as "proof of concept". According to the FT, "Gold could serve as a neutral asset for countries to recycle excess renminbi into allowing China to maintain capital controls while competing more with the dollar in global trade. China has regulated the Shanghai Gold Exchange with a strict settlement system. Exporters to China can receive payment in yuan and immediately convert excess yuan into gold bars on the Shanghai Gold Exchange International Board without using dollars, but with the security of a neutral asset." Importantly, the FT noted that, since the Iran War, adoption of Beijing's SIPS cross-border payment system is surging to record highs.And as I said before, that the Iran war has provided "proof of concept" for the SIPS system. According to the FT, the average daily value of transactions settled through SIPS hit a record of $135.7 billion equivalent per day in March, as well as a new daily record in April of $150 billion equivalent per day.For perspective, that April daily record would translate to roughly a massive $50 trillion equivalent annual run rate. In short, SIPs adoption is now booming. Now, over the past two months, a popular narrative to explain gold's recent sell-off has emerged. It suggests the war with Iran is fundamentally bearish for gold and that, as a result, the war has catalyzed official sector gold sales. Now it is true that some nations did pare gold holdings in the first quarter. A number of central banks and sovereign wealth funds shed an estimated 115 tons in the first quarter of 2026, but the vast majority of those sales were one-time events mostly attributed to liquidity effects stemming from the closure of the Strait of Hormuz.Those sales, combined with the negative price action, raised concerns about institutions' appetite for gold and their interest in continuing the dedollarization trend. But a Bloomberg report may fully dismantle that gold-negative narrative, as in reality, even net of previously mentioned gold sales, Q1 net central bank purchases totaled 244 tons, up from 208 tons in the previous quarter, marking the fastest pace of central bank gold buying in almost two years.Again, the 244 tons was a net purchase number. It includes the 115 tons of one-time Hormuz-related gold sales. The red extension line on this slide displays the actual 359 tons of Q1 central bank gold buying if you adjust out one-time Hormuz-related sales. And after adjustment, Q1 was essentially tied for the third-largest quarter of central bank gold purchases on record. And in MWM's view, it's no mistake that such a strong quarter of central bank gold purchases occurred alongside record-breaking levels of average daily values of SIPS network transactions.In short, the Iran war didn't launch the SIPS gold-based petroyuan, but is proving what the FT called a proof of concept. And it is proving to be the catalyst for a dramatic acceleration of the global recognition and adoption of the SIPS gold-based petroyuan. In sum, the non-dollar energy and commodity trading system that net settles surpluses into gold that former Goldman Sachs Head of Commodity Research Jeff Currie first described as gold recycling replacing dollar recycling two years ago continues to gain notable traction in the East and growing awareness in Western financial and media circles.In MWM's view, when gold's technical correction ends, the next leg of the gold bull market is likely to be greatly enhanced by the growing recognition among Western investors of global monetary regime change dynamics.With Kevin Warsh and the Fed facing a bond market crisis while their policy hands are tied, and the gold-based rails of an alternative non-dollar global system beginning to hit its stride, MWM is confident that we don't have to wait long for the gold bull market to shake off the ongoing technical correction and resume trend to new all time highs and beyond.David: I'll start with, "If the Fed increases rates and takes a more responsible fiscal policy, what does that mean for the gold price?" Morgan, you hit that squarely in your comments, but perhaps you could reiterate the standard assumption and what we've discussed in-house in terms of the Summers-Barsky thesis, how it would behave under one set of circumstances and why this time is different.Morgan: So basically Summers-Barsky is talking about gold basically moves inversely to real rates. So higher real rates makes gold less attractive and negative real rates makes gold attractive. But in our view, that dynamic is only fit for a healthy system. And I think we're far from a healthy system. So as I said in my presentation, I'm definitely of the mind that they may be able to hike interest rates 25 basis points, maybe 50 basis points, and maybe for a period of time. But we're at that point where the negative impact to the deficit via interest expense adding into government expenses and growing as fast as it is and ballooning as much as it has, you're talking about putting a debt spiral into motion if you allow real rates to go higher for longer.So I think those days are done, and I don't think they can— Part of the question was, I believe, is if they get more austerity in their fiscal policy. And that's also problematic for them because for one thing we're increasing defense spending, not cutting it—dramatically in fact, the plan is.And then we're not going to cut entitlements for political reasons. And also we aren't going to cut spending really because if we did at this point, government spending is such a large part of GDP that you would very likely trigger a recession. A recession means lower tax receipts. The stock market falling means the capital gains taxes drop. And again, that just feeds into the circular nature of the debt spiral dynamic. So I don't think there's really— I mean, I think practically speaking there is the cap yields and inflate your way out of this, is practically speaking what we're ultimately dealing with.David: The next question I'll take. "What does the price of gold look like in the future if retail investors do not participate in gold in a meaningful way even as government debt levels increase, the economy suffers, inflation interest rates remain at current levels or even increase?"I think the best analog for that is what we've witnessed from 2022 through 2025, where we basically had a $2,000 increase in the price of gold with virtually no participation from the general public. You could argue, and if you look at ETF statistics, there was a significant uptick in retail demand from the middle part of 2025 through the end of last year and into the beginning of this year. So retail did show up. But if you wanted to know what the price of gold looked like without the retail investor, central bank demand has been absolutely critical to driving the price. That 2,000 point move higher from 1,650, 1,800 to over 4,000 an ounce, largely attributable to central banks doubling their purchases from a run rate which was 500 tons per year and has been averaging at or above 1,000 tons a year since 2022.Central bank demand is not a forever thing, but we do see that continuing over the next several years. Morgan illustrated what the motivation would be from the standpoint of—well, I just mentioned from the standpoint of reserve management and what central banks want as a denomination for their reserves. And Morgan hit on how gold demand would be very central to a system of trade which does not settle in dollars and does not promote recycling of trade dollars or petrodollars into the US Treasury market. So that alternative system is yet another source, which is trade related, not retail or investor related.I do think that retail comes into the gold market at some point. And what we have witnessed in past bull markets in metals—we've been in the metal space for 54 years—and what we've witnessed there and even prior to that, if you wanted to stretch back 50 to 100 years or more, is that retail chases gold when it's afraid of something else. And so if that's volatility in the equity market, if that's volatility in the bond market, safe haven dynamics ultimately kick in. And today you don't see the need for it as people clamor for the newest, shiniest gizmos, gadgets, and solutions via AI.So when those markets turn, if those markets turn, I think retail has a motivation to diversify their own reserves, so to say, and look at it as a safe haven. But the moves in metals are not dependent on retail. I think central banks have defined the floor in gold. Retail will ultimately blow out the ceiling, which is a chapter yet to be written.The next question, "Have you seen the price estimates for gold in July of $20,000 an ounce or $1,500 an ounce for silver?" I have seen those. Of course, being in the metals business for 54 years, we've seen all kinds of projections over time. And what we would suggest is that a Dow/gold ratio of two to one or three to one is very reasonable. And so if you assume the movement of numerator and denominator, both of those things moving toward each other, you could see gold in the range of 15,000 an ounce. 12,000 I think is not unrealistic. 15,000 becomes a high watermark.Perhaps we could see 20, but I think you're beginning to really wonder at that point—at any point higher than that—if the true commentary is not supply and demand, but just reflecting a broken currency like we've seen with the yen. One ounce of gold trades for 750,000 yen. Is that particularly meaningful? Well, it is if your savings are based in yen because you've preserved your purchasing power as the currency has gone through a veritable meat grinder.So at some point prices become irrelevant. It's one of the reasons why I think looking at the Dow/gold ratio and looking at relative values is super important because we may be looking at the Dow at 150,000 and gold at, again, a three to one ratio, 50,000. You know the high price based on relative value, not nominal pricing in the context of competitive currency devaluation.* * *
Well, you've been listening to the McAlvany Weekly Commentary. I'm Kevin Orrick, along with David McAlvany. You can find us at mcalvany.com and you can call us at 800-525-9556.* * *
This has been the McAlvany Weekly Commentary. The views expressed should not be considered to be a solicitation or a recommendation for your investment portfolio. You should consult a professional financial advisor to assess your suitability for risk and investment. Join us again next week for a new edition of the McAlvany Weekly Commentary.* * *
Kevin: Welcome to the McAlvany Weekly Commentary. I'm Kevin Orrick along with David McAlvany.I have gone back multiple times, Dave, to the webinar that you and Morgan and the other guys gave. And there are some key questions that we continue to receive, like, can gold have a meaningful rise if the consumer doesn't actually enter the market? And, how high do we think gold might go when it does go? Those are questions that you all went into detail on. I'd like to go back and look, during this particular Weekly Commentary, at some of those key moments.David: Kevin, with the Commentary, we're always looking for the appropriate framing and wanting to establish a healthy context so that investors can have a different appreciation for the dynamics that are in the marketplace, and make wise decisions. It would be easy to get lost in one month, two months, three months of market volatility and forget the bigger picture. And so, just as a review, to look at regime shift, some of the most significant regime shifts in our lifetime that are happening now, that will have defined and will continue to define the direction of the gold market in the months and years ahead, I think that review is helpful, and the Q&A will be helpful as well.Kevin: Yes, Dave. And this is actually from our McAlvany Wealth Management webinar from a few weeks ago. And for the listener who wants to see more than what we're about to show today, we will put a link to the entire webinar in the comments below.David: The rage today amongst investors, both professional and non, are data centers, are large language models, AI, semiconductors. And as we witnessed with the launch of SpaceX in recent days, the rage is companies that are likely to transform how we vacation on the moon and visit our intergalactic in-laws. These abstractions, enabled by ones and zeros and truly spectacular engineering feats, do have value, but not without reliance on practical physical realities—practical realities like energy, industrial commodities, construction materials, agricultural commodities, precious metals.Today, faith in the abstract may prove to be perfectly legitimate, may even extend to cryptocurrencies and quantum computation. But never forget, never forget that price is what you pay, value is what you get. If you overpay, you are likely to have performance problems with your portfolio. Prices paid for today's most popular investments are a performance problem in the making. Kevin Warsh, the newly elected Fed chair, recently shared that AI, in his opinion, will be the source of the next economic miracle, a miracle of productivity. Maybe he's right. Time will tell. What we are interested in, and we'll spend some time just discussing today, are the perceived fallen angels within the markets, and a particular kind of halo that only those hard asset companies can wear. So, let's dive in.* * *
David: March 29th marked the lows in the equity market. Massive rally at month end and quarter end was spurred by headlines and announcements of the war ending soon, along with massive derivative short covering. US GDP was recovered, has recovered from the fourth quarter slump. We had the government shut down, which left its mark in the fourth quarter, about a half a percent growth, shrinking the full year number to 2.1%. Real Q1 growth has been revised lower to 1.6% with the Atlanta GDP marking the last several months closer to 4%. And last week's GDPNow figure from the Atlanta Fed has shrunk yet again to 2.8%.The White House very enthusiastically points to 5 to 6% GDP growth by year-end. Probably aggressive, in our mind. Bear in mind that the White House uses nominal GDP, which ignores inflation. Thus, the difference between what is reported and projected, they're like nominal versus real.Business investment was massive, has been this year, was setting a record pace last year and we're blowing out those numbers so far this year. So, business investment in Q1 surged to an annualized 8.6%, largely attributable to the AI CapEx arms race. Government spending also very significant, increased by 4.4%. Consumer spending remained anemic at 1.6% growth.The big theme, AI, CapEx spending. No limits budgeting for competitive AI edge, regardless of near-term returns on investment. Near term in that space is years, even 10 to 15 years out. When you combine government spending with business CapEx investment, it's no surprise that GDP as a measure of economic health is as strong as it is. Throw in the wealth effect for good measure as liquidity gets recycled through the economy, through the financial markets and into the economy over and over again, and GDP growth remains positive.The GDP deflater, which is the inflation assumption used in GDP, is not the same as CPI, not the same as PPI or PCE. And in fact lowballs the inflation issue, marking inflation at less than 3%. So frankly, if a more realistic inflation number were used, GDP growth would be closer to zero. Another bump in inflation, and I think we have real GDP in the negative territory. In that context, you're talking about stagflation. What GDP does not reflect is the bifurcation of experiences within the economy. Economists refer to the K-shaped economy, which captures this bifurcation along socioeconomic lines.The upper end of the K is your upper middle and upper classes. They're asset rich, they have buoyant balance sheets, which are enhanced by asset inflation, driven by ample liquidity in the financial markets. And of course this translates into spending numbers. The top 10% of wage earners account for 50% of all consumption—consumption making up nearly 70% of GDP. If you contrast the upper part of the K with the paycheck-to-paycheck crowd, the lower extended leg of the K is feeling the pinch from consumer price inflation without the offsetting increase from stocks and other investments. So, there's no wealth effect for most Americans.For middle America it already feels like recession, and sentiment indicators reflect that very strongly. Again, using a more realistic inflation number reveals that the average American is feeling the pinch. And it explains the University of Michigan sentiment numbers, which are at record lows, below the levels we reached during COVID if you can believe that.Enter the energy shock, and just remember that official inflation statistics were in fact creeping higher prior to the Mideast conflict. But with a reduction of 15 to 20% of global oil supplies, you now have inflation saturating the economy. CPI, PCE, and PPI, the wholesale price inflation index, all reflect higher levels of inflation. And over the last 90 days, the expectation of rate cuts have flipped to rate hikes. 100% probability of a hike by year-end, 67% probability of two hikes by this time next year. If you're watching the rate markets after the Warsh commentary today, the rates markets are expecting higher rates. Inflation brings a host of economic impacts and financial market complications, which will become obvious as the year proceeds. Morgan will discuss Fed monetary policy and bond market implications a little bit later.Not to get off track, inflation is not the only problem the bond market is dealing with. Yes, a 4.2% CPI print, 6.5% PPI print, they're meaningful, particularly for the bottom of the K-shaped economy, but too much supply—this is the big issue—too much supply and waning demand is also pressuring interest rates higher regardless of Fed monetary policy. Bonds face bear market dynamics, which many investors will in fact be surprised by.As for equities, I'll provide a few highlights. In summary, we are negative on the big indices like the S&P, the Dow, and the NASDAQ. This is in stark contrast with hard asset-related equities where we remain very bullish.Breadth in the main indices has narrowed. Only a few names are carrying the indices to new highs, which is never a healthy dynamic. Again, breadth is this [indicator of] how many companies are on the move to the upside. When there's only a few, that's an unhealthy dynamic. 50% of the year-to-date gains in the S&P 500 are from five companies.Valuations are between two and a half to three standard deviations from the mean. And on that basis, expected returns will hug the low single digits going out a decade. We look at the Shiller PE, we look at price to sales, we look at market cap to GDP for those valuation metrics.Examples might be helpful here. The median price to sales for the S&P 500 is 1.6. It currently trades at a very rich three and a half times. Compare that to Nvidia at 20 times; at Palantir, 63 times; or SpaceX at today's pricing of over 110 times price to sales. This is why I suggest that expected future returns based on those valuation metrics will hug the low single digits going out a decade. You are overpaying for those kinds of hype narratives.So what do we like? Hard assets continue to make sense today. We have built that case over recent years. We have built a diversified portfolio of companies that fall into four categories, all a unique expression of the hard asset theme. Global natural resources, infrastructure, precious metals mining companies, and real estate exposures in the form of publicly traded REITs.Each of these categories is like its own portfolio within the total framework—four portfolios in one. In this new cycle, we are witnessing gold as the tip of the spear, leading to further sequential opportunities in hard assets as the markets adjust to regime change.The studies we've undertaken and the portfolio allocations we're pursuing are gaining traction. As they gain traction, they also gain an audience. As the audience grows and capital begins to flow, positions that we are squarely in are positioned for growth. From a Goldman Sachs report released March 24th of this year titled "The HALO Effect: Heavy Assets, Low Obsolescence in the AI Era," I quote, "After more than a decade of under‑investment, Goldman Sachs Research analysts believe that higher real yields, geopolitical fragmentation, and supply chain rewiring have shifted equity leadership back toward tangible productive assets. They introduce the HALO framework—Heavy Assets, Low Obsolescence—to identify companies that are less exposed to technological obsolescence."So, now we have an acronym: HALO. Goldman and others are concluding in 2026 what has been in our minds for some time. While hard assets, or heavy assets, as Goldman likes to call them, are fresh on the minds of investors concerned about the implications of AI, we arrived at the same conclusion for a different set of reasons.AI is one more buttress for our argument. Hard assets are capital-intensive. Hard assets have low obsolescence. Hard assets rest in the middle of a scarcity bullseye. Hard assets provide resilience and are of great strategic value. Hard assets are on the diversification path for investors wanting to move from crowded tech, called capital-light trades, to a capital-heavy undercrowded domain.Commodities are breaking away from a floor-pinned position and rising in relative value to the popular abstractions of our day. Capital-intensive businesses have been on the move for several years, but their performance has been largely obscured from view by the capital-light companies outperforming them with their value tied to abstractions like intellectual property and brands. Examples of Nike and Coca-Cola come to mind, or companies that are selling software as a service and data flow, Microsoft, Adobe, Salesforce, or your leveraged networks and platforms, Airbnb, Uber, and things like that.Our perceived fallen angels have some advantages, which, to many investors, look like disadvantages. Operational complexity, resource scarcity, high sustaining capital requirements, energy and labor intensity, regulatory constraints, massive permitting requirements, long project timelines, all of which, again, most people would see as negatives, but these qualities provide the moats and cyclical advantages we're looking for in a period of rising inflation and rising interest rates.As an example, picture the copper mine built 30 years ago for 1.5 to $2 billion. To replicate that copper mine today might cost 15 to $20 billion, not the domain of a startup company, unless you're SpaceX, of course. This is not new-world stuff. In fact, it's old-world stuff. But guess what the irony is? The new-world stuff still depends on the old world, and that is a sweet revenge. Over time, a replacement is prohibitively expensive, permitting becomes harder, environmental limitations increase, skilled labor, which is very, very blue collar stuff, it's harder to find. And the asset-heavy nature of the companies reprices upward during inflationary regimes.Morgan: Former Treasury Secretary under Presidents Nixon and Ford William E. Simon famously said, "I continue to believe that the American people have a love-hate relationship with inflation. They hate inflation, but love everything that causes it." Now, for the last 50 years, it is the structure of the post-1971 dollar-based global system, or petrodollar system, that's allowed US policymakers to do everything that causes inflation without reaping the full massive inflationary brunt of their policy consequences. But now that post-'71 monetary system is beginning to break down and we believe the Iran war is the latest significant accelerant of that monetary regime change trend. We expect the current conflict with Iran will have deep and long-lasting implications for the post-1971 US dollar-centric global system. And since the war started, we are not alone in that view. The Iran war seems to have been a catalyst for Western media to begin to awaken to the reality of global monetary regime change, and to China's central role in facilitating it.In late March, there was a Bloomberg article titled "Iran War Could Be Making of the Petroyuan, Deutsche Bank Says." Then in early April, Bloomberg Macro Strategist Simon White penned an article titled "Iran War Has Caused Lasting Damage to the US Dollar System." Both articles pointed to very real and growing strains in the post-1971 global US dollar system.Both articles focused on how the Iran conflict could be the catalyst for both erosion in petrodollar dominance and the emergence of a competitive petroyuan, citing media reports that Iran was allowing the passage of ships through the Strait of Hormuz only if oil payments were made in yuan. Furthermore, both articles warned that the erosion in the petrodollar regime could have "significant downstream effects" to the dollar's use in global trade and savings, as well as to the dollar's role as a reserve currency.Also in April, Peter Alexander, CEO of Z-Ben Advisors, a Shanghai-based consulting firm essentially aiming to bridge the information gap between West and East, penned a very important article on Substack titled "China's Killer (Geopolitical) App." In the article, Alexander adds great detail to both the threat of damage to the US dollar system and to the golden origins of the petroyuan.As Alexander put it, "For more than a decade now, the Beltway consensus held that the US dollar system operates as a geostrategic choke point that can be deployed to alter the behavior of other state actors. Books have literally been written on this very topic, and it may have been true for a moment in time.What has yet to be recognized is that, in present day, a US dollar choke point has, in fact, run up against hard limitations on its efficacy. The American move to nakedly weaponize the US dollar system was a message received by Beijing with immediate effect. The risk, no matter how remote, of China being blocked access to SWIFT was existential. A solution was required and the People's Bank of China was tasked with finding a workable alternative.In 2015, that task was completed and the cross-border interbank payment system SIPS officially went live. SIPS conducts all functions—again, via RMB—from messaging to clearing to initial fiat settlement. It also became the first system to seamlessly integrate payment and settlement of the onshore and offshore RMB, CNH and CNY.Perhaps more consequential when it comes to the great power competition, SIPS resides fully outside the New York correspondent banking network. The very parties that sought to apply economic coercion for the purposes of altering unwanted behaviors are now blind.Obviously the introduction of SIPS was meant to directly benefit China. It is now also the case that the network is providing an attractive solution to a host of global south countries in an era where the Trump administration has ratcheted up the deployment of coercive economic and financial tactics as points of leverage.Now, Western critics of the viability of a petroyuan argue that in a global US dollar-dominated system, participants in the SIPS network would be stuck with too much unwanted excess yuan. But there are two important rebuttals to that argument. First, over the last decade plus, China has undeniably become the factory of the world, meaning there is no limit to the menu of offerings foreign nations can purchase from China with yuan. Second, the SIPS network utilizes a gold-based or gold-linked yuan for neutral net settlement in an emerging network often referred to as the Golden Road.As Alexander explains, SIPS is just the payment network. With China's capital account opened via the gold window, any trading partner holding RMB surpluses can directly convert all fiat balances into physical gold. That gold can be held in a Shanghai vault well beyond the reach of America's foreign policy of sanctions and tariffs, as well as the newly opened Hong Kong vault and vaults soon to be expanded into Saudi Arabia, Singapore, Malaysia, and eventually additional hubs plan for Dubai and Russia.And in addition to acting as a neutral reserve asset and facilitating non-dollar trade settlement, the entire China gold complex is also being positioned to act as a substitute for another critical component of the US dollar system. In this new system, gold can replace, at least at the margins, the role of US Treasuries in acting as global collateral. While not as liquid as US Treasuries, the usage of gold as collateral is meant to be levered as a mechanism to support a host of cross-border trade activities, including usage as a financial tool for invoicing of any return trade of physical goods. Beijing has been executing plans for this entire gold settlement solution for the better part of a decade. Its overt objective is mitigating the inherent risk of America's leverage over the US dollar system. The system is functional. It's now operational. And it's now expanding rapidly. More recently, in late May the Financial Times also picked up on the emerging petroyuan story and elaborated on it.In a May 21st article titled "Iran War Open's Golden Window with China's Renminbi," the FT, like Alexander, explicitly tied the rise of the petroyuan to China's SIPS international payment system and its gold link. Furthermore, the FT referred to the Iran war as "proof of concept". According to the FT, "Gold could serve as a neutral asset for countries to recycle excess renminbi into allowing China to maintain capital controls while competing more with the dollar in global trade. China has regulated the Shanghai Gold Exchange with a strict settlement system. Exporters to China can receive payment in yuan and immediately convert excess yuan into gold bars on the Shanghai Gold Exchange International Board without using dollars, but with the security of a neutral asset." Importantly, the FT noted that, since the Iran War, adoption of Beijing's SIPS cross-border payment system is surging to record highs.And as I said before, that the Iran war has provided "proof of concept" for the SIPS system. According to the FT, the average daily value of transactions settled through SIPS hit a record of $135.7 billion equivalent per day in March, as well as a new daily record in April of $150 billion equivalent per day.For perspective, that April daily record would translate to roughly a massive $50 trillion equivalent annual run rate. In short, SIPs adoption is now booming. Now, over the past two months, a popular narrative to explain gold's recent sell-off has emerged. It suggests the war with Iran is fundamentally bearish for gold and that, as a result, the war has catalyzed official sector gold sales. Now it is true that some nations did pare gold holdings in the first quarter. A number of central banks and sovereign wealth funds shed an estimated 115 tons in the first quarter of 2026, but the vast majority of those sales were one-time events mostly attributed to liquidity effects stemming from the closure of the Strait of Hormuz.Those sales, combined with the negative price action, raised concerns about institutions' appetite for gold and their interest in continuing the dedollarization trend. But a Bloomberg report may fully dismantle that gold-negative narrative, as in reality, even net of previously mentioned gold sales, Q1 net central bank purchases totaled 244 tons, up from 208 tons in the previous quarter, marking the fastest pace of central bank gold buying in almost two years.Again, the 244 tons was a net purchase number. It includes the 115 tons of one-time Hormuz-related gold sales. The red extension line on this slide displays the actual 359 tons of Q1 central bank gold buying if you adjust out one-time Hormuz-related sales. And after adjustment, Q1 was essentially tied for the third-largest quarter of central bank gold purchases on record. And in MWM's view, it's no mistake that such a strong quarter of central bank gold purchases occurred alongside record-breaking levels of average daily values of SIPS network transactions.In short, the Iran war didn't launch the SIPS gold-based petroyuan, but is proving what the FT called a proof of concept. And it is proving to be the catalyst for a dramatic acceleration of the global recognition and adoption of the SIPS gold-based petroyuan. In sum, the non-dollar energy and commodity trading system that net settles surpluses into gold that former Goldman Sachs Head of Commodity Research Jeff Currie first described as gold recycling replacing dollar recycling two years ago continues to gain notable traction in the East and growing awareness in Western financial and media circles.In MWM's view, when gold's technical correction ends, the next leg of the gold bull market is likely to be greatly enhanced by the growing recognition among Western investors of global monetary regime change dynamics.With Kevin Warsh and the Fed facing a bond market crisis while their policy hands are tied, and the gold-based rails of an alternative non-dollar global system beginning to hit its stride, MWM is confident that we don't have to wait long for the gold bull market to shake off the ongoing technical correction and resume trend to new all time highs and beyond.David: I'll start with, "If the Fed increases rates and takes a more responsible fiscal policy, what does that mean for the gold price?" Morgan, you hit that squarely in your comments, but perhaps you could reiterate the standard assumption and what we've discussed in-house in terms of the Summers-Barsky thesis, how it would behave under one set of circumstances and why this time is different.Morgan: So basically Summers-Barsky is talking about gold basically moves inversely to real rates. So higher real rates makes gold less attractive and negative real rates makes gold attractive. But in our view, that dynamic is only fit for a healthy system. And I think we're far from a healthy system. So as I said in my presentation, I'm definitely of the mind that they may be able to hike interest rates 25 basis points, maybe 50 basis points, and maybe for a period of time. But we're at that point where the negative impact to the deficit via interest expense adding into government expenses and growing as fast as it is and ballooning as much as it has, you're talking about putting a debt spiral into motion if you allow real rates to go higher for longer.So I think those days are done, and I don't think they can— Part of the question was, I believe, is if they get more austerity in their fiscal policy. And that's also problematic for them because for one thing we're increasing defense spending, not cutting it—dramatically in fact, the plan is.And then we're not going to cut entitlements for political reasons. And also we aren't going to cut spending really because if we did at this point, government spending is such a large part of GDP that you would very likely trigger a recession. A recession means lower tax receipts. The stock market falling means the capital gains taxes drop. And again, that just feeds into the circular nature of the debt spiral dynamic. So I don't think there's really— I mean, I think practically speaking there is the cap yields and inflate your way out of this, is practically speaking what we're ultimately dealing with.David: The next question I'll take. "What does the price of gold look like in the future if retail investors do not participate in gold in a meaningful way even as government debt levels increase, the economy suffers, inflation interest rates remain at current levels or even increase?"I think the best analog for that is what we've witnessed from 2022 through 2025, where we basically had a $2,000 increase in the price of gold with virtually no participation from the general public. You could argue, and if you look at ETF statistics, there was a significant uptick in retail demand from the middle part of 2025 through the end of last year and into the beginning of this year. So retail did show up. But if you wanted to know what the price of gold looked like without the retail investor, central bank demand has been absolutely critical to driving the price. That 2,000 point move higher from 1,650, 1,800 to over 4,000 an ounce, largely attributable to central banks doubling their purchases from a run rate which was 500 tons per year and has been averaging at or above 1,000 tons a year since 2022.Central bank demand is not a forever thing, but we do see that continuing over the next several years. Morgan illustrated what the motivation would be from the standpoint of—well, I just mentioned from the standpoint of reserve management and what central banks want as a denomination for their reserves. And Morgan hit on how gold demand would be very central to a system of trade which does not settle in dollars and does not promote recycling of trade dollars or petrodollars into the US Treasury market. So that alternative system is yet another source, which is trade related, not retail or investor related.I do think that retail comes into the gold market at some point. And what we have witnessed in past bull markets in metals—we've been in the metal space for 54 years—and what we've witnessed there and even prior to that, if you wanted to stretch back 50 to 100 years or more, is that retail chases gold when it's afraid of something else. And so if that's volatility in the equity market, if that's volatility in the bond market, safe haven dynamics ultimately kick in. And today you don't see the need for it as people clamor for the newest, shiniest gizmos, gadgets, and solutions via AI.So when those markets turn, if those markets turn, I think retail has a motivation to diversify their own reserves, so to say, and look at it as a safe haven. But the moves in metals are not dependent on retail. I think central banks have defined the floor in gold. Retail will ultimately blow out the ceiling, which is a chapter yet to be written.The next question, "Have you seen the price estimates for gold in July of $20,000 an ounce or $1,500 an ounce for silver?" I have seen those. Of course, being in the metals business for 54 years, we've seen all kinds of projections over time. And what we would suggest is that a Dow/gold ratio of two to one or three to one is very reasonable. And so if you assume the movement of numerator and denominator, both of those things moving toward each other, you could see gold in the range of 15,000 an ounce. 12,000 I think is not unrealistic. 15,000 becomes a high watermark.Perhaps we could see 20, but I think you're beginning to really wonder at that point—at any point higher than that—if the true commentary is not supply and demand, but just reflecting a broken currency like we've seen with the yen. One ounce of gold trades for 750,000 yen. Is that particularly meaningful? Well, it is if your savings are based in yen because you've preserved your purchasing power as the currency has gone through a veritable meat grinder.So at some point prices become irrelevant. It's one of the reasons why I think looking at the Dow/gold ratio and looking at relative values is super important because we may be looking at the Dow at 150,000 and gold at, again, a three to one ratio, 50,000. You know the high price based on relative value, not nominal pricing in the context of competitive currency devaluation.* * *
Well, you've been listening to the McAlvany Weekly Commentary. I'm Kevin Orrick, along with David McAlvany. You can find us at mcalvany.com and you can call us at 800-525-9556.* * *
This has been the McAlvany Weekly Commentary. The views expressed should not be considered to be a solicitation or a recommendation for your investment portfolio. You should consult a professional financial advisor to assess your suitability for risk and investment. Join us again next week for a new edition of the McAlvany Weekly Commentary.
* * *
Kevin: Welcome to the McAlvany Weekly Commentary. I'm Kevin Orrick, along with David McAlvany.David, today reminds me of a book that I have in my library from 1794. It's a celestial navigation book for the French Navy, and it was out of a Paris court—but 1794, that's a critical date, isn't it? I mean, that was the reign of terror that was coming to the conclusion of what occurred back in 1789 on Bastille Day.David: Right. All hell started breaking loose on Bastille Day. This week, my French friends celebrate that day, Bastille Day, 14th of July 1789. And it marks the beginning of the French Revolution, the beginning of a monetary explosion. And for those monetarists in our listening audience, take note. Not only were there fireworks as it related to the money supply—Over the weekend, actually, I got to see an article from Stephen Miran and Nouriel Roubini. They just published a new paper revisiting the importance of money supply—not that I'm recommending it, but in the category of for what it's worth. So 1791, there were 1.5 billion assignats. That's the currency of the time. That's how much was in circulation. Two years later, August 1793, the supply had grown to 4.1 billion. 1795, the year after your book on celestial navigation was published, money supply reached 19.7 billion. And in just five years, the assignat was destroyed.No, this is not simply an indictment of fiat currency. Technically, the assignat was backed by land during this period of time. Land confiscated from the Catholic Church served as what was backing the currency. So apparently, supply matters, money supply that is.Kevin: Heads roll ultimately when you print money, bottom line. I was talking to someone just recently and they were just talking about the prices currently, how high they've gotten to where people are just running out of money before they run out of month. And heads aren't rolling yet, Dave, because we're not really talking about the total destruction of the currency, but we are talking about a direction that ends not well.David: Well, the events of 1789 marked kind of the beginning of the end, but they were preceded by decades of fiscal deterioration. The royal court was overspent. Foreign wars, including support for the 13 American colonies in their struggle for independence from Britain, had drained the French treasury. And as the Foundation for Economic Education describes it, "Governments have an insatiable appetite for the wealth of their subjects." When governments find it impossible to continue raising taxes and borrowing funds, they have invariably turned to printing paper money to finance their growing expenditures. The resulting inflations have often undermined the social fabric, ruined the economy, and sometimes brought revolution and tyranny in their wake. The political economy of the French Revolution is a tragic example of this.Kevin: We read a book years ago. Do you remember Fiat Inflation in France? Remember that book that you had everyone in the office read?David: Sure.Kevin: I joke with you about how interest rates— You'll read a five or six hundred-page book on interest rates or on inflation. It's really not interest rates or inflation that we're interested in. It's humanity, and slavery versus freedom. That's really what we're talking about.David: Yeah. I think a better read if the folks listening today are wanting to see the sociocultural impacts of inflation, Adam Fergusson wrote The Death of Money, and I highly recommend that book. Again, we see a similar fraying of the social fabric today, albeit in its infancy. We have socialism that's gaining popularity. We have populism, which is no longer merely an American phenomenon, but a global one. And I think there's two forces that are driving this: widening wealth inequality on the one hand, and inflation on the other—which always falls disproportionately, falls hardest, on those with the least financial cushion. So when your margin of safety is razor-thin, inflation radicalizes thinking as fear and survival take center stage.Kevin: There's a member of our family, Saturday morning we were talking on the phone, and it broke my heart because she lives up in the northern part of Colorado. It's hot right now, very hot, very dry. She lives in a trailer home, and she said every time her air conditioner comes on, every single time she feels like she's being chased by the devil. And what she's really saying is she can't afford to have her air conditioner run right now in the heat. And why? Why is that? Is it because she didn't save enough money, or is it because the money that she saved didn't save buying power?David: When you go back to Greenspan's paper many decades ago, when he was under the influence of Ayn Rand, "Gold and Economic Freedom," I think he does a marvelous job explaining more of the philosophy of gold and what it represents as a preserver of not only purchasing power but agency and economic freedom.I think one of the things that we forget is that inflation is not merely a monetary event. And so just to play with the monetarists a little bit, it's not merely money that we're counting here. It's the cost to humanity, as you said earlier. And it's the impact that it has squeezing individuals, essentially seizing their time. If you look at savings as a reflection of someone's output, someone's work life, and you take and live beneath your means and set aside savings, and that's an expression of human energy that you can use when you need to, later on.That is you. That is your time. That is your effort bottled up and waiting, a repository of wealth to be utilized when you want it to be utilized. Inflation robs you of that time. Inflation robs you of that economic freedom and flexibility to apply in the future what you've saved in the present. And it's why there's a moral component, to me, Kevin.I think it's one of the reasons why I feel so strongly about what we do in this business, helping people preserve their purchasing power, because it's more than money that's on the table and more than money that's at stake. The IMF is looking at this as a global issue. They revised their forecasts for global inflation from last year's 4.1%—that's in 2025—to 4.7% in 2026. Again, that's the global average. Those projections assumed Middle East tensions would ease and that energy prices would recede.So even during the ceasefire, however, the IMF warned that renewed conflict would drive up global inflation, would damage supply chains, would weigh on financial markets. And of course, maybe they could have foreseen, maybe they did foresee, the end of the ceasefire, and the resumption of the uptrend in energy prices. But this story is not done, not by a long shot.Kevin: You bring up an important point, though, Dave. When we talk about inflation in France in the late 1700s, we're talking about a country. But what you're talking about now with the IMF, we're talking about a worldwide phenomenon. It may not be to the degree of the French inflation, but it's worldwide.David: Yeah, I think these are hardly French Revolution inflation rates of 14% on the first round, 60% on the second, ultimately the destruction of the assignat. By comparison, today's inflation appears modest, yet public sensitivity to inflation is higher than it has been in a generation.Kevin: Well, Dave, you brought up so often liquidity being important. And right now we really are seeing the wealth effect, but it's centered in the AI and the semiconductor bubbles. How long can that last?David: I think the connection between inflation and the AI bubble is that policymakers today are holding onto this notion that productivity gains from AI will make inflation irrelevant. And so, we should not restrict or limit the investment in AI, even if we tempt fate with a bubble, because of the likely benefits.So when the AI bubble finally comes unglued, I don't think anyone's going to be able to claim that it was unforeseen. The AI bubble dynamics have sort of a self-reinforcing impact on liquidity. And so from both a financial stability standpoint, I think this is why you've got the Bank of England, you've got the U.S. Treasury, you get the IMF, even the Bank of Korea, many others have expressed growing concern about current trends becoming unsustainable. Last week it was the Treasury Department who drew comparisons to the AI infrastructure spend and the dot-com bubble.Kevin: Well, that probably means something to you, Dave, because you were really cutting your teeth about 25, 27 years ago as a stockbroker just as the dot-com bubble was blowing up. And now we've got the AI bubble.David: It's particularly memorable for me because that's when I first learned the markets. And in the beginning, every newcomer assumes that headlines drive prices, and I certainly did. I was fortunate enough to learn during a bear market where experience quickly teaches otherwise. And I think with time you discover that headlines rarely drive the markets. Liquidity drives markets. Financial conditions drive markets, monetary policy and fiscal policy. I mean, these are factors that matter because they shape liquidity. So the cost of capital matters, leverage matters. No one told me in 2001 that these were the deeper forces beneath the daily headlines.Kevin: So what you would say is liquidity drives headlines, headlines don't drive liquidity.David: Yeah. Sentiment and trading volumes. I mean, there's many things that you can look at, and there are indications of these underlying factors. Sentiment trading volumes, they reflect the activity made possible by liquidity.Charts are nothing more than a record of capital flows, and sometimes you see optimism and risk-taking. Other times in the charts that you can see fear and risk aversion. Liquidity itself becomes self-reinforcing in both directions.Kevin: I know a lot of people are watching this commentary on YouTube, but it makes me think of the vulnerability that people have when they think that they're getting their information on, let's say, a YouTube channel, which is driven by click bait—headline type of bait. It's not necessarily a measure of what you're talking about, which is financial conditions and liquidity.David: Yeah. Next week I'll be attending an economics conference where one of the panels will examine the forces driving the U.S. economy and whether those forces are sustainable. I'll have a few minutes to make my case, so I can briefly summarize the factors I think I believe matter most. You start with financial conditions. Today they remain incredibly loose, remarkably loose. And as long as they remain loose, you've got upside potential. U.S. equities remain difficult to restrain in the context of very loose financial conditions.So officially, monetary policy is described by Warsh and others at the Fed as neutral, even restrictive. Yet, by almost every market-based measure, policy remains accommodative. Market capitalization relative to GDP, margin debt both nominally and relative to GDP, credit spreads, numerous other indicators all point in the same direction. The threat of tighter policy remains conditional upon a renewed acceleration in inflation. Of course, we got numbers today, which give them plenty of latitude to say, "See? We are winning this fight." So the Fed may be talking tougher on inflation, but actions, I think, at this point are going to matter more than rhetoric.Kevin: I had an economics professor up at CU Denver. His name is John Cochrane. And he said, when you read the headlines, speaking of headlines, he said, just go ahead and write out the opposite because they have to talk one way to do the other. And that was at a time when Volcker was the Federal Reserve chairman. But I always remembered that: opposites. Think in opposites. Whatever they're saying, if they're saying, "Well, we believe in a stronger dollar," maybe look at the other indicators.David: Well, the prevailing argument is that, and this is from Warsh and others, that AI-driven productivity will ultimately contain inflation. We've seen this story before just with other productivity booms. We had the post-war infrastructure boom in the 1950s, personal computer revolution of the 1980s leading to another productivity boom, the internet boom of the 1990s, and now we have AI. Those productivity booms were real. They also occurred during periods of lower declining interest rates. Abundant inexpensive credit was one of the essential ingredients supporting each of those expansions. And this time we may not have that luxury.Kevin: It strikes me though that, yes, those booms were real, but the dollar has lost almost 100% of its buying power throughout those booms. So for them to say that AI is going to be a deflationary effect, or that it's going to, like you said, contain inflation. The booms that we had before, those were fine. And yes, they increased productivity, but they were not deflationary.David: Well, they also haven't quite explained how displacing 30% of the knowledge economy is going to be helpful in terms of driving GDP growth. If the consumer is critical to economic activity, I appreciate somebody being able to work a three and a half day week, but it becomes consequential when 30% of our white collar workforce is out of work. But we'll leave that discussion for another day.For today, CPI decline of four-tenths of a percent brings year-over-year inflation to three and a half percent. This argues for the Fed to continue doing exactly what it has been doing, which is nothing. And if rates remain stable, the rally in risk assets is likely to continue. It's this threat of inflation and the likelihood of higher rates where all of a sudden the liquidity dynamics begin to shift and risk assets suffer. But we've had liquidity tailwinds for some time.Kevin: Let's talk about that because the liquidity tailwinds have been in the tech sector, whether it's AI or whether it's semiconductors. It's a little bit like that plastic where you press the bubble down in one place and the bubble appears somewhere else. So the liquidity is still there, but it's moving, isn't it?David: It is. So we had tailwinds that propelled the Magnificent Seven for the better part of four years. Then came the AI hyperscalers. The narrative for the record books is about AI and now most notably semiconductors. So investor capital has steadily migrated within that technology space from less cyclical businesses to the very most cyclical names in the sector. And I think that alone tells you something about where we are in the cycle.Kevin: Yeah, so let's go there. Cyclicality in certain industries. I mean, obviously straw hats sell better in the summertime. Semiconductors, let's go ahead and talk about the cyclicality of the semiconductor industry.David: Well, we've mentioned this before, and gratitude to Fred Hickey for pointing this out, but 14 different boom and bust cycles within semiconductors since the 1960s. This is not new news. This is old market behavior where you go from insufficient supply, massive price increases, increase in production, oversupply, collapse in prices, and the cycle goes on and on. So semiconductors sit at the furthest end of cyclicality within the tech space. Their fortunes typically depend on corporate and consumer spending. This cycle is different only because hyperscalers have committed extraordinary sums to building out AI infrastructure.Kevin: Basically what we're saying is we're seeing hyperscalers, they had a lot of cash. Now that's been given over to the semiconductor industry. And so, does it go back and forth?David: Doesn't always go both ways. I looked at a chart over the weekend and it illustrated this dynamic perfectly. Hyperscaler free cashflow is beginning to roll over. I shouldn't say beginning to roll over. It's in a massive decline while semiconductor free cashflow has gone parabolic. And it's basically an exchange. One group's cashflow is financing the other group's boom.Kevin: So how long can that last, Dave? I mentioned a couple of weeks ago driving in Arizona, these gigantic buildings. I mean larger than I've ever seen are being built for the AI industry. I mean, how long can we do that?David: As long as data center capacity continues to expand, you've got semiconductor companies that remain the primary beneficiaries. Micron, for example, recently increased its long-term capacity investment plans from 200 billion by the end of 2035 to 250 billion through 2035. And so they're racing against each other to be the most important players. Again, we saw that with the hyperscalers. Now we see it with the semiconductor companies. We had SK Hynix list here in the US to raise additional capital to build out even more capacity in South Korea. But the familiar story of semiconductor cyclicality is, once again, being written well before the eventual price correction.Kevin: So what would be the greatest vulnerability? If a person were looking at the news, what would give them a signal that this might not continue?David: Well, for the semiconductors, it is the hyperscaler capital expenditures. If they start to look at this and say, "I think we have enough," those spending plans have become the primary driver of semiconductor revenue. Again, this is not your normal cycle where you've got corporate spending, consumer spending driving electronic purchases that would ultimately benefit the semiconductors. This is very different. The hyperscalers are investing in data centers, and for as long as that build-out lasts, semiconductors will benefit. Is that two years? Is that 10 years or is it two days? We may have already seen that expire in terms of an opportunity. All it takes is a shift in corporate priorities, too much extrapolation of today's commitments leaves semiconductor shares well over the tips of their skis.Kevin: Well, think about yourself as a business owner. Okay. Right now we're talking about the dream of AI and the things that it's going to do and the productivity that it's going to add. Yet on the bottom line, when you talk about being too forward on your skis, we probably are thinking too far ahead. That might show up in five years, 10 years, 15 or 20, but right now you have to make a profit. So these corporate priorities, if they stop ordering more and more and more AI, then that could be the shift right there.David: I'm trying to remember if it was Facebook. It was one of the Silicon Valley giants talking the other day about what benefits there were from their AI investments and what the costs were. So kind of a very back-of-the-napkin cost-benefit analysis. Cost for token purchases were increasing, basically doubling every 45 days. And so far, annualized profitability benefits somewhere at or below 5%. So you've got this exponential rise in cost, and very little—what the CEO basically said was zero—benefit thus far.So I think if businesses begin demanding measurable profitability from their AI investments instead of simply funding the next wave, or require, how are we going to apply this? What is it going to look like ultimately to benefit the growth of our company? Then hyperscalers will eventually slow capital spending. Less CapEx quickly translates into weaker semiconductor revenues and potentially a brutal repricing for the sector.And it's important because this is where everyone is hanging their hat today. This is where the leveraged bets are being placed. This is where there is so much energy and activity, positivity in the stock market. You flip that, you either have to have a replacement for that enthusiasm—who's going to be the next carrier of the baton?—or the story's over; the narrative has run its course and we enter a bear market.Kevin: So this is different than the everything bubble. The everything bubble a few years ago, everything was going up. At this point, this is pretty concentrated, isn't it?David: Yeah. And I think that's an important distinction. The everything bubble in 2021 lifted virtually every asset class. You had equities, bonds, crypto, meme stocks, you name it. Today's bubble is far more selective. Capital is concentrating into only a handful of sectors. That concentration is itself a symptom of liquidity excess, end-of-cycle expression where as we've talked about breadth, it begins to narrow down to just a few themes, even a few names.I remember a few years ago working with Lila Murphy, and she introduced me to this phrase, "When the ducks are quacking, feed them." And I had never heard that phrase before, but today investors are quacking for memory chips, and so you're getting all kinds of offerings. You've got every ability to speculate and potentially gain money investing in semiconductors. If the ducks are quacking, feed them.So there seems to be no limit to the imagination surrounding companies like SK Hynix, which listed an ADR in the United States last week, raised 26 and a half billion dollars. It was a good haul. Micron, another example. But according to the Financial Times, you've got quarterly profits increasing 15 fold, sector earnings up as much as 19 fold year-over-year, and yet even those spectacular numbers have not prevented semiconductors from correcting sharply in recent weeks.Kevin: So you talk about ducks quacking. If the duck is quacking and it's on a one-to-one bet, okay then that's okay. When the duck stops quacking, you go away. But if the duck's quacking and then stops and you're leveraged, you talk about this being a liquidity situation. Leverage is built into this system dramatically, and the duck may stop quacking, but what happens to margin?David: Yeah, this is fundamentally a liquidity story: what is driving excess in semiconductor investor investments in other small segments of the market? Fundamentally a liquidity story. Investor capital has flowed aggressively towards semiconductors. Margin debt has reached a record. We mentioned this in recent weeks, 1.41 trillion. That's for the month of May. June figures are due shortly. It'll be worth watching whether loose financial conditions continue encouraging additional risk taking, larger allocations to this year's biggest winners. But a contraction in margin debt would be one of the first signs that investors are beginning to question paying peak multiples for these companies. If liquidity starts to drain, then comes forced liquidation quickly becoming sort of the dominant risk.Kevin: So explain the mechanics of margin for those who aren't familiar with that, Dave.David: Yeah. So margin mechanics, a 20% decline in a stock purchased on 50% initial margin reduces your equity to roughly 30%. 30% is the general next threshold for maintenance margin. And so a 20% correction doesn't seem like a big deal, but you may be getting a margin call at that point. 25% correction, you are getting a margin call. And at that point, investors have to either contribute additional capital or sell their positions. So a decline, and then if you don't have the money and you have to sell your position, it forces additional liquidations. You hesitate long enough, and the broker or broker dealer makes the decision for you and liquidates immediately. So forced selling is how corrections become cascades.Kevin: So going through some of the margin types of events that we've seen in the past, Dave, going back, let's say to 1987. 1987 and then the year 2000 when we talk about the dot-com bubble, 2008. Anytime you have that margin debt going the reverse direction, that turns into a major crash, doesn't it?David: Yeah. We've discussed for months, leverage is the critical ingredient in every major market reversal. It fuels exponential gains on the way up, and it accelerates losses on the way down. Now, like valuation or valuation metrics, leverage rarely tells you when to exit. Generally the confidence of bets kind of compounds on itself. But when it begins to reverse, you ignore it at your peril. And so, I would watch the June margin debt numbers with some curiosity. And again, it's just an extension of a growth trend. If we go from 1.4 up to 1.5 or 1.6, we'd be entering into brand new all-time high territory. But if we begin to give up 100 billion, 200 billion in margin debt, you're at risk of a significant decline.Warren Buffett made this memorable point back in 2018. He said, "My partner Charlie says there are only three ways a smart person can go broke, liquor, ladies, and leverage." Now the truth, he said, is that the first two he just added because they started with L. It's leverage.Kevin: It's always leverage.David: It's leverage. Exactly.Kevin: Yeah. But in a bull market—David: It's wonderful.Kevin: Yeah. Liquor, ladies, leverage. Come up with other L words if you want, but—David: Probably lots of things that work well in a bull market. In an emotional bear market, there's a lot of things that don't work. And in a financial bear market, there's a lot of things that don't work. So the mathematics become merciless once prices begin falling. So it's wonderful in a bull market and merciless in a bear market. Consumer margin borrowing is only one form of leverage, and it creates an inherent fragility beneath every extended bull market. Additionally, you have derivatives, which create another layer of leverage. With derivatives, investors routinely obtain 5, 10, 20, even 100 times economic exposure to an underlying asset. These are the instruments that amplify both gains and losses, and are the preferred tools of highly leveraged—what we would sometimes describe as hot money—hedge funds.So as my friend Doug Noland often reminds me, you cannot assume orderly market functioning during a leveraged decline. In other words, the idea of liquid and continuous markets, it's an assumption that works in a bull market, and it comes to pieces in a bear market.Kevin: And you can't trust appearances, can you? Because markets typically look liquid until they're not. It can happen almost overnight. I think of last October, even in the metals market, it was like, wait a second, the interest rate to borrow metal went from what, 1%, 1.5% to 200%?David: Overnight.Kevin: Almost overnight. Yeah.David: Amazing. Yeah. I mean, I think it was a Thursday to Friday. Mid Thursday to the close on Friday, you had those rates. It was stunning. So markets always appear liquid until everyone heads for the exits at the same time. And then there's no one to buy the product you're trying to sell, which is the point.South Korea provides an interesting example. Its equity markets fell 7.4% last week, heavily influenced by Samsung Electronics and SK Hynix, which together now represent roughly 50%—that's five-zero—50% of both stock market capitalization and trading volume in South Korea. The Bank of Korea has expressed increased concern not only about semiconductor concentration—obviously at 50% of market cap somebody's finally paying attention—but also in the growing popularity of leveraged single stock ETFs.So if it's not good enough to get 300% gains in Samsung electronics in a short period of time, let's ramp that up to 600%, 900%, using leverage to get it. And the view of the Bank of Korea is that we're building in fragility which we're not going to be able to manage on the downside. Bloomberg reported one of the lawmakers even proposing de- listing some of those products, arguing that the KOSPI, which is the acronym for the Korean market, has turned into a casino. No doubt it has turned into a casino.Kevin: The crazy thing about that, though, Dave, like you said, it does look liquid until it's not. A lot of times you'll see some of the strongest push to have more leverage happen right at the time that it's actually failing, like what you're starting to see signs of in Korea.David: Yeah. It also appears on corporate balance sheets. We'll get to that in a minute, but the proliferation of these single stock leveraged ETFs, it is in South Korea. It's also in the United States. You get pro shares, you get rec shares, you get leveraged shares. All these companies are preparing to launch additional leveraged products on semiconductors and SK Hynix this week.Again, leverage rarely retreats quietly. It's very damaging on the downside, and it usually takes people by surprise because of how quickly it unwinds. But again, balance sheets, you've got corporations borrowing tens of billions of dollars to finance AI infrastructure. That fundamentally changes corporate risk profiles. It also introduces, again, this layer of fragility into the AI trade. Amazon, who borrowed 37 billion in March, another 25 billion last week, to fund additional data center investment. And as recently as February, the company was spending roughly 90% of free cash flow on AI CapEx, 90% of their free cash flow.And by the end of the first quarter, free cash flow had swung to the negative by $18 billion. Now they're continuing to borrow to build. At what point do you think corporate boards should be saying this might not be a good idea? And right now it is just a blind race for the finish line. If you're going to win, it's going to be a winner-takes-all, and you have to be across the line. Doesn't matter if it's 100 billion, 200 billion. In the case of Micron, 250 billion. Actually with some of the hyperscalers, you're talking about 100, 200 billion per year in CapEx spending.And again, if you don't know how much money these companies are making, they're spending more than they're bringing in. That only works for a short period of time if you're a government because you can inflate away the debt. There's nothing you can do as a corporation. If you're spending more than you're bringing in, ultimately there is a bill that comes due. When is it? That's the only question.Kevin: It's like the guy in Vegas who just wants to win back what he lost last night. It's like, "Hey, can I just borrow 10 bucks? Give me 10 bucks and I think I can win it back."David: Yeah, this is quite a transformation for many of these companies, from abundant cash generation to what amounts to the corporate equivalent of pushing all your chips into the middle of the table.Kevin: In this case, that's a pun intended. Chips, pushing your chips—David: Absolutely.Kevin: —into the middle of the table. Yeah.David: So as we look at the economy, the consumer remains the key to the US economy. We mentioned hyperscalers and AI capital spending because 75% of GDP growth is coming from AI CapEx spending. But ordinarily, it's 68% of economic activity which is coming from—and this is the total measure, not just of growth—but the total measure is coming from the consumer.The average American has spent the past five years absorbing a steady accumulation of inflationary pressures. Personal savings rates have fallen to four, five year lows. Credit card delinquencies are on the rise. And when you check in with the likes of McDonald's, I think Walmart is a pretty good sample for how the lower K in the K-shaped economy is doing. But from McDonald's to Walmart, corporate leadership is increasingly concerned about the middle and lower income consumer.Walmart recently—this is a very interesting note. In the most recent period, their CEO said, "The number of gallons that customers—" They have a big fuel business. "The number of gallons that customers fill up when they come to our fuel stations fell below 10 for the first time since 2022." That is an indication of stress. The lower half of the K-shaped economy, in our opinion, is already in recession. This is me speaking. The upper half remains heavily dependent on appreciating financial assets.But Kevin, I remember being back in college and being like, "I've got 10 bucks in my pocket. I'll fill up what I can in the tank" because I'm out of cash at that point. I mean, that's the behavior of, "I'm broke." If you're like, "I can put in 10 gallons and that's the max. I'm not going to fill the tank." Particularly in the context of higher fuel costs. Most people, if you had the resource, you'd say, "I'm just going to fill up now, fill it to the top because tomorrow it could be a dollar more expensive per gallon."Kevin: Well, and that reminds me of what I was talking about from Saturday morning. Just talking to a family member who said every time the air conditioner comes on, she feels like she's being chased by the devil.David: Yeah.Kevin: People are running out of money. And yet you talk about these hundreds of billions and trillions that are being devoted to this dream. Yes, is AI real? To some degree it is. But as far as the type of money that's showing up there, that's where the liquidity is right now, not in the pockets of the person who can't get 10 gallons of gas.David: Right. So the connection to AI in terms of the viability—the go-forward viability—for the economy is that the upper half remains heavily dependent on their appreciating assets and they continue to spend aggressively. They're holding the consumption part of the economy together very well because of the wealth effect, because asset prices are still very healthy.That shifts, you've got a significant shift in consumer spending, and all of a sudden I'm not sure that there's enough AI CapEx spending that can keep GDP growth positive. So as long as financial conditions stay loose, affluent consumers will continue to support GDP. And as long as AI capital expenditures, which are now estimated to account for that 75% of GDP growth, continue at the current pace, the economy will appear remarkably resilient. But—Kevin: But we have Bastille Day. So let's go ahead and go back to what occurs if inflation continues.David: But if inflation continues to squeeze household incomes while the middle class grows increasingly constrained, Bastille Day becomes more than a historical anniversary. It becomes a reminder of what prolonged inflation can do to the social fabric and ultimately to the political order.It brings me back to the technology cycle. Like the internet boom of the 2000s, a period I experienced firsthand and learned invaluable lessons from, the defining issue is not innovation itself. It's overcapacity. Chinese AI firms, DeepSeek, Zhipu now deliver roughly 95 to 99% of the functionality offered by leading US hyperscalers at roughly one-tenth of the cost. That changes the economics.Are we overbuilding in terms of US capacity? We're trying to be a winner-takes-all when we've already been undercut in terms of margin and the ability to capture market share because they can deliver a comparable product, a virtually comparable product at a fraction of the cost. The American AI trade is beginning to look increasingly vulnerable. And again, this is back to capacity things that I learned during the early 2000s. The American AI trade looks very vulnerable to me, and with it one of the last major pillars supporting both the US economy and today's financial markets.Kevin: So you teach us to ask the right question. See, this is what's amazing to me. If somebody says anything negative right now about AI, it's like, "Oh, well, you must be scared of it. Maybe you haven't used it. Maybe you don't know how valuable it is. Don't you understand? You don't have vision." That's really not the question. The question isn't whether the technology is here and here to stay. It's the over capacity question that we've seen so often, Dave, and we bring up the dot-com boom.The internet is here, and the dotcoms are here. I mean, yes, they stayed, but the bust because of overcapacity back in the year 2000, it took 15 years for the NASDAQ to get back to break-even. I mean, that was a big deal.David: Yeah. It's easy to forget the lost decade. Gold has been, and I believe will remain, the best insurance policy and the best ballast a portfolio can own. I mean, if you think about it, it's like garlic to a vampire. Gold neutralizes a remarkable number of financial threats. It doesn't eliminate volatility, but it provides stability when other assets become increasingly vulnerable to it. I mean, first it starts as a dependency on liquidity and then they become vulnerable because of the lack of liquidity. It doesn't continue forever, and thus follows investor confidence.So I'll close with one final observation. During the past two months, one of our mining positions has been meaningfully added to by insiders. Insider buying has picked up. We don't know where the ultimate lows are until they're well behind us. But looking down the road, I know where I want to be positioned. I want the enduring security of precious metals, and I want the operating leverage of the companies that bring those ounces to market.It was many years ago that my godson gave me a replica of one of the keys to the best deal. And it sits where I see it every day. It reminds me that fiscal mismanagement, monetary expansion, and inflation rarely end as purely financial events. They become cultural events, political events, social events. Currencies lose purchasing power. Societies can lose something far more valuable. So remembering those lessons makes me grateful to own the ounces that I do.* * *
You've been listening to the McAlvany Weekly Commentary. I'm Kevin Orrick, along with David McAlvany. You can find us at mcalvany.com and you can call us at 800-525-9556.* * *
This has been the McAlvany Weekly Commentary. The views expressed should not be considered to be a solicitation or a recommendation for your investment portfolio. You should consult a professional financial advisor to assess your suitability for risk and investment. Join us again next week for a new edition of the McAlvany Weekly Commentary.* * *
Kevin: Welcome to the McAlvany Weekly Commentary. I'm Kevin Orrick, along with David McAlvany.David, my wife reminds me often. She says, "Kev, it's summertime. Don't you remember? You've done this now almost 40 years. You should be able to quiet down because your clients have." So I think there are times when you have to back away and go, "You know, I don't know that we always have to be looking for the next newest thing." And summer is a good time to not do that.David: Summer is typically a quieter season in financial markets, not because there's less happening in the world, but because investors are paying attention to other things. School, families, travel, routines change and vacations replace the trading desks, if you're talking about Wall Street. So pull up a volume chart on almost any major index and you'll see it. Participation fades as summer progresses.Kevin: You know what's interesting, though, you asked me this last night when we were talking. You said, "Kevin, when has been the best time to buy precious metals?" And thinking back, it's like, you're right, June and July, I guess after 40 repetitions, we should probably start learning the patterns. This is really a great time because it is quiet.David: The same seasonal pattern generally applies to precious metals. There've been a few notable exceptions since 2015, if you want to stretch back through that 30 or 40 years. But over the last 30 or 40 years, gold and silver have often drifted through the summer in a period of relative indifference. Markets simply lose mind share to other things.Kevin: Well, yeah, to going out into the pool, maybe swimming in the ocean. What do you think?David: Absolutely. The neighbors are coming over. The grandchildren arrive next week. We'll look at the portfolio after vacation. Those are things that press other things to the periphery. And if you're in Europe, perhaps after vacation, it's not next week, it's next month. August is effectively a national holiday across much of the continent. My colleagues and I long ago learned not to schedule business trips to Paris or Brussels or Hamburg in August. Many of the decision makers simply aren't there.Kevin: Well, and especially in the precious metals markets because these guys go on six-week holiday, it seems, the last part of—well, August to early September, but quiet can change.David: It's quiet until it isn't. And when traders return, volume increases, reactions to headlines become more pronounced, and markets begin to move—and it's not always higher.Kevin: I think about the stock market. It usually gets quiet in the summertime. And then when the fireworks start, it usually is early fall or mid-fall.David: When you have major equity market corrections, and that doesn't happen that often, but off of all time highs, when you have a rollover or a top being put in, it's very common. It's very common that it happens in the fall, and the summer that preceded it was an increase in price on low volume. So historically, some of the largest equity corrections have emerged after low summer volume rallies, and prices continue climbing while participation steadily declines.That leaves markets vulnerable once liquidity returns in the fall, or I should say once participants return and liquidity evaporates. So that pattern has preceded not only the routine 10 to 20% corrections, but several of the major bear markets of the last century.Kevin: It was something that you brought up that when you have these all-time highs, but it's on lower volume, that can sometimes be a signal.David: Current scorecard looks something like this. You've got the Dow Industrials that have pushed to another all time high, but on declining volume. Meanwhile, the Dow transports have yet to confirm with a new high. That leaves a classic Dow theory non-confirmation in place. You generally want to see both of those moving at the same time or confirming each other in the price action. One has moved, the other has not.Breadth, however, has broadened considerably. In recent months, we've talked about how there was such concentration in just a few names, and we've begun to see that spread out a bit, which is healthy. So cap weighted, S&P 500 reached new highs in early June. You've got the equal weighted S&P, which broke to fresh highs on July 2nd. Mid-cap stocks reached new highs on June 30th, both the S&P small cap 600 and the Russell 2000.Again, these are your smaller-share indices, followed with new to all-time highs on July 1st. And you look at Barron's. According to Barron's, small caps just completed their strongest first half in 35 years.Kevin: Well, and that's not [unclear]. I love the fact that you're talking about breadth increasing for at least the short term. That's quite a bit healthier than having everything in the Mag 7.David: Right. You've also got the value line index, posted a new all time high on July 2nd. So a lot of things happening there in the early part of the month. NASDAQ, NASDAQ-100, they peaked in early June and have largely moved sideways since then. Sector leadership is becoming more nuanced. You've got consumer staples. They peaked back in February. Consumer discretionary stocks, they topped in May. An indication that parts of the consumer economy may already be weakening.Healthcare recently registered new highs, financials are approaching new highs. Maybe most encouraging is the S&P 500 advance-decline line, which also reached a new all-time high on July 2nd. Again, that's a measure of breadth, an important statistic because breadth almost always peaks before or alongside major market tops. So over the last month, anticipation has improved as leadership broadened beyond the Mag 7. Capital has rotated to a wider range of stocks.It's a healthier market structure than one driven by only a handful of mega cap technology names.Kevin: So could that be a signal that the market could go higher? I mean, does breadth tell us the direction of a market?David: I think what I would say is that we should look for the advance-decline line. If it turns lower and prices are moving higher, then we've got a significant issue afoot. They both move together, you've got something of a confirmation that higher prices are going to materialize. If the prices move higher, but the advance-decline line doesn't, that would be a telltale that this is a market top. For now, that remains constructive, but it's something to monitor closely.Again, should the advance-decline line begin making lower levels or lower highs while the major averages continue climbing, history suggests the market is approaching a more meaningful top.Kevin: What we've seen in the past is that bubbles have a tendency to move. So you can be in the AI sector for a while, and then it moves to semiconductors. So why don't we look at how that bubble is moving right now?David: Yeah. Well, the big story, the narrative has been AI. Whereas they ran, the question was what's going to feed the beast? And you've got to have the equipment, you've got to have the semiconductors. And the semiconductors were getting squeezed in terms of supply with what was viewed as infinite demand coming from AI. They could charge whatever they wanted. So semiconductors, they inherited the momentum leadership from the Mag 7 and the AI names. The question now becomes whether expectations have become impossible to satisfy.Kevin: Well, and aren't we seeing that this week with Samsung?David: Yeah. Samsung Electronics provided a reminder this week. The company projected roughly an 1800% increase in profits. Again, if you're selling the data centers, you've got the chips, 1800% increase in profits. And yet on the announcement the shares fell 7%, dragging down much of the South Korean market. And so that's what happens when expectations outrun fundamentals.Kevin: And this goes away from value investing and more toward momentum investing. You've talked about the differences in the past. So when you have momentum going into a market, everybody is making money. But when you have momentum shifting and coming back out, it can go away real quick.David: When momentum finally reverses, you get today's eager buyers, they become tomorrow's desperate sellers. So 7% declines have a habit of becoming much larger when positioning has been crowded, and it has been crowded. So does 50 to 75% declines sound like an extreme call at this point? You look at Micron, you look at Western Digital, you look at Sandisk, and you have to wonder if those charts are telling you it's over already. In a period of 10 days, you are 25 to 35% off the all-time highs.And again, you roll the clock back two weeks ago, and if you'd said, "Hey, we could see a 35% decline in these names," you would've been laughed at. And yet in the 10-day period, that much is gone. You duplicate that kind of decline over the next 10 days, you're 50% in less than a month. And that happens with highly cyclical stocks.Kevin: So let's move to the precious metals because I had made the comment, if I was just smart over the last 39 or 40 years, I would put most of the money that I put into the precious metals throughout the year, I would do it right about this time. And you had mentioned the 65-week moving average last week. Let's talk about that because the precious metals may be, could they be finding a floor right now?David: Last week, precious metals quietly found their footing. Gold stabilized just above its 65-week moving average after briefly trading below 4,000 an ounce. Silver likewise held support between 57, $58. It remained above its own 65-week moving average. Among the precious metals miners, the HUI, the Gold Bugs Index successfully tested its 65-week moving average, held above it, while the XAU, another miners index, actually never reached that level during the correction. It held above the 65-week without testing it.Technically, a weekly close above 4,150 in gold and—call it 63 bucks, within a dime's throw of that—would provide encouraging evidence that the correction has ended.Kevin: Okay. So we're talking about the correction ending. How about the resumption of the bull market? Are there some technical numbers that you're looking for?David: A weekly close over the 50-day moving average—a weekly close, which this week would be roughly 4,400 and next week 4365—would be considerably more significant, suggesting that the primary bull market has resumed, setting the stage for a retest of the January highs before year-end. So Michael Oliver, a previous guest of the Commentary, looks for that cross of the 50-day moving average this week or next as the all clear signal.Kevin: Okay. So seasonality is truly in play at this point. Dave, you mentioned the Indian wedding season. That comes up, what is that? Is that in September?David: Yeah, August, September, you've got harvest and in an agrarian, largely agrarian culture with the largest population on the planet, with a cultural predilection to own gold, it matters that we come into what's affectionately known as the love trade. So additional weakness can't be ruled out, but seasonally, time is beginning to favor the metals. We're running out of calendar for the traditional summer lull.And historically, if you're looking at the strongest months of the year in terms of performance, just one month performance, January is a strong month. August, September, November, those are strong months. August and September are usually the strongest months of the year. Three of those four months remain ahead of us.Kevin: Which means that you want to buy in the weak months. You're telling us the strong months, but if you're looking to add to positions, June and July really have been a very, very good time to do that.David: Absolutely.Kevin: So if deploying fresh capital, where would you go right now?David: I think as investors return from vacation over the coming weeks, where are they likely to deploy fresh capital? They're probably going to put it into what has been working. So momentum investors naturally gravitate towards stocks that have made new highs. They believe that they're going to make new highs again. Today, that's largely in the AI space. The challenge, Kevin, I think is that hedge funds are already there. I think you look at those charts, momentum may be breaking down, not continuing up.So AI-related positions amongst hedge funds now represent just shy of 10% of all hedge fund assets. It's one of the highest concentrations on record. So when momentum finally shifts, retail investors won't simply be selling into an empty market. They'll be competing with professional money managers trying to exit the same crowded positions. In some respects, it reminds me of the old campfire joke about outrunning a bear. You don't have to outrun the bear, you just have to outrun the next person.Hedge funds are wearing track shoes. Retail investors are wearing flip-flops. When everyone heads to the exits, I think we know who's going to get eaten by the bear.Kevin: So can you make a prediction as to when the volatility will return? It's kind of quiet right now.David: Yeah, I don't know precisely when volatility returns, but given the current concentration in both AI equities—and going back to the hedge funds for a minute, their huge concentration in Treasury positions. I suspect that the eventual move in volatility will be larger than most investors expect. And so, are we starting that now? Do we have to wait until the end of August? It remains to be seen. But if I were looking for the next major rotation, personally I'd be reducing exposure to crowded AI trades while liquidity is still plentiful, and quietly accumulating precious metals and mining shares while competition remains remarkably limited.Kevin: So you would say, again, you're tending towards value investing, moving away from the momentum trade while things are fairly quiet, and going back into the value side.David: I can't help myself. There is a value investor deep inside me, and I like things when they're cheap and I really don't like chasing things when they're expensive. Momentum investors by contrast will likely require— If you're thinking about the metals, they're going to require some price confirmation first. So should gold begin strengthening into its favorable August seasonal window, that price action could attract an entirely new wave of momentum capital into the precious metals complex.Kevin: Dave, I try to share with clients, and yesterday was another example. When they're buying gold, I try to move them away from looking at price because, to be honest with you, over the last four decades working with the family and working in gold, the reason I get up in the morning really isn't price action at all. The reason I get up in the morning is because there's a preservation aspect to gold that just overpowers everything else. And I think the central banks right now are seeing that. They're not really watching the price, are they? I mean, is China watching the price before they make their next transaction?David: Well, I mean, they've been buying consistently for the last 20 months in a row. So to some degree, if you look at the volume of purchases, it tends to increase with lower prices, but they've been consistent buyers. And I don't think that they're afraid of either marginally higher—and certainly it's more attractive if they're adding with lower—prices. But I don't think that's their primary motivation. I mean, seasonality is a part of the picture for retail investors.I think the underlying demand story for gold, it continues to improve. Central banks are obviously a part of that. Purchases in the month of May, which is the most recently updated statistics, 41 tons of gold in May, another solid month of official sector buying. More impressive, however, were China's import figures. And so obviously, we capture some of the central bank buying—10 tons by the Chinese central bank. But China's total imports for the month, 163 tons of gold during May alone. That brings total imports for the first five months of 2026 to 692 tons. That is a remarkable 76% increase from a year earlier.Kevin: How does that factor into global production every year? What percentage is that?David: It's between 3,000 and 3,500 tons of mine supply each year that gets fed into the market. So you look at the 692 tons that were imported by China in the first five months, you're talking somewhere between 19 and 23% of annual global mine production absorbed by one country in five months. It's more than 22 million ounces quietly migrated from weak hands to strong hands.Kevin: So this goes back to the momentum side of things. The momentum investor is missing that completely.David: Right. Western momentum traders have largely reduced their exposure to gold during the correction. They were buying starting at the mid-year last year, 2025, got very interested as the price action was supportive through January of this year. And if you look at COT statistics, commitment of traders reports, and sentiment statistics, daily sentiment index for gold, and many other measures that would suggest they're gone. The hot money has left. They're not interested.So again, the Western momentum trader, they're out on this correction. Meanwhile, you've got the long-term Chinese buyers that have been accumulating those same ounces at lower prices. That transfer of ownership matters. And when we say it's gone from weak hands to strong hands, these are strong hands that are pretty sticky. They own it, they have it. And I don't know what price they're willing to let go of it, but it's nowhere between here and probably eight or $10,000 an ounce.Kevin: And they're not likely to sell based on a profit. David, I'll never forget April 12th, 2013. It was the one day I said, "Okay, let's go fish at Lake Powell." The head trader and I and a couple of other guys, we were out of the office, and sure enough, there was a bear raid. Merrill Lynch and Goldman Sachs had sold 400 tons, a naked short into the market on a Friday, April 12th. It caused the market to go way down, the gold market. And then Monday it went down further. And what we didn't know was there was a transfer of wealth going on at close to the bottom of the market.David: Right. Well, you go back to 2013, 2014 when the market was breaking down. The ultimate lows were December 2015. But that period, 2013 and 2014, the movement of ETF ounces, so Western liquidations, those gold bars moved to Switzerland for refining to kilo bars, and then final delivery to Shanghai and Hong Kong. Ounces that are today not available. So one major difference between then and now, yes, we still see the migration of ounces from West to East.But one major difference between then and now is the increased appetite for gold in China for very different purposes, for net trade settlement purposes. As more global trade is invoiced in Chinese currency terms, gold is a neutral trade settlement mechanism, has a huge new source of demand. You can see this driven in large part by the migration of trade invoicing. The Chinese are wanting to be paid in their own currency.Trade in Chinese currency, according to the Wall Street Journal, has increased fourfold over the last three years. It now is at 8% of global trade being invoiced in RMB. The US Treasury Department. If you just look at this major shift that these structural dynamics— A part of this has to do with central banks wanting to hold a stable reserve.That's what we saw in 2022 when Russia invaded Ukraine, US Treasury weaponized the dollar, and all of a sudden reserve asset managers said, "We can't just sit in Treasuries. We can't be in the above-ground financial universe where the Treasury can target and take what they want." Instead, when the US Treasury Department chose to weaponize the dollar, the world responded and has responded by making the dollar decreasingly relevant.The dollar is a threat, and gold is increasingly the market's expression of preference in a new order for trade and reserve management, both. But that trade feature is really, I think, significant as you look at the ramp-up for gold demand, not only in Asia, but amongst the trading partners with China in particular.Western investors are not going to appreciate these structural changes until gold is marching towards 10,000 an ounce. And then, I think you'll see the preference for a new monetary regime is obvious and reported by CNBC, discussed by Bloomberg, and the new market reality for the metals.Kevin: Well, and it strikes me that even I and you, our entire adult lifetime, what we've been doing when we buy gold is we've been hedging against the devaluation of what is the complete reserve currency of the world. I mean, the dollar was a 100% reserve currency as far as at least oil was concerned. Even guys like us, Dave, are going to have to start thinking differently because we're not just hedging a world reserve currency and the inflation that comes, but we're actually preparing for a major structural change, something we haven't actually experienced in our lifetime. It's a monetary structural change.David: Yeah, the petrodollar recycling certainly reinforced the dollar's role as a reserve currency. And this is different in this particular chapter where we're talking trade invoicing and the option of using a different currency—manufacturer to the world, their currency. And to avoid volatility or changes in the controlled nature of their currency system, with capital control still very much in place, net settlement in ounces is an elegant solution.So I think we quickly forget the structural changes taking place in the gold market. We can lose track of them and be blinded by short-term price action. Indifference to these major structural changes, it's going to be costly for policymakers, and it's going to be a lost opportunity for Western investors. Those who are seeing the opportunity now, Asian investors, they seem, according to the import numbers, to be paying attention, very much paying attention.Kevin: So as we wrap up, Dave, I know you're trying to relax with the family. I asked you if you're getting much relaxation time in, but between relaxation time for the person who's watching this show, what would you encourage?David: Well, I mean, as summer reaches its end, equity market speculators realize they are too concentrated in themes that are now sputtering. Precious metals may again capture mind share again as they did in late 2025. Until then, pay attention to the markets, but enjoy the pool, enjoy the beach, enjoy the family, the grandkids, buckle up for a very volatile second half of the year.* * *
You've been listening to the McAlvany Weekly Commentary. I'm Kevin Orrick, along with David McAlvany. You can find us at McAlvany.com and you can call us at 800-525-9556.* * *
This has been the McAlvany Weekly Commentary. The views expressed should not be considered to be a solicitation or a recommendation for your investment portfolio. You should consult a professional financial advisor to assess your suitability for risk and investment. Join us again next week for a new edition of the McAlvany Weekly Commentary.* * *
Kevin: Welcome to the McAlvany Weekly Commentary. I'm Kevin Orrick along with David McAlvany.Well, David, you are in a different location than the studio right now. Isn't it nice? I mean, technology we can just talk like we did last night. We had a Talisker and we're looking at each other, what, probably 1200 miles from each other. And today we'd like to talk about the Dow hitting all-time highs.David: Yeah. It's like a redo from COVID. We can still hang out and sip a scotch and have a conversation and here we are today. The Dow reached another all-time high this week, and gold continued to test lower levels. Looking only at nominal prices, you could easily conclude that stocks have been the superior investment over the past quarter century.Kevin: Isn't it amazing though, Dave? The Dow is down 70%, actually, relative to gold. Even with gold's correction, the Dow's down 70% over the last 25 years, but like you said, nominally it may not look like that. So explain the Dow/gold ratio.David: The more important measure is not price. It's relative value. And the Dow-to-gold ratio currently stands at roughly 13-to-1. 25 and a half years ago is approximately 43-to-1.Kevin: I remember that.David: It has gone from 11,300 to more than 52,600. It's a gain of 4.6 times. Its value measured in gold has fallen by nearly 70%. So in real money terms, the Dow has not kept pace. Gold's been the winner. It's been the winning trade for almost two decades—more than two decades. And I think the ratio will continue its long-term compression towards the low-single digits, where it has repeatedly bottomed throughout history.Kevin: You know, you had talked to Pierre Lassonde a couple of years ago and he made a call for the Dow-to-gold ratio to get to about 2-to-1. He also predicted a price, didn't he?David: Yeah. I met him at Jim Grant's conference, the Interest Rate Observer author, and he does a great conference at the Plaza Hotel in New York every fall. And Pierre was a featured speaker there last year. So he suggested that gold could ultimately reach 17,250 an ounce, with the Dow-to-gold ratio compressing to 2-to-1. And whether those exact numbers prove correct, I think that's less important than the framework itself. A 2-to-1 ratio could occur through substantially higher gold prices or lower equity prices or some combination of both. If you just held the Dow constant at prices today, you'd be talking about a 2-to-1 ratio and gold price per ounce at around 26,000 an ounce. So I mean, alternatively Lassonde's 17,250, that gold target would imply a Dow of around 34,500 and those are the numbers that he had in mind roughly one-third below current levels.Kevin: I think it's good to go back and just say the Dow-to-gold, ratio when we've seen gold peaking relative to the Dow, has either been 1-to-1 or 2-to-1 each time. So 1896 when it was first being measured, it was at 1-to-1. 1932, it was at 2-to-1. 1980, it got back to about 1-to-1. And so there's nothing wrong with actually saying that we could see that again, but I think we also want to encourage our clients to be willing to let go of some of their gold when we get to those ratios, because that's a good time to buy stocks.David: Yeah. Regardless of the precise path, long-term gold owners, I think they remain on the favorable side of that relative value trend. And to your point, our hope is that investors will eventually be willing to reduce their gold holdings opportunistically when the ratio reaches those historically attractive levels. Ironically, that will likely be difficult psychologically. So gold's strongest advances have historically coincided with periods of financial stress and economic uncertainty. When that fear is fully reflected in equity markets, buying stocks and selling gold will feel exactly backward, even though history suggests that is the correct long-term decision.Kevin: Well, it's exactly against what your emotions are because at that time stocks will look terrible. But oftentimes I'll talk to some of my clients' stockbrokers and explain the Dow/gold ratio to them. It's amazing, professionals, these guys are in this every day and they have a hard time understanding the underperformance of the Dow relative to gold.David: Comes as a surprise. And I was reminded of this several times over the past month. Two professional money managers that I spoke with expressed genuine surprise when I pointed out that gold has outperformed equities over the last 25 years. To them, what is gold? It's an irrelevant commodity. It's a portfolio afterthought. Their preferred allocations remain private equity, private credit. Today's most popular equity trades, what's ever working is what's at the tip of their tongue. So of course there's extraordinary exceptions in terms of outperformance, even relative to gold. Bitcoin since inception, NVIDIA over the last several years, investors who entered those trades early achieved remarkable returns.Kevin: It's interesting you'd say that, too, though, because gold has been sort of the idiot-proof investment. You just go, "I buy a little bit of gold every two weeks." And I know your dad, we've talked about it for 54 years, your dad would buy usually at the highs, whatever the high was at the time, he would end up buying it and he's done just fine. With bitcoin, yeah, there are guys who got into bitcoin early, but think of how many other investments are out there like bitcoin that people got into early and then they just disappeared. So that's not an idiot-proof investment.David: Right. Well, and as we talked about with last week's guest, the contemplation of buying something really cheap. Then the question is, what was your justification for continuing to hold it? Once you had seen it go up 100%, 300%, 500%, 1,000%, most investors have already hit the exits if they were the adopters. But the experience of the average investor is often very different. Once a compelling narrative becomes widely accepted, prices have already appreciated dramatically, and it's that past performance that begins to attract capital precisely when future returns are becoming less attractive. Momentum becomes the siren song, investors flow in. They just can't say no, but it obviously is at a place where you've got much higher cost basis.Kevin: Well, and a lot of people over the last few years have been buying bitcoin at a higher cost basis.David: Yeah. Michael Saylor, who runs Strategy, the company which was MicroStrategy before the rebrand, they own approximately 847,000 bitcoins. That's [unclear]. But their average purchase price is around 75,000 per bitcoin. Even the largest institutional buyer has accumulated much of its position at prices far above those available to the earliest adopters. And that stands in sharp contrast to the handful of investors who accumulated meaningful positions when bitcoin traded below two bucks. Yeah, I know one gentleman who was buying upwards of $100,000 worth of bitcoin at a 1.50 per bitcoin. He's an early adopter. That's not the Michael Saylor story. He's a little bit late to the game with a cost basis of 75,000 and above.Kevin: It reminds me of some of the stories that you hear with multi-level marketing companies. You see these people get fabulously rich because they told five friends who told five friends, who told five friends, but rarely ever do those companies yield much result for anybody who comes in late.David: It works very well for the first five and then there's everyone else.Kevin: That's right.David: The lesson extends beyond cryptocurrency. Late cycle investors, rarely compound wealth at the same rate as those early entrants. And the same principle applies to richly-valued equity markets. Starting valuations matter, putting money to work in the equity markets today, you are talking about very, very costly investments.Kevin: So, speaking of equities, idiot-proof, let's go back to idiot-proof. You buy gold, but you also watch the ratio, right? The Dow/gold ratio is very simple. Anybody can calculate it. You divide the price of the Dow by the price of an ounce of gold. That's pretty idiot-proof. And as you get close to 1 or 2-to-1, you start saying, "All right, maybe it's a good time to buy some stock."David: Yeah, that's why I like using the Dow-to-gold ratio. It largely removes the need to predict absolute prices. So whether gold really reaches 5,000 an ounce or 15,000 or 50,000, it matters less than its purchasing power relative to productive assets. The ratio provides an objective framework for exchanging one asset for another based on relative value rather than, frankly, what can get involved when you're talking about nominal prices: emotion.Kevin: Well, and we were at 42 or 43-to-1 back 25 years ago. Now we're at 13-to-1, but if we go from 13-to-1 down to 1 or 2-to-1, how much does that compound the amount of stock that you can buy?David: Yeah. It really makes the next leg of the trade the very attractive trade. So a move from today's 13-to-1 ratio to 2-to-1 would increase the number of Dow shares purchasable with the same ounces of gold by roughly 550%. That's a lot more shares. All else being equal, that would imply dramatically higher future dividend income and a much more attractive basis from which to compound your equity returns. So the Dow/gold ratio when it gets to those very attractive levels, you are talking about buying basically trough levels in the Dow, which again allows you to compound growth off of that low basis. And in this case, it would be with 550% more shares, 550% more horsepower, so to say.Kevin: Well, and that can happen with the Dow falling either a lot further than we would expect or it can happen with gold rising. Either way, it doesn't matter because we're looking at a ratio.David: Yeah. It's also worth remembering that Lassonde's illustration assumes only a modest bear market in equities. And you might say, "Well, 34,500, that doesn't sound very modest compared to 52,000. That's a big haircut." But historically, major bear markets have followed the extended bull markets, and we're now 17 years into a bull market. We think it could go considerably deeper. Reference points being 1906 to 1921, the Dow declined roughly 69%. From 1929 to 1932, it was approximately an 81% drawdown. From 1937 to 1949, about 68% loss. And from 1968 to 1982, an approximately 63% loss in nominal terms and nearly 80% after adjusting for inflation. And even the most recent secular bear market from 2000 to 2009 produced a decline of roughly 60%.Kevin: So the moves that we're seeing right now, like with the gold correction since January in gold and silver, those are cyclical moves. And the difference between cyclical and secular, because you used the words, "secular bull market," when we're talking about the Dow/gold ratio, we're talking about secular markets, much longer horizon-markets, right?David: Yeah. Robert Rhea and Richard Russell were very keen on describing the difference between secular trends and cyclical trends like the tide coming in or going out. Tide coming in or going out is the secular trend, and then catching a set of waves is like that cyclical trend. So if you can imagine being a surfer getting out on the ocean, and you're waiting for the perfect set. Well, first of all, you don't go out if the tide is out because there's no waves to catch. So you've got to wait for a favorable macro, larger-picture environment. And I think that's where we see gold in a secular long-term trend, bullish trend. And if you get a short-term cyclical period of time where we're just waiting, we're waiting for the next set of waves. The tide is in.Kevin: So catch a wave on gold right now. I mean, as far as the correction, how far do you think it might go down?David: Yeah, I would say that the tide is in. The waves we wait for, and so we're having to be paddling around, waiting. And your question of how low the price of gold goes, I don't know. Corrections take on a life of their own, just like increases in price take on a life of their own. Sometimes they go too far in either direction.I would say this: you can count the downside in hundreds of dollars, the upside in thousands. And that seems like a pretty good balance in terms of risk versus reward. Yep. You could have a few hundred dollars' downside from here, and you've got a few thousand dollars' upside from here as well. And by few thousand, Lassonde's right, it's more than a few thousand.Kevin: Maybe many thousand.David: Exactly. So will gold retrace 50% of its advance? Will it retrace 61.8%? These are your classic Fibonacci numbers. Deeper correction, does it give back the entire move? No one knows, but we're, again, likely discussing hundreds of dollars, not thousands. And I think, for long-term investors, the more important questions are strategic rather than technical.So do you own enough gold if the global monetary system is entering another period of transition? Do you own enough if the Federal Reserve finds itself constrained between persistent inflation and excessive government debt? Do you own enough relative to historically expensive equity markets? Do you own enough in an environment where inflation remains structurally biased upward? I think those are the questions that matter.Kevin: So we've got Kevin Warsh in now, and so the topic again is interest rates. You've got Trump saying that interest rates have to come down. Kevin Warsh has already said that he's going to try to stabilize the inflation rate. So how does that happen?David: Yeah, this is such a fascinating setup, Kevin, because on the one hand, if we get any weakness in the equity markets, you typically see a move towards bonds and you may well see sort of a snap judgment for a week, a day, what have you, looking for a safe haven. But interest rates are already in a very curious place. They continue to reshape the valuation of virtually every asset class, and whether policymakers would prefer lower rates or not, inflation continues to place upward pressure on long-term yields. Yield curve control may eventually become a part of the policy response, but until then, the long end of the Treasury curve remains the market's best estimate of future inflation-adjusted returns. Today, those real yields remain very compressed.Just go back one year ago. One year ago, real yields ranged from 1.2, 1.3% to upwards of 2.5%, and that's across the entire yield curve. Today they're negative. They're negative out until the seven-year mark. And even if you go out to 30-year Treasuries, they offer only modestly real returns in the 60-to-70 basis-point range.I enjoy following those kinds of long-term trends, a resource that I continue to recommend is Ron Griess's Chart Store. Ron produced charts for Ian McAvity back in the day. He was an early Commentary guest, and he provided those charts for him for many years, and his weekly chart service remains one of the best technical resources available, and much of the yield curve work that I was just discussing comes directly from his weekly chart blog.Kevin: We were talking today with Drew, and Drew's been with the company 40-some-odd years. And he said, "All I know is the 65-week moving average is a safe place always to buy." And that's not predicting a bottom in the market, but down where we're at right now, it seems like this is a good place to add some gold.David: Yeah. When you're in a secular uptrend in the metals market and the price gets to the 65-week moving average, it can go lower. But now you're talking about sort of the rubber band stretching on the downside. There's a natural energy which below the 65 week begins to draw it back up.If you already own enough gold, consider whether there's opportunities to compound those ounces through disciplined ratio trades. Over the last six months, we've completed several successful swaps between gold and silver as relative values shifted. Those opportunities will continue to emerge.This is a great time. Again, if you already own enough ounces, talk to your advisor about what's next, because I think as those opportunities emerge, it's worth looking at your portfolio construction because those critical decisions allow for investors to increase their ounces over time without adding new capital.Kevin: We've talked about pricing things in gold and just being able to see what those ratios are. So we talked about the Dow. We also price silver in gold, but isn't the key, Dave, in life and in investing is knowing what to hold at what time, but it needs to be real. So watching these ratios is a way of eliminating worry about the devaluing dollar because you're not basing it in dollars, you're basing it in other real things.David: Yeah. I mean, ultimately wealth preservation is not simply about owning the right asset. It's about exchanging assets when relative values become extraordinarily favorable. The right asset to own is always changing. Well, I take that back. I think gold has never been the wrong asset. The question would be appropriate proportions within a portfolio. We mentioned Richard Russell earlier, and I grew up reading the Dow Theory Letter, and he would often refer to the sort of benchmark for high-net-worth or ultra-high-net-worth families. Everyone should have 3,000 ounces of gold. Now, at 4,000 an ounce today, that's a lot of money, but he was having this conversation when gold was $300 an ounce, and it was just, yeah, it was a ballast asset as a store of value. I think there is an aspect in which gold is always the right asset to own, but there are opportunities when its current market value makes sense to trim it back and migrate it over.We're not there today, but what we're talking about with the Dow/gold ratio is anticipatory. It's in anticipation of making that kind of move, and I think that's still a few years out, but I think we'll get there relatively quickly.Kevin: Well, and we have to keep in mind we're of the generation where the dollar was the reserve currency, bar none. And at this point, what we're seeing is an unofficial reassertion of the gold standard. So what are the trends that you're seeing right now that would continue this secular trend for quite a while?David: Yeah. Two themes stood out to me this week. The first was the growing problem of global economic imbalances. And the second was how those imbalances are accelerating the search for a new international trade settlement system. So we sometimes think about the role that gold plays as a reserve asset amongst central banks, or even for individual investors, that it is their own reserve asset. They can be their own central bank, so to say. But this is a little bit different. This is not just reserves to have sort of a rainy-day fund at the national level, or like you might for your own family. This is a means of playing a different game within the trade system. Michael Pettis consistently provides one of the clearest analyses of the Chinese economy. In his latest essay, he examines China's persistent trade surplus and the unavoidable arithmetic that they impose on the rest of the world.And what he's getting at is that when one country makes a policy choice, it actually forces a policy choice onto other countries as well. One country's surplus necessarily becomes another country's deficit. So China's trade surpluses are enormous, and it corresponds to deficits in other countries. So, roughly $280 billion of surplus with the United States, a combined 360 billion with the European Union, 115 billion with India, 100 billion with Vietnam. And the pattern repeats across much of the global economy.Kevin: But this is a policy decision, Dave, isn't it? I mean, China wants to run surpluses, and it forces everyone else into a deficit.David: That's right. These imbalances are not accidental. They are the result of deliberate policy choices. Beijing has consistently prioritized investment in manufacturing over household consumption, and that ensures that China remains the world's dominant industrial producer. So capital flows into factories rather than towards consumers or various social safety nets which favor households, and that increasing production capacity ends up suppressing domestic demand. The consequence is predictable. You've got surplus production, and it has to be exported abroad. Any surprise that the countries that I just listed have massive trade deficits.Kevin: Right. And so you've heard Trump basically say, we need to bring manufacturing back, but the entire world economy has been reshaped over the last 40 years.David: Yeah. And I think the exports from China have reshaped the global economy. Cheap products—often subsidized Chinese manufacturing—have reinforced dependence on imported goods, and that has steadily eroded competitiveness of domestic manufacturing in the United States and Europe and many emerging economies. This is frequently described as the outcome of free markets, but I think that characterization is really incomplete. Markets cannot be considered fully free when production is heavily influenced by state subsidies, by directed credit, by industrial policy.Kevin: Again, this is a policy decision, like you said, industrial policy.David: Right. What we do see is that Trump and Bessent are working that back, and would like to, if you want to put it in terms of capturing more export market share, you can, but really it's of a strategic nature in terms of onshoring and bringing back manufacturing to the United States.Pettis argues that economic imbalances are fundamentally the result of policy choices. So one country's domestic policy inevitably creates external consequences for its trading partners. China's decision to promote production over consumption has effectively become the industrial policy of much of the developed world. So every Chinese trade surplus requires a corresponding deficit elsewhere. As China exports excess production, other countries import both the goods and the hollowing out of their own manufacturing sectors.Where that becomes critical, think about post conflict with Iran. Kevin, you might recall that we were talking about Department of Defense papers that were published a year, two years ago with a growing concern that we didn't have the ability to replace our own munitions, that there were strategic critical minerals which are only processed in China. And so, to be able to integrate those into the supply chain was already a concern.Now, post the Iran conflict, we've gone through a lot of munitions. How do we replace them? We're talking about a five to seven-year cycle to replace what was just spent, and there is this unhealthy dependence. So, the critical nature of onshoring, it is one of security, national security, and it's something that is not lost on the White House. It is not lost on Scott Bessent. And so, the imperative to onshore, very much there.What that means is that we're making a policy choice that runs at odds with the policy choices of the Chinese, and how are those going to balance each other out? Do they cancel each other? Not really, but they're in direct conflict.Kevin: It reminds me, I remember when I was a kid we were visiting an aunt and an uncle in another state, and I was down in the basement. And the first time I watched Frankenstein, it scared me to death because it was like, "Oh my gosh, he created something that's now on a killing spree." I remember I was a very little kid, and it was not a familiar environment. So, the whole thing was perfect. I'm glad it happened that way because I still thrill at that. But I remember when Nixon went to China, I was a kid. I was about 10 or 11 years old when Nixon went to China. Don't we take the blame a little bit for this reshaping this whole surplus deficit thing? We probably helped design it.David: Yeah. I mean, the irony is that the West helped create the system. 25 years ago the United States and Europe enthusiastically shifted productive capacity to China after China entry into the World Trade Organization. And this was some combination of labor arbitrage, which improved corporate margins. It lowered consumer prices. It boosted multinational profits. And so, of course, corporate America and corporate Europe, they were all over it. They loved it. The Berlin Wall fell, and it set in motion a series of daisy chain events, which led to this great opportunity and caused this boom, a massive boom. At the time, the arrangement appeared mutually beneficial.And at the time, we weren't considering China as a chief competitor, but what has changed in 25 years, now they very much are. And so, today those efficiencies increasingly look like strategic vulnerabilities.Kevin: Yeah. And so, Scott Bessent is saying we need to change that.David: Yeah. Recently summarized what the G7 now broadly recognizes as three interconnected global imbalances, and they play very well into Michael Pettis's comment about these massive global imbalances. Chronic under-consumption in China is one, inefficient productive investment in Europe, and unsustainable fiscal deficits in the United States. These are three things that have to be resolved, and each imbalance reinforces the others. So, China needs a larger consumer economy, but will they do anything? I mean, we've been talking about that. In fact, we've been talking about rebalancing the Chinese economy directly with Michael Pettis.I remember doing an interview with him in China, and he's been on the Commentary a couple of times. That's been a theme that we've been discussing for 15 years, and the consumption share of GDP has not budged in that time frame. China still needs a larger consumer economy. Europe needs to rebuild its productive capacity, as does the United States because of these strategic vulnerabilities. The United States must restore fiscal discipline while rebuilding critical industries at home.Kevin: But as China's grown larger, the one thing that has shifted is our trust. I mean, you talked about vulnerabilities. We're now vulnerable even for our own defense to China.David: Yeah. I mean, underlying all of this is a deeper shift in the basis of trust. Within the global trading system, there's distrust of the US dollar as it has been demonstrated as a weapon in the modern world. The United States increasingly views excessive dependence on Chinese manufacturing not simply as an economic issue, but as a national security risk. Critical supply chain, strategic industries, essential technologies, they can no longer be evaluated solely on the basis of cost. So, again, when we built the system, post-WTO or the inclusion of China into the WTO, it was with the idea of labor arbitrage and improved margins and a better cost for goods delivered. It just seemed to make sense.Kevin: But the Frankenstein grew, and now we're having to deal with the Frankenstein.David: Yeah, it's a different monster. So, that is the fundamental objective behind the Trump administration's trade agenda. They've got tariffs, they've got reshoring, they've got industrial policy, which are all attempts to reduce strategic dependence on China and restore domestic productive capacity. Whether those policies ultimately succeed is an open question, but the diagnosis is becoming increasingly difficult to dispute. The global trading system that emerged over the past quarter-century produced efficiencies, but it also created structural imbalances and strategic dependencies that are now proving increasingly difficult to sustain.Kevin: Yeah. So, Scott Bessent is basically expressing what the Trump administration plan is. And you have, I think, a quote from Bessent that's probably worth reading just so that we can discuss it afterwards.David: It's a long quote, but it comes from his presentation to the Economics Club of New York, and it really gives you a sense for what they're after, which I think is very, very important.He says:Kevin: But, in summary, global trade has to be balanced somehow, and with China running the surpluses that they're running, how does that factor in for gold? Let's go ahead and talk about how this unofficial reassertion of the gold standard has something to do with this.David: Yeah. Balancing global trade is essential. Reducing America's dependence on Chinese imports is essential. And while Treasury Secretary Scott Bessent and Michael Pettis, they approach the problem from very different perspectives, I think both ultimately recognize that the global economy requires a significant rebalancing. So, from Pettis's perspective, failure to rebalance leaves the world vulnerable to an increasingly destabilizing Chinese debt crisis. Their debt to GDP numbers are now second highest in the world. I think my concern is somewhat different.Rebalancing the US trade deficit is a strategic necessity, and that does require reshoring production, rebuilding industrial capacity, restoring supply chain resilience. The difficulty is that we're attempting this transition with roughly 40 trillion in debt. So, you go back to Bessent's comment earlier: among these benefits of leadership are lower borrowing costs. Maybe, but I mean, what they're asking is for the Federal Reserve to lower them now. Don't make the mistake of your predecessor. Get rates down now. Lower rates are good for everybody. Get it done now.And I'm not sure that that's entirely the case. It may be good for asset prices. It may be good for the wealthy you have fat balance sheets and lots of assets to grow in that context, but lowering interest rates when you have inflation in the mix is a dangerous, dangerous thing specifically for American households.Kevin: So, if you're between a rock and a hard place, is there a rabbit that they could pull out of their hat, something that we're not really planning on because you've got high deficits, we can't have a strong currency and bring manufacturing back. What would be the magic cure?David: Yeah. I mean, again, this is where it gets tricky. 40 trillion in federal debt, rising interest rates, an ever-growing interest burden that increasingly impedes fiscal flexibility, that makes industrial policy extraordinarily difficult, perhaps possible without a meaningful improvement in productivity. And so, waiting in the wings, the explanation for this massive improvement in productivity both from Bessent and Kevin Warsh, is that artificial intelligence—Kevin: Ah, that's going to cure it.David: So, if AI produces a sustained productivity boom, the economy could grow faster. We don't have to worry about reigniting inflation. And in that case, we will reshore, we'll reindustrialize. All of that becomes achievable. It remains a plausible, but I think a far from certain, outcome.Kevin: So, if that doesn't happen, where are we as far as this balance of payments? Because we've talked about how the dollar recycling has turned into gold recycling, and it has something to do with this.David: Yeah. I mean, what seems much less debatable is that today's global economic imbalances are approaching a breaking point. And it's difficult to identify another major government attempting to address those imbalances as directly as the Trump administration. Reading through Pettis's article, he basically said the Chinese officials are saying it's not their problem and it's not their policy choice that's causing these imbalances. It's US consumers consuming too much. The US consumer is consuming too much of what? Chinese goods. Other things too, but I mean, it's one thing to push the blame away. I think this is again where you see the Chinese are not addressing this issue head on.The Trump administration, for all its foibles and frailties, for all the things that you can throw at them in terms of criticisms, they are directly trying to address the imbalances. I think it's a low probability event that it works. Its strategy so far has relied on tariffs to alter trade incentives. Simultaneously, they're seeking greater control over strategic natural resources. It certainly was a part of the play in Venezuela, might have been a part of the play in Iran—if not control, then influence.I think that Trump and Bessent appear to believe that lower interest rates would materially improve the chances of implementation of their industrial policy.So cheaper capital reduces financing costs for manufacturing investment. It eases the government's own debt burden. Everything can be done with cheap money.Kevin: Yeah, but cheap money is inflation. How do they do this without higher inflation?David: Right. And that's the question. Do you add fuel to the inflationism fire at this stage in a market cycle, and what risks are you taking in doing so? Whatever good is felt, whatever benefit is dealt out from an increase in asset prices, we're already in bubble territory. And in some segments of the financial markets, you could describe it as a super bubble.Kevin: So you lower interest rates in this environment, Dave. How do they do that?David: Yeah. The challenge is that pursuing lower rates during a period of persistent inflation, that's the dangerous part, because unquestionably it's supportive of asset prices, but it risks undermining inflation credibility.And this is where I don't know that Bessent and Trump are going to get what they want from the new Warsh leadership at the Federal Reserve. Listening to Kevin Warsh last week, one could reasonably conclude that preserving the Federal Reserve's credibility on inflation is his foremost priority.If that's correct, Bessent and Trump may not ultimately receive the monetary policy support that they're hoping for. And I think they probably need that monetary policy support to have an odds-on chance of winning in terms of their policy implementation.Kevin: So let's talk about the increase of the use of the yuan over the last few years. I mean, 15 years ago, world trade, cross border trade with China was zero in yuan. They just had their own currency within their own country.Now I think it's up to about 8%, which, what is that? A 4X increase from what it was just a couple of years ago. Petrodollar, the same thing. The dollar used to buy all the oil. Now, what is it? About 20 or 25% of the transactions are in other currencies with oil. So how does that affect it?David: Yeah. There was an interesting article from the Financial Times this last week titled "Why Sinodollars Outweigh the Petroyuan." And they're making the case that, look, we're not going to see the same kind of thing that happened with the US dollar becoming the petrodollar. It's not going to replace the US currency as the reserve currency. The authors contend that China's persistent trade surpluses prevent the renminbi from becoming a true reserve currency.And so under the logic of Triffin's dilemma, reserve currency issuers must supply liquidity to the world by running persistent trade deficits. And that's something that China has consistently refused to do. The policy choice was surpluses. You can't be a reserve currency unless you're running deficits. That's the old Triffin dilemma logic.Kevin: Okay. But bring in Jeff Curry, because this brings the gold side of it in it. They can actually continue to run surpluses and do international trade with the yuan if it can be converted to a neutral currency like gold.David: Yeah. So there is an appeal to being able to dismiss the Chinese currency as running in competition with the US dollar—the loss of hegemony and the dedollarization trade and the concerns around the dollar losing reserve currency status and what does that mean for US investors and consumers?If you look at the reserve currency through a different lens, there is a possibility, and I think this is what Jeff Curry was getting at. Gold recycling allows for a neutral reserve asset in the settlement of trade, and it does not have to be recycled into whether it's the US dollar or in this case into the yuan or RMB, which would increase the value of their currency and make them less trade-competitive. So today somewhere between a third and half of China's exports are settled in renminbi.That creates what the Times article was describing as sinodollars.Conventional assumption is that the renminbi serves as the natural repository for China's trade surpluses. Yet Beijing's capital controls and exchange rate management make the currency poorly suited to becoming the world's dominant reserve asset.They need to keep a lid on the value, and where gold enters the equation, I think, is where it gets very interesting. Rather than forcing China to abandon its surplus-driven economic model, excess trade balances could increasingly be recycled into gold.Net trade imbalances could then be settled in ounces of gold rather than through continual accumulation of dollars or a broad internationalization of the renminbi.Kevin: So basically that's the cure for Triffin's dilemma with China.David: Yeah. A framework like that would allow for China to maintain its export surplus without placing sustained upward pressure on its own currency.At the same time, it would gradually reduce reliance on the dollar as the world's sole settlement asset. So this suggests kind of an intriguing possibility. Diminishing the dollar's role in global trade—again, we think about gold as a reserve asset, but this is really thinking about currencies and the trade functionality—diminish the dollar's role in global trade does not necessarily require the renminbi to replace it one for one. Instead, a growing share of net settlement could migrate to gold reserves held by trading partners. In that framework, gold functions not as a currency but as the neutral reserve asset that clears persistent imbalances between nations.Kevin: Yeah. So it's an exchange out of the currency. So when a country's paid in yuan or renminbi, it can be exchanged then for gold, and then it becomes an internationally traded currency just like the dollar was—where the dollar was for decades.David: Without creating undue pressure on the currency itself, requiring extreme manipulation to keep a lid on it and not requiring them to compromise on their policy choice to run persistent surpluses.So the question worth asking is whether China is in effect attempting to solve Triffin's dilemma, not by internationalizing the renminbi, but by increasingly using gold as the ultimate settlement mechanism.So the gold story is still being written. When we think about current volatility, these are massive structural shifts in not only the world of reserves but also the world of trade. And this story has a lot longer and a lot farther to go, driven by reserve dynamics, driven by trade dynamics, driven by financial market dynamics, public policy dynamics, but both here in the United States and abroad.Kevin: You know, Dave, before we finish up today, we are at our country's 250th anniversary, and it's an amazing country. You were telling us a story this morning, just talking to your family, and encouraging all of us to tell the story of this amazing country.So you and I talk often about various things that might be vulnerabilities in this country, but there's still nothing like this in the world, is there?David: We're celebrating the 250th year for our country. This is a special week, a unique 4th of July. I think the enduring legacy of the United States is not simply that over that 250-year period it became the world's largest economy, or it became the issuer of the reserve currency to the world. Its greatest legacy has been that the creation of an institutional framework that consistently transformed freedom into opportunity.For those who think we have an immigration problem, who wouldn't want to be here?Kevin: Right.David: There is a reason people want to be here and not someplace else. Has there ever been a place at any time in history that has harnessed the ability of ordinary people to create extraordinary wealth and promote human flourishing?You can look at other periods in history and there was vast wealth, but it was not the ordinary person who had opportunity. It was only the well-connected.Kevin: It was royalty and family names. Yeah.David: Throughout our history, it's immigrants, it's entrepreneurs, it's inventors, it's investors. They have all found a country where success depended less on family lineage than on talent and on hard work, willingness to take risk.And I think behind that, the deeper legacy is a society that combined liberty, property rights, entrepreneurship, scientific curiosity, relatively open markets in an extraordinarily powerful engine for human growth.Kevin: And there was a deeper, deeper philosophical backbone to this country that had to do with values and goodness.David: Yeah. I think that's where sometimes, whether it's in the Commentary or just in conversations reflecting on what was versus what is. Today we could look at this as an era of fiscal deficits. We can focus on political polarization. There is clearly declining trust in institutions. There's a growing sense of entitlement.I think it's easy to forget or to overlook what has made us great as a nation. My dad used to quote, I think it was Aleksandr Solzhenitsyn, and the quote with something like this, "America is great because she's good. And if America ever ceases to be good, America will cease to be great."So, to our deepest legacy, we see it is based on values which have dignified every person, uplifted the downtrodden, protected the innocent and the vulnerable, and our greatness stems from values which, if forgotten, if neglected, will write the last chapter as tragedy.And if they're remembered, if they're elevated, if our stories are told, we'll extend our story another hundred years or 250 years.Kevin: Yeah. So happy 250th.David: Happy 250th. God bless America, land of the free, home of the brave. I'm grateful to have been born here.In my remarks before the Economic Club of Dallas, I detailed how the structural vulnerabilities that we allowed to accumulate over time precipitated a drift into dependence. And last month I noted that under President Trump America has awoken to the risks that we can no longer ignore and is now attuned to the responsibilities we can no longer neglect.
So, tonight, I would like to take the next step and describe our strategy for economic statecraft, by which I mean the disciplined use of America's economic power in service of our sovereignty. We opened a market because it helped to create a more prosperous world, and we tolerated imbalances because American economic strength appeared unassailable.
Over time, however, these choices hardened into habits, habits into assumptions, and assumptions left unexamined into vulnerabilities. We came to believe that access to the American market could be extended without condition and therefore without consequence, and to repair those imbalances with the world is not to retreat from it.
On the contrary, it is to engage on terms that make America stronger. It is to insist on trade that is fair, reciprocal, and consistent with our national interest, and it is to more closely bind what we should have never allowed to cleave our economic and national security.
So, tonight, guided by those priorities, I want to organize our approach to economic statecraft under President Trump into five core principles.
The first is that economic security begins with national capacity. The nation that depends on its adversaries for critical inputs is not truly sovereign, and the nation that reduces its economics to consumption is not truly prosperous.
The second principle is that America's openness will be matched by reciprocity, which is the basis of durable cooperation.
The third principle is that America will write the rules of the next economy.
The fourth principle is that our financial leadership is a central instrument of statecraft. Of course, that leadership role bestows enormous advantages, among them lower borrowing costs, deeper capital markets, enhanced sanctions capabilities, and great influence across the global financial system.
The fifth and most important principle is that economic statecraft must serve the American people. The purpose of American economic statecraft is to connect national power with household prosperity.
* * *
You've been listening to the McAlvany Weekly Commentary. I'm Kevin Orrick along with David McAlvany.You can find us at mcalvany.com and you can call us at 800-525-9556.* * *
This has been the McAlvany Weekly Commentary. The views expressed should not be considered to be a solicitation or a recommendation for your investment portfolio. You should consult a professional financial advisor to assess your suitability for risk and investment. Join us again next week for a new edition of the McAlvany Weekly Commentary. Dave Allman began learning about money at age 11 while working summers on the Boardwalk in Atlantic City, New Jersey. At 19, he graduated from the University of Maryland with a degree in mathematics and bought his first house the following year just outside Atlantic City. After the casino gambling referendum passed and real estate prices began to boom, Dave’s interest in markets quickly overtook his original plans for a career as an actuary.Dave has worked closely with Bob Prechter since 1983. He has lectured around the world on the Wave Principle, Fibonacci relationships, and investor psychology, and has taught advanced Elliott Wave classes to hundreds of investors. "February 1966 is when the Dow peaked, both on a nominal basis and on an inflation-adjusted basis. On a nominal basis it got cut in half. On an inflation-adjusted basis it dropped from 1966 until 1982. And now you got Musk in 2026 being the first trillionaire. To me, those things, there's a rhyming there. It's not anything specific, but to me it's the kind of thing that, as I would say, is really going to look good when you put a couple of arrows on the chart. And if 2026 ends up being a high, and SpaceX ends up being a peak, this doesn't end well. We all know that. But what we don't know is when does it end?" —Dave Allman
* * *
Kevin: Welcome to the McAlvany Weekly Commentary. I'm Kevin Orrick, along with David McAlvany.Dave, we've got a guest today, another Dave. Tell us about him.David: Dave Allman has been in the world of technical analysis for 50 years, and has had the opportunity since 1983 to be working with Bob Prechter. Through the early 2000s—late '90s and early 2000s—he conducted a series of interviews which have been put into a book called Wall Street Uncut: Unconventional Interviews with Giants of Technical Analysis.I love it, Kevin. I think it is a great introduction to the various methodologies, the things that have worked for various traders through time. And there's many of these aspects that weave their way into the way that we manage money, indicators and thresholds and rules for risk mitigation that are absolutely imperative. And so, I look forward to the conversation with Dave.Kevin: I'm also looking forward to hearing what books he reads. I know he is a voracious reader.* * *
David McAlvany: Dave Allman, you've worked closely with Robert Prechter since 1983. And reading your recent book, Wall Street Uncut: Unconventional Interviews with Giants of Technical Analysis, I thought I was reading a Norton's literature anthology of technical analysis. It was fabulous. Where do we start?Your book is not the anthology, like thousand pages plus, it comes in a more modest 250 pages, but the breadth is still staggering. I went to the table of contents, and to be honest, my first question was, where's Bob Prechter, where's Louise Yamada, where's Alan Shaw? And of course, I did find Shaw eventually buried in Chapter 12. I was grateful.These are interviews conducted 25 years ago. And so our listeners might ask, "Are they still relevant after all that time?" And I would say, "Well, is the truth still relevant after 25 years, after 250 years or 2,500 years?" I think the answer's yes. So thank you for opening so many varied lines to the truth, and lining out facts of the marketplace. Welcome.Dave Allman: Thanks, David. And thank you for the very kind and generous introduction. I appreciate it. And thank you. I still have a copy of my Norton's Anthology from when I was at high school, I think. And I didn't finish reading that either.So we decided—we being Bob and I—kicking it around one day, going, "The only time technical analysts get interviewed are on Wall Street Week." And Wall Street Week has a bit of an attitude about technical analysts, and we've come a long way since the year 2000, let alone 25 years prior to then. So we just wanted to try something a little bit different where we let the technical analysts shine and talk about their methodologies more than they were getting to do on Wall Street Week. And that was the inception of the show and it just went from there.David McAlvany: You know what I loved about the book is you've got 16 interviews with technical analysts that share a love for measurement, calculation, deep regard for price action. And all of them share in common charts, capturing history, reflecting bias, revealing belief, showing psychology, and maybe even at times the market psychosis. I'd love to start with your story. From the '80s till now you've operated as something of a charts linguist. You're studying the universal language of investor choice, and we see it in lines, we see it in the technical indicators. Where did that start for you?Dave Allman: Well, I grew up on the boardwalk in Atlantic City. And in 1974, the gambling referendum in Atlantic City failed, and in 1976 it passed. And in May of 78 they opened the first casino in the hotel a half a block away from where I'd spent all my formative summers from when I was 11 years old, right across from Steeplechase Pier. And I got hooked on the gambling stocks. The gambling stocks back then were a less roided up version of bitcoin or AI nowadays. (You used to say they were a less roided up version of biotechs back in the late '90s or dotcoms in the '90s, but now you got to talk AI and cryptos.)And essentially you could throw a dart at anything that had anything at all to do with gambling stocks, and the stocks were just going up. Just up, up, up. And it was a few months until I learned that stocks actually could go down. And that was an interesting lesson, being on margin and finding out that, wait a second, you just lost a lot of money.David McAlvany: Markets can move both directions.Dave Allman: Yeah, but I was absolutely hooked, and that's what led me to get involved in technical analysis. Essentially, Joe Granville, who was hot as a pistol back then, was touring, and he was primarily in the Northeast, and that's Philly and Jersey and et cetera. And Granville was not only a major proponent of technical analysis, he was also an incredibly entertaining, iconoclastic presence, and he was touring. So everything about him drew me into the business.David McAlvany: We've got a number of interns this summer who are learning about equity analysis. And there's fundamental analysis, which we're starting them with, just so that they understand the difference between a balance sheet and an income statement and various metrics, whether it's price earnings ratios or price to book. But the keystone for the summer will be a big book on technical analysis, and for them to bring that synthesis. What was your gravitational pull towards technical analysis as opposed to fundamental analysis?Dave Allman: Well, fundamental analysis didn't work, and there were any number of things that you would see. The basic one is, a stock comes out with good earnings, good guidance, good everything, and it goes down. Or vice versa, stock comes out with bad news, bad this, bad that, and it goes up. There was no rhyme or reason to how that— That didn't work.And there are many, many other examples that we can look at throughout history. I mean, look at how the Federal Reserve Board, for example, who are supposed to be guys who get paid for their opinions and paid to know what to do, and yet completely missed inflation, completely missed the rise in interest rates, were theoretically in charge as interest rates skyrocketed to close to 20% back in 1980, 1981. So it wasn't that difficult to go, "Gee, fundamental analysis probably really doesn't get it. What else is there? Oh, let's check out technical analysis."The first book that I ever read, and what really got my attention because I'm a math guy, was How Charts Can Help You in the Stock Market. The book is by Bill Jiler. It's just a very, very basic—I don't want to say watered down or dumbed down—version of Edwards and Magee. But that was what did it for me, was the first time looking at charts and going, "Oh my gosh, there's a history here. Look at this. And look, there's not just a history that goes back three months or six months or in some cases 10 years or even longer than that, and you can see what happened and how stocks absolutely— Wow, this stock really came from nowhere, or oh my gosh, look, this stock has dropped 80% four other times in its history."You don't get that from fundamental analysis on Wall Street. You don't get that from people who don't look at historical charts and get a sense of what has come before. And if you were asking me, "Hey, Dave, I got a group of interns who I'm trying to teach about the stock market." Man, teach them to look at a chart, teach them to look at history and see what has happened, and not to take what they hear anywhere at face value. Do the research yourself and check it out.I don't want to get too tangential, but one of my pet peeves is when you'll hear some commentator report a number as though it's a big deal number. In fact, a lot of what you see nowadays are numbers that are reported as: this number just set a record, that number just set a record, record number of this, et cetera, et cetera.And you go to read the article— That's the headline— You go to read the article and you see that it's a record because their dataset only goes back five years. Well, this market's been around for 50 years or 100 years. How can you make that statement? And it's because they are casual and sloppy about it. One thing that you would not say about any of the people that are in the book or any of the people that I interviewed over the years was that they were casual or sloppy, because they absolutely, positively were not.And one of the cool things for me about all these people is how old-school things were back then. I used to be the youngest guy in the room, I'm not anymore. But back then we didn't have computers on everybody's desk. You had to use a payphone if you wanted to dial up your broker, and hopefully you could get through so that you could get a quote, and a lot of these people did charts by hand. I think that there's something to the idea that you get more of a read, more of a sense of the market, back then when these guys were plotting and in some cases—Justin Mamis, for example—hundreds of charts a day by hand. He knew whether stocks were moving, were feeling heavy, or whether there was something else happening.David McAlvany: Well, you've got the 16 interviews, and with so many methodologies for technical analysis, is there a Rosetta Stone that ties them all together?Dave Allman: Not that I'm aware of. What I've told people over the years, because I've talked to a lot of guys who trade and a lot of guys who are looking for the Holy Grail and this, that, or the other, and for some guys it's percent R, for some guys it's stochastics, for some people it's SMACD, other people it's Elliott Wave or candlesticks, et cetera.What I've always and ever told anybody is two things: One, if you've got something that works, don't let anybody talk you out of it, no matter how ridiculous it may sound when you've tried to explain it to someone. If it's working for you, then just continue doing it until it doesn't.And the other thing is, you only need one thing. So if you've figured out how to use a moving average crossover and that works for you, use it. If you figured out that, man, I just like to trade breakouts from triangle patterns, and that works for you and you know how to manage the risk and how to allocate your assets accordingly, then use that. I think it's whatever works for the individual.David McAlvany: You curated a list of technical analysts for this book, and I wonder why these analysts, and what do they bring together collectively? Because frankly, being the person who put together the "anthology," my guess is that there was some benefit to you of seeing maybe a little cross pollination or how these systems can in fact work in a complimentary way.Dave Allman: I would love to have some eloquent answer to that, and say that I based the selection on this, that, or the other. Over the course of about a year and a half, I conducted somewhere between 50 and 60 interviews, and they were people who were interesting, who were important to the field of technical analysis, and were active and were interesting and had done something that was unique and worth talking about. And as far as narrowing that list down for the book, I didn't use a specific methodology for saying, "I need this person." Granville's in there because he's Granville. I mean, he's the guy. He was, of all the technical analysts on the planet—ever, I think—he's the one who had the biggest presence—the biggest personality, for certain—and his contributions are significant.But everybody else in the book is in there and has— I think anybody could glean at least one important lesson, insight, value from any one of the interviews and use it to their benefit. And I think that the history's very cool. A lot of these people contributed things that we take for—when I say "we", anybody looking at charts today, anybody using an online trading platform—takes for granted. For example, anytime you go to a trading platform or pretty much even just a— Well, Schwab's a trading platform, I guess, not to just name Schwab, or Interactive Brokers or anybody else. You have a choice of pulling up a line chart or a bar chart or a candlestick chart.In the old days, if you wanted to plot anything, you had to draw that on a piece of graph paper and you had to grab the high and the low and the open, if you wanted it, and the close, and put your own hash marks on the chart, let alone doing candlestick charts. Now all of that's programmed, so somebody like Steve Nison—who pretty much was responsible for making, for popularizing candlesticks in the United States—should be credited for having done that. People take the 200-day moving average like it's some magical indicator; that was Granville. Stage Analysis is Stan Weinstein. Ned Davis took the Weekly Hotline and turned it into a major institutional research firm.And then I guess there's some people in here who I'd consider a little bit more esoteric. Someone like Evelyn Browning, whose dad, Iben Browning, came up there absolutely, going to see that, oh well, he forecast a volcano that didn't destroy the world and that's what people like to talk about, of course. We see that happen in a lot of different areas. But Browning made some very, very insightful comments about long-term climate cycles and climate change and things like that that put everything that is on the top of people's minds today about global warming in a much better perspective.People forget that back in 1975 the big worry was global cooling. They're worried about the next mini ice age. And again, look at the chart. Somebody like Browning, or his daughter who continues his work, look at charts going back centuries and demonstrate climate cycles so that you can see, oh, this has happened before, oh, this isn't that strange, oh, it's not that this was happening a thousand years ago and, gee, we weren't flying airplanes and theoretically destroying the ozone layer then, so maybe it's not us.David McAlvany: There's a common theme throughout your interviews that I picked up on, which is to be a successful trader— And of course, they're using technical analysis to trade and make money. But the common theme seems to be, or themes, risk management and adaptability. Why are those important for investors? How does technical analysis support them?Dave Allman: I think that technical analysis— There's a book by a fellow named Dave Aronson called Evidence-Based Technical Analysis. And I've commented over the years that I wish that somebody had insisted that I read that book before I got involved in the career of looking at charts and technical analysis and being involved in the market. Because basically it's easy, it's so easy for people to look at a chart of, let's just say a moving average crossover. Everybody's familiar enough with that, and go, "Oh, I'd have bought them when the fast moving average crossed over the slow moving average here, and I'd have sold them where the fast moving average crossed over the slow moving average here or maybe down through zero or what have you. And gee, I'd have caught this move and I'd have caught that move and I'd have done this and I'd have made a lot of money." No, you wouldn't.And the reason you wouldn't have is because the mind seems to have a tendency to overlook all those areas where the decision that you would have had to make half a dozen times in real time as that same moving average cost up and then down and then back up and then back down again before it finally crossed up and the move finally occurred, and you weren't there for it because you were burnt out and your discipline had withered a little bit. And I know the question is about risk, and I think that even with any form of technical analysis there has to be an additional layer of, how am I going to risk the funds that I have to put at risk, how am I going to allocate, how am I going to place a wager, how am I going to determine how much money I can lose?I think there are numerous ways to do that incorrectly, and there are numerous ways to do it correctly. I don't know what the holy grail to that is, but it's something that, again, people should not summarily or casually ignore. It's something that has to be dealt with. And as you point out, a number of the guys in here—Stan Weinstein, Justin Mamis, I think specifically Earl Hadady—all talk about risk, but I don't think that any one of them has, "Hey, here's a golden formula that's going to guarantee that you make money."David McAlvany: It seems like there's a rules-based system when it comes to technical analysis, and those rules could be as simple as cutting losses and letting profits run. Those risk mitigators could be back to position limits and what you're describing about, how do you allocate funds, what's too much, what's too little? The unique thing seems to be lack of ego. When I think of the adaptability piece, if the market moves against you, price action is not supportive, you break a particular trend line or what have you, what's the next thing that you do?You don't convince yourself that you're right, you don't even try to justify the position that you've taken, you go ahead and reverse course. And that adaptability seems to fly in the face of a lot of the ways that investors approach the markets, where they get enthusiastic about something, they buy into an idea or a narrative, or going back to our earlier conversation about fundamentals, develop this case that this is the greatest stock ever to own, only to discover you're losing money, but you remain unconvinced that you're wrong—can't be wrong. There's perhaps a little bit of ego involved. I love the adaptability built in.Dave Allman: Right. And if you're not humble, the market has a way of providing that humility, I've found, over the years.David McAlvany: Oh, yeah.Dave Allman: Right? That sounds right.David McAlvany: Oh, yeah.Dave Allman: Again, I don't know if there's a methodology out there. For example, what methodology out there told you that you should buy Micron a year ago, let alone back anywhere coming off the lows in 2009? I mean, the stock was $2 on a split-adjusted basis. It's over 1,000 today. What combination tells you you need to be buying this $2 stock as opposed to another $2 stock? For me, after being in the markets for, I'm pushing 50 years, that's still a question. It's largely a matter of individual makeup.Take bitcoin for example. Forget buying it if you bought it at 10 cents or when it was— Here's a question. In the year 20— What was it? 2010, bitcoin's coming out, it's a new currency, it's trading at 10 cents. And at that point, I had a couple of dollars to rub together. Is that the expression? Not like in 1980 when I had my brief, failed stint as a stockbroker because I wanted to be near the stock market and this is great, they'll pay me and I can be near the stock market and sit and watch quotes all day. But I quickly learned that sales wasn't my forte. It was more technical analysis. And interest rates were at 20%. It'd be great to lock some of that in, but didn't have any money.Why didn't I put 100 or $1,000 in bitcoin in the year 2010 and leave it there? Even if you had, and I've had my share of, I bought this stock. Well, I bought it at a dollar, maybe I'd put a few dollars into it, but there was no way. There's no way that if I had a position in a stock like Micron near the lows in 2010 at $2, that I'd still own anywhere close to that position here in 2026 with the stock at 1,000. It's just not happening. So, what in terms of asset allocation or money management or just discipline tells you or allows you to stay in that stock? I don't think that there will ever be an algorithm that does that for people. I don't think that's possible.David McAlvany: I think it was Ralph Acampora who basically said, "Prudential hired me to get in early and to get out early." And it didn't have to be perfect. You didn't have to be there for the entire move, but you were looking for signals to do something to take action, and that could either be growth oriented or risk mitigation oriented.Many of the interviewees that you have in the book I either know personally or have met at conferences or have read or read about over the past 25 years. And there's no bibliography at the back of the book, but there is reference made to dozens of books throughout.I wondered if you would pick top three, top five that have influenced your thinking and trading practice within this genre of technical analysts.Dave Allman: Personally, like I said, Jiler was not in the book because he wasn't around to interview, but if people could find a copy, I would read that. Granville's New Key to Stock Market Profits was 1960, plus or minus a couple of years, and I think people should read that just to see what the state of technical analysis was way back then. And again, I realize I should be promoting the book, but I would encourage people to read Dave Aronson's book, Evidence-Based Technical Analysis. I think that's important that they read that. Stan Weinstein's book is a great overview and a great presentation of technical analysis on a practical basis.And then I guess the other book that influenced me significantly was not written by Evelyn Browning, but by her dad, Iben Browning, Past and Future History. I think that's an important book as well because it deals with climate and it deals with the influences that climate can have on economies and on people. And I think also because it underscores that there's data and charts going back thousands of years in some cases, and to ignore that data is to be out there playing a game without all the tools available to you to do your best job. And I think that's true as far as markets are concerned too.David McAlvany: Well, to illustrate that point, you mentioned Micron. So, it goes from a $100 billion market cap last year to a trillion dollars this year. Significant move. Does it go to four trillion? Well, one thing we do know is that semiconductors run in pretty radical cycles. We've had 14 cycles since the 1960s, and they tend to be very boomy and very busty. They go up like a rocket and then when the rocket runs out of steam, they roll over hard.If you were looking at a one year chart, you don't have enough data. You don't understand that this is a whole sector that gets sucked up into a fervor and tends to overproduce and then deals with inventory gluts. And you don't see inventory gluts in the charts, but that's what's behind the scenes. You just can't sustain it. The interest and activity in the stock wanes, price suffers, and you start to cycle all over again. But you go back 50, 60 years, and, yeah, 14 cycles for semiconductors.Dave Allman: Right. And sure, you can look at the chart and you go, "Oh, well, it's a parabolic rise, and parabolic rises always end poorly." But something could be parabolic at 200 and then you change the scale and, gee, it looks even more parabolic. It's really parabolic here at 500. And now look, it's at a thousand, now that's a parabola. You still don't know if it's over or not. And in the meantime, you got a couple of margin calls between $200 and $1,000 if you were short the name, right?David McAlvany: Yep.Dave Allman: Hey, I used to read your dad religiously. Can I just mention one thing about something that has stayed with me all these years?David McAlvany: I'd love to hear it. I had no idea. This is great.Dave Allman: It's positive. Anyhow, your dad's on. Back in, I want to say it was 1989, I'm pretty sure that that was the year, but he wrote a piece. He had his regular newsletter. It was like a beige color, right?David McAlvany: Yep.Dave Allman: The paper that it was printed on, because his business is significantly different than it was 40 years ago. But your dad wrote a piece about Russia and about the Russian deception, et cetera. And it was just really so well done talking about the history in Russia and their methodology for combat and for world conquest. And they would say one thing and do something else, and they had a long-range game. I've read thousands of articles over the years, and it's one of the dozen or so that stayed with me. And I just wanted to mention, I always enjoyed reading your dad's stuff, and that piece in particular stayed with me.David McAlvany: Well, if you've got kids, be encouraged. The older your kids get, the smarter you become. And as I look back and go through the archives, I kind of shake my head. I'm like, "Wow, that's my dad. That's amazing." Well, I wanted to thank you for saying that. I appreciate that.Dave Allman: Yeah, it was very cool. Very cool.David McAlvany: At a high level, there's a couple out of this 16 that I think have probably made an impression on you. If there's some things that you could glean or distill down for our listeners, for instance, somebody doesn't know Joe Granville. What is the importance to technical analysis? More interesting to me, frankly, is how he shaped your approach to the markets, what impression he left on you. He's an influence. And this whole principle of ad fontes, go back to the fountainhead. I'm interested in Dave Allman's mind. To get into your mind, I need to know what's been in your mind. Where did it come from? So share with me Joe Granville, Stan Weinstein, Ned Davis. The ones out of the 16 that really shaped your thinking and your approach.Dave Allman: I think Granville, for me at least, was "take nothing for granted. If something is obvious, it's obviously wrong." That was Granville's line. And the market basically took no prisoners. I don't know that Joe would consider himself jaded and cynical. I would absolutely describe myself that way. But Joe didn't cut anybody any slack as far as the market is concerned. He had his song, The Bag-holder Blues. And he had a little sock puppet that he would lecture with. He was a bank credit manager. And Wall Street and the financial establishment— He was anti-establishment. That the establishment was always late to the game, and always after the big run-up in the stock had occurred, they would say, "Give me that bag." And they'd just ride it all the way back down. So Granville was a big influence, a very big influence.David McAlvany: How about Stan Weinstein?Dave Allman: I knew Stan a little bit better because he and Bob were friendly. They were both in the touring lectures circuit pretty much the same time that they would run into it. I used to listen to Stan's update. I used to wait for, I'm going to say it was Friday night. If I find out in hindsight that it was Tuesdays, then oh well. But used to wait to listen to what Stan had to say about the market on his hotline that he would record once a week. That was a paid-for service. You got the letter, professional tape reader which he bought from Justin Mamis. And talk about the markets and whether stock was in stage one, two, three, or four, and what that meant, and not to stray from that.But Stan also, I'd spoken to him a couple of times, and I had just started going out on the lecture circuit, and this is a while ago, and he said, "Dave, be honest, be pithy, have fun." We've spoken, I guess I talked to him sometime in the last few months because of the book, and he's just always been such a great guy, just a great guy.David McAlvany: Before we move on to the next one, I'm curious if his stage analysis, stage one, two, three, and four, can you apply that to an index as well as a stock?Dave Allman: Oh yeah, absolutely.David McAlvany: Where would he put the S&P in stage analysis today?Dave Allman: I don't want to put words in Stan's mouth, and I don't know. I'll tell you where it's not. It's not in stage 4A or 4B. Absolutely not. Nor is it in stage 1 or even stage 2. So I guess that narrows it down, but each stage has an A and a B so we'll leave that there, though.David McAlvany: It's a helpful reference point. It remains inconclusive. That's fine. As you go through your book, there's a lot of these guys that'll reference things like stock market capitalization to GDP. And Jim Bianco was talking in his chapter about how we'd reached an all-time high. It was crazy, never seen before at 150%. This was meaningful to him, not necessarily as a market timing tool, but you know you're in the neighborhood of elevated levels when you're up in this space. Well, that was 150, and that was the year 2000, and now we're 219. And if it was rich then, it's rich now.Combine that with a stage 3-ish. With Weinstein, you begin to build a composite, and I just wonder if that's not a part of the value of reading your book is to say there may be one thing that you trade with, one tool that you use, but there's also a benefit to this composite. If you can create a mosaic of indicators, what does that tell you?Dave Allman: Are you asking what does it tell me today now about the market or in general? As I was putting the book together over the course of the last part of 2025 and the first part of this year, and I'm going through the interviews, many of which I hadn't really looked at for a quarter of a century.And went for a walk with Bob, and I said, "This is really a great collection. There's not a bad interview in here. Everybody has something to contribute. Everybody has something unique to talk about." And I'll be honest, I don't have a "this is the perfect mix" recipe of things you put together. I think that everything that people talk about, all the different techniques and methodologies and approaches that the interviewees discuss are worthwhile. I think everyone brings something to the table, and I think all the stories are very, very interesting. It was a significantly different time when many of these people were coming up in the industry and in the marketplace.David McAlvany: And yet what we see after 25 years is that truth ages well, truth ages well. I read it, and it was refreshing. I've got lots of marginalia in my copy, and some of it is a conversation about current market dynamics. Some of it is historical in nature, kind of tying points made in theory to things that I've observed in the charts through the years, and that's the reality, is truth ages well. So what you put down 25 years ago, what you structured into this book, it's very informative. So we talked about Joe, we talked about Stan Weinstein. Ned Davis, anybody else make the short list?Dave Allman: I've read Jim Stack's newsletter InvesTech Research for gosh, close to 40 years, maybe a little bit longer, close to 40 years. And Jim manages, I used the word runs and he corrected me and said, "manages, Dave." And manages a nice chunk of change these days. And if I were directing someone to a newsletter that I thought was balanced and did a great job looking at history and a great job assessing all the indicators and putting a composite together and is actually doing it in real time, as I say, he's managing money actively. Jim Stack's InvesTech newsletter would be in my top three absolutely. I don't think Jim has a book out himself.David McAlvany: What does make me wonder, if Jim's top three, who are the other two?Dave Allman: Well, I've worked with Bob since 1983. When I first read Bob's newsletter, I got it from a friend who worked with Bob Nurock at Butcher and Singer up in Philadelphia. Nurock was at Butcher and Singer. I was at Janney back then, and I read Bob's newsletter about the Elliott Wave Theory and I said, "Of all the stuff that I've read, technical analysis, this guy's different." And it was different because it was based more on pattern recognition. And at the time, I'm in my 20s, I'm like, "This guy's got to be old the way he writes." And he wasn't, he's only a few years older than I am, and I've been very, very fortunate to have been able to work with Bob for as long as I've been at work with Bob.Back then I told my friends, because I'm in the Northeast and they're like, "Why are you moving to Georgia?" And I said, "Well, it's kind of like I'm interested in physics and I'm getting to go work with Einstein." And I still feel that Bob has a passion for the market—and like I say, he's a few years older than I am—that some people never have in any industry. I mean, the guy still looks at one-minute charts and tick divergences and breadth statistics every day in and out. Some days it's actually daunting, and he's been prolific. So I'm going to put the Elliott Wave Theory in there because I think that people should read that because I think it's a very good perspective.David McAlvany: I read every copy that comes out, and Bob Prechter— It's such a great synthesis, again, of technical analysis—of course, of what he describes as socionomics and cultural insights being brought to bear into a market analysis. It ties into a question I have, maybe something a little bit esoteric. Many of your guests made a correlation between the worlds of music and that of markets. And I was at dinner, this is probably five years ago, and my wife's in a local theater group, and one of the guys that's in that theater group, he's a retired Treasury trader.So over dinner, we're talking about the Treasury markets and we're talking about interest rates, and he starts riffing on his love of Elliott Wave, and I'm like, "I'm going to have dinner with Bob Prechter in about two months." We met up down in New Orleans and had great dinner, and he's like, "Wait a minute, you know Bob Prechter?" And he goes into this story about how he made this big pitch, an institutional pitch in London, and he brings in this full mock-up of a model in a super short skirt, and of course all these very stiff collared London bankers are wondering what the heck is he doing with this rather attractive paperboard life-size model, and she's very—not well covered, I guess you could say.And he goes in and he starts talking about the Treasury market, and he talks about these market indicators. And all this to say, we're sitting there at my friend's house, and he's talking about Bob, and I see all these guitars around his living room, and he loves music. So here's a Treasury trader who loves music. I know Bob absolutely is a fanatical music connoisseur, musician, himself, and there's a couple people in your book as well that there's this connection between the worlds of mathematics, the world of music, and the world of markets. What are your thoughts on that?Dave Allman: I think, is that left brain or right brain? It's left brain, isn't it? Music and math? There's a structure to music and there's a structure to markets, and at the same time, I think Granville talked about it, he would bring up piano when he would do his lectures. Then he wouldn't bring one, they would provide one, and Joe would play it and talk about how there was a pattern to the markets just as there's a pattern in Bach or in Beethoven, and you can tell if a note is out of place. And maybe that's true in the markets with charts as well. So I can [unclear]. I don't have much of a bucket list. I have no desire to play golf or to travel, but I'd really like to play piano better than I do. Archie Andrews played piano at one of the major cycles conferences, which is another book people should read, book on cycles from many decades ago.David McAlvany: Yeah. There was the comments from Connie Brown, and she's talking about octaves and the connection between octaves and Gann lines. And again, I think it is this pattern recognition that fits well. I think for many people the first thought of technical analysis is it's somehow voodoo. It's not tied to reality. It's actually more tied to reality, whether you're talking about Fibonacci sequences, octaves, Gann lines, the interconnection, the deeper realities there.Dave Allman: Technical analysis has come a long way in the last 40 years when it was really, really the ugly stepchild off in the corner, and that is not the case any longer. A lot of that credit goes to guys like Ralph Acampora and Connie Brown. Connie was very active in IFTA and Ralph was one of the founders of the MTA, in getting technical analysis recognized as a discipline pretty much by the New York Stock Exchange, and getting the CMT exam and licensing to be up there with the CFA. So it's the old Virginia Slims: We've come a long way, baby. Yeah.Connie, unfortunately, was very young and she passed away last year. She worked with Elliott Wave International for a while, and Connie could be very, very intense. The book talks about, she was a world-class swimmer and incredibly disciplined and incredibly focused, and she brought that to the markets, too. You don't want to get in between a trader and their focus. The only advice I would give to somebody, yeah.David McAlvany: Well, so we talked about the connection, perhaps esoteric connection, between music and the markets. Now to sort of a practical application. This is as we wrap up our conversation today. Your views on markets, drawing from technical insights, you could give a two-sentence answer, however much you want to go into this. But your insights on US equities, bonds, thinking of Treasuries, precious metals, real estate, the big categories of investments. Technical analysis tells you what about those big asset classes today?Dave Allman: I think a traditional read of technical analysis, stocks are incredibly overextended. But you could have made that statement, as you pointed out, a year ago, or several years ago. When you get an index like price to sales and you go, wow, it was 1.5 in 1987—and I'm making that number up—and it was 2.5 in 2000 and now it's at 4.6. How high is high?David McAlvany: Well, it would be SpaceX at over 110, with the long-term median being 1.6.Dave Allman: I look at things that strike me as— Since you mentioned SpaceX. Bob just wrote this up in the newsletter, but we had talked about it earlier this week. Musk is the first trillionaire, et cetera, et cetera. Everybody knows that. But it got me thinking, because Howard Hughes, right? He was a billionaire and he had something to do with planes and he had long fingernails and went off by himself. When was Hughes popular? And I dug it up. I just Googled it a little bit. And Hughes's peak fortune was— Guess a year. Guess what year Hughes's peak fortune was?David McAlvany: This might be late. I'm thinking of the popularity of airplanes, 1937.Dave Allman: No, no. That's too early. Okay.David McAlvany: Too early.Dave Allman: But he was big then. To be honest, I was thinking Hughes, I was thinking, yeah, he must have been '40s and '50s, right? Anyhow, Howard Hughes's peak fortune was in 1966.David McAlvany: Oh, that's classic.Dave Allman: Now 1966, I'm sure you know, but for the listeners, I mean February of 1966 is when the Dow peaked both on a nominal basis and on an inflation-adjusted basis. On a nominal basis, it got cut in half. On an inflation-adjusted basis, it dropped from 1966 until 1982. Now you got Musk in 2026 being the first trillionaire. To me, those things— There's a rhyming there. It's not anything specific, but to me it's the kind of thing, as I would say, that's really going to look good when you put a couple of arrows on the chart. If 2026 ends up being a high and SpaceX ends up being a peak— I mean you can't have extreme— This doesn't end well. We all know that. But what we don't know is when does it end?David McAlvany: Right.Dave Allman: Technical analysis is going to give you, whether it's pattern recognition and you're counting to five with Elliott Wave or whether you're looking at moving averages and you're using a cross, or whether you're looking at a divergence on a stochastics or an RSI or Williams %R or whatever, there will be a signal, and that signal might be on the five-minute basis or the 10-minute basis or a 15 or a 60, or a daily or a weekly, whatever.What you don't know is is that the big kahuna? What did I just reel in? Did I reel in, okay, this is just another two-day top and they're going to scream to a new high next week and I better get out of the shorts that I just put on, or did you catch something bigger and you're going to, as you said earlier, cut your losses, let your profits run? How do you know?So do you trail a stop? Do you use moving averages? What period moving average do you use? Do you try to count to five and count to three and then count to five again? Which one of those is going to work out for you? Sometimes it works out and sometimes it doesn't.As far as bonds are concerned, I have a personal bias. I would love to see rates go into double digits, because I'd like the T-bill interest now that I have a couple of shekels that I could actually collect interest on.David McAlvany: What about real estate? People tend to think of that as a safe place to be. I had that question asked yesterday on a call with 500 people, and they're like, "Yeah, but what about real estate?"Dave Allman: Yeah, real estate's not a safe place to be. Everything cycles. Real estate does the same thing. I have a very difficult time, because my kids both bought property sometime in the last few years, and after me saying prices are awfully expensive. It used to be $100 a square foot would buy you a very nice interior to a home back 30, 40 years ago, maybe even more recently depending on when. Now you get barely builder grade, and they're charging $300 a square foot for it, and people are fighting over it.Now that's changed a little bit over the course of the last couple years as the market's changed and interest rates are no longer 3% to get a mortgage, and people are just like, "I can't afford to pay that." But those things cycle. Real estate's going to come back.It can be a store of wealth, but that depends on whether or not it's a consumable or whether you're looking at it as a speculation. If you look at any long-term chart of real estate prices and you believe at all in reversion to the mean, you know that one of two things are going to happen. Either real estate is going to sit here and prices are not going to go higher for the next 15 years while that average catches up to them, or real estate prices are going to drop 30 to 50%—which, I get it, gee, how could that possibly happen—in order to get back to what's traditional mean level?David McAlvany: Well, there's the mean reversion suggestion, but there's your comments on US Treasuries as well. You see the 10-year march towards 6, 7, 8%, let alone the double digits that you are dreaming and hoping for. If we get them, where do you think real estate is? I mean this is a levered asset.Dave Allman: I don't think they have to go together. Higher interest rates don't need to take real estate prices higher. I would point to 1981, 1982 when real estate was definitely in the doldrums. I was there, I know, and rates were sitting at 20%.David McAlvany: And that's what I meant. It's like the other end of the seesaw. The higher the rate goes, the lower the home value goes, particularly if there's debt attached to it. So the last one, just to get an idea of where you think metals are today and what their future holds as a technical analyst.Dave Allman: If you took Weinstein's approach, I think the metals are certainly in stage three somewhere and haven't quite finished that up where they're ready to launch again, and the plethora of radio ads from a variety of celebrities that came out when gold was 5,000, pushing 5,500 kind of said it's done for a little while.I know the guys who do the Elliott Wave stuff at the office who spend a lot of time with gold are looking— Did a good job calling it or were looking for a correction, and I think for a little bit lower before it gets its feet underneath it again and then heads higher on an intermediate term basis. So I'll defer to them.David McAlvany: Yeah. We've talked to Steve Hochberg, and the impression that I got was short term correction; intermediate, long term, it's got legs. But they also take it a day at a time.Dave Allman: Right, exactly. You've got to give credit to the guys—I think your dad would have been one of them—who were long term gold bugs when gold was— After it peaked at 850 in January of 1980 and it's come down, it's trading $250, $300, $350 an ounce. Long term, the guys are like, "This is real money, this is it. This is where you got to be," and you got to buy gold.You have to respect a guy who had not just the vision but the conviction to say, "I believe that gold is real money and that everything else is fiat, and gold is where I'm going to put my money," and who has acquired and accumulated and held onto gold for the last 30 years, and owns it at less than a tenth of where it's trading today. You have to respect somebody for being correct and acting on that conviction.David McAlvany: It's amazing to have that conversation with my dad. He's got ounces at 35, he's got ounces at 197.Dave Allman: Yeah.David McAlvany: He's got ounces at 102 in the context of the correction from 197 to 102 on its way to 400 and then 875. He owns more ounces at 450 off the correction of 875. And he's really not particularly perturbed by the fact that he has ounces at 850-ish and 450-ish and 102 and 197.Dave Allman: Yeah. That's the whole we're not worthy. You got to look at a guy like that and you go, "Well done. Well played."David McAlvany: Well, Dave, thank you. I'm going to say the same. Well done and well played. I appreciate your book. I appreciate the effort that you put into the interviews a couple decades ago and the effort to put it together into a book format. It's a great primer into the various methodologies and technical analysis. It broadens the scope and I think is going to create a good bit of stir. So I appreciate that. Thank you very much, and thanks for joining us on the Commentary.Dave Allman: David, thank you for taking the time and guiding the interview. I appreciate it very much.David McAlvany: Dave, if people are interested in finding more about your work and ordering a copy of the book Wall Street Uncut, where can they find it?Dave Allman: It's elliottwave.com/mwc. That will take them directly to a link for the book. I can say with certainty the book is better than I've represented in this interview.David McAlvany: Oh, this has been fun. This has been fun. Dave, I look forward to a dinner in Atlanta. Next time I'm through town, I'd love to get together.Dave Allman: Okay, terrific. Thank you, David. Very nice talking to you.* * *
Kevin: What an interesting interview, and I think it was a shock to you, Dave, that David Allman was also reading your dad probably when you were just a child.David: Well, I actually have some recollection of that particular newsletter—Kevin: I do, too.David: —because it was the look at Glasnost and Perestroika and the very complicated and well thought-out program of opening up and bringing in foreign direct investment into the Soviet Union to sort of refortify and retool for the next stage of progress towards world domination. Now outside of the Cold War that might sound a little bit crazy, but that was the world we lived in, and that was the letter my dad wrote, and it does put a smile on my face.Kevin: He really had so much respect for your dad too, because here's a technical trader. Prices mean a lot to technicians. Yet when it came to gold, he just basically said of your dad, well done and well played. For a guy to go all the way back to 1972 and just see what gold is, whether you buy it low or whether you buy it high, it didn't matter, and he appreciated that.David: Yeah. No, that's a reminder of what my father's legacy is.* * *
You've been listening to the McAlvany Weekly Commentary. I'm Kevin Orrick, along with David McAlvany and our guest today, Dave Allman. You can find us at mcalvany.com and you can call us at 800-525-9556.* * *
This has been the McAlvany Weekly Commentary. The views express should not be considered to be a solicitation or a recommendation for your investment portfolio. You should consult a professional financial advisor to assess your suitability for risk and investment. Join us again next week for a new edition of the McAlvany Weekly Commentary.
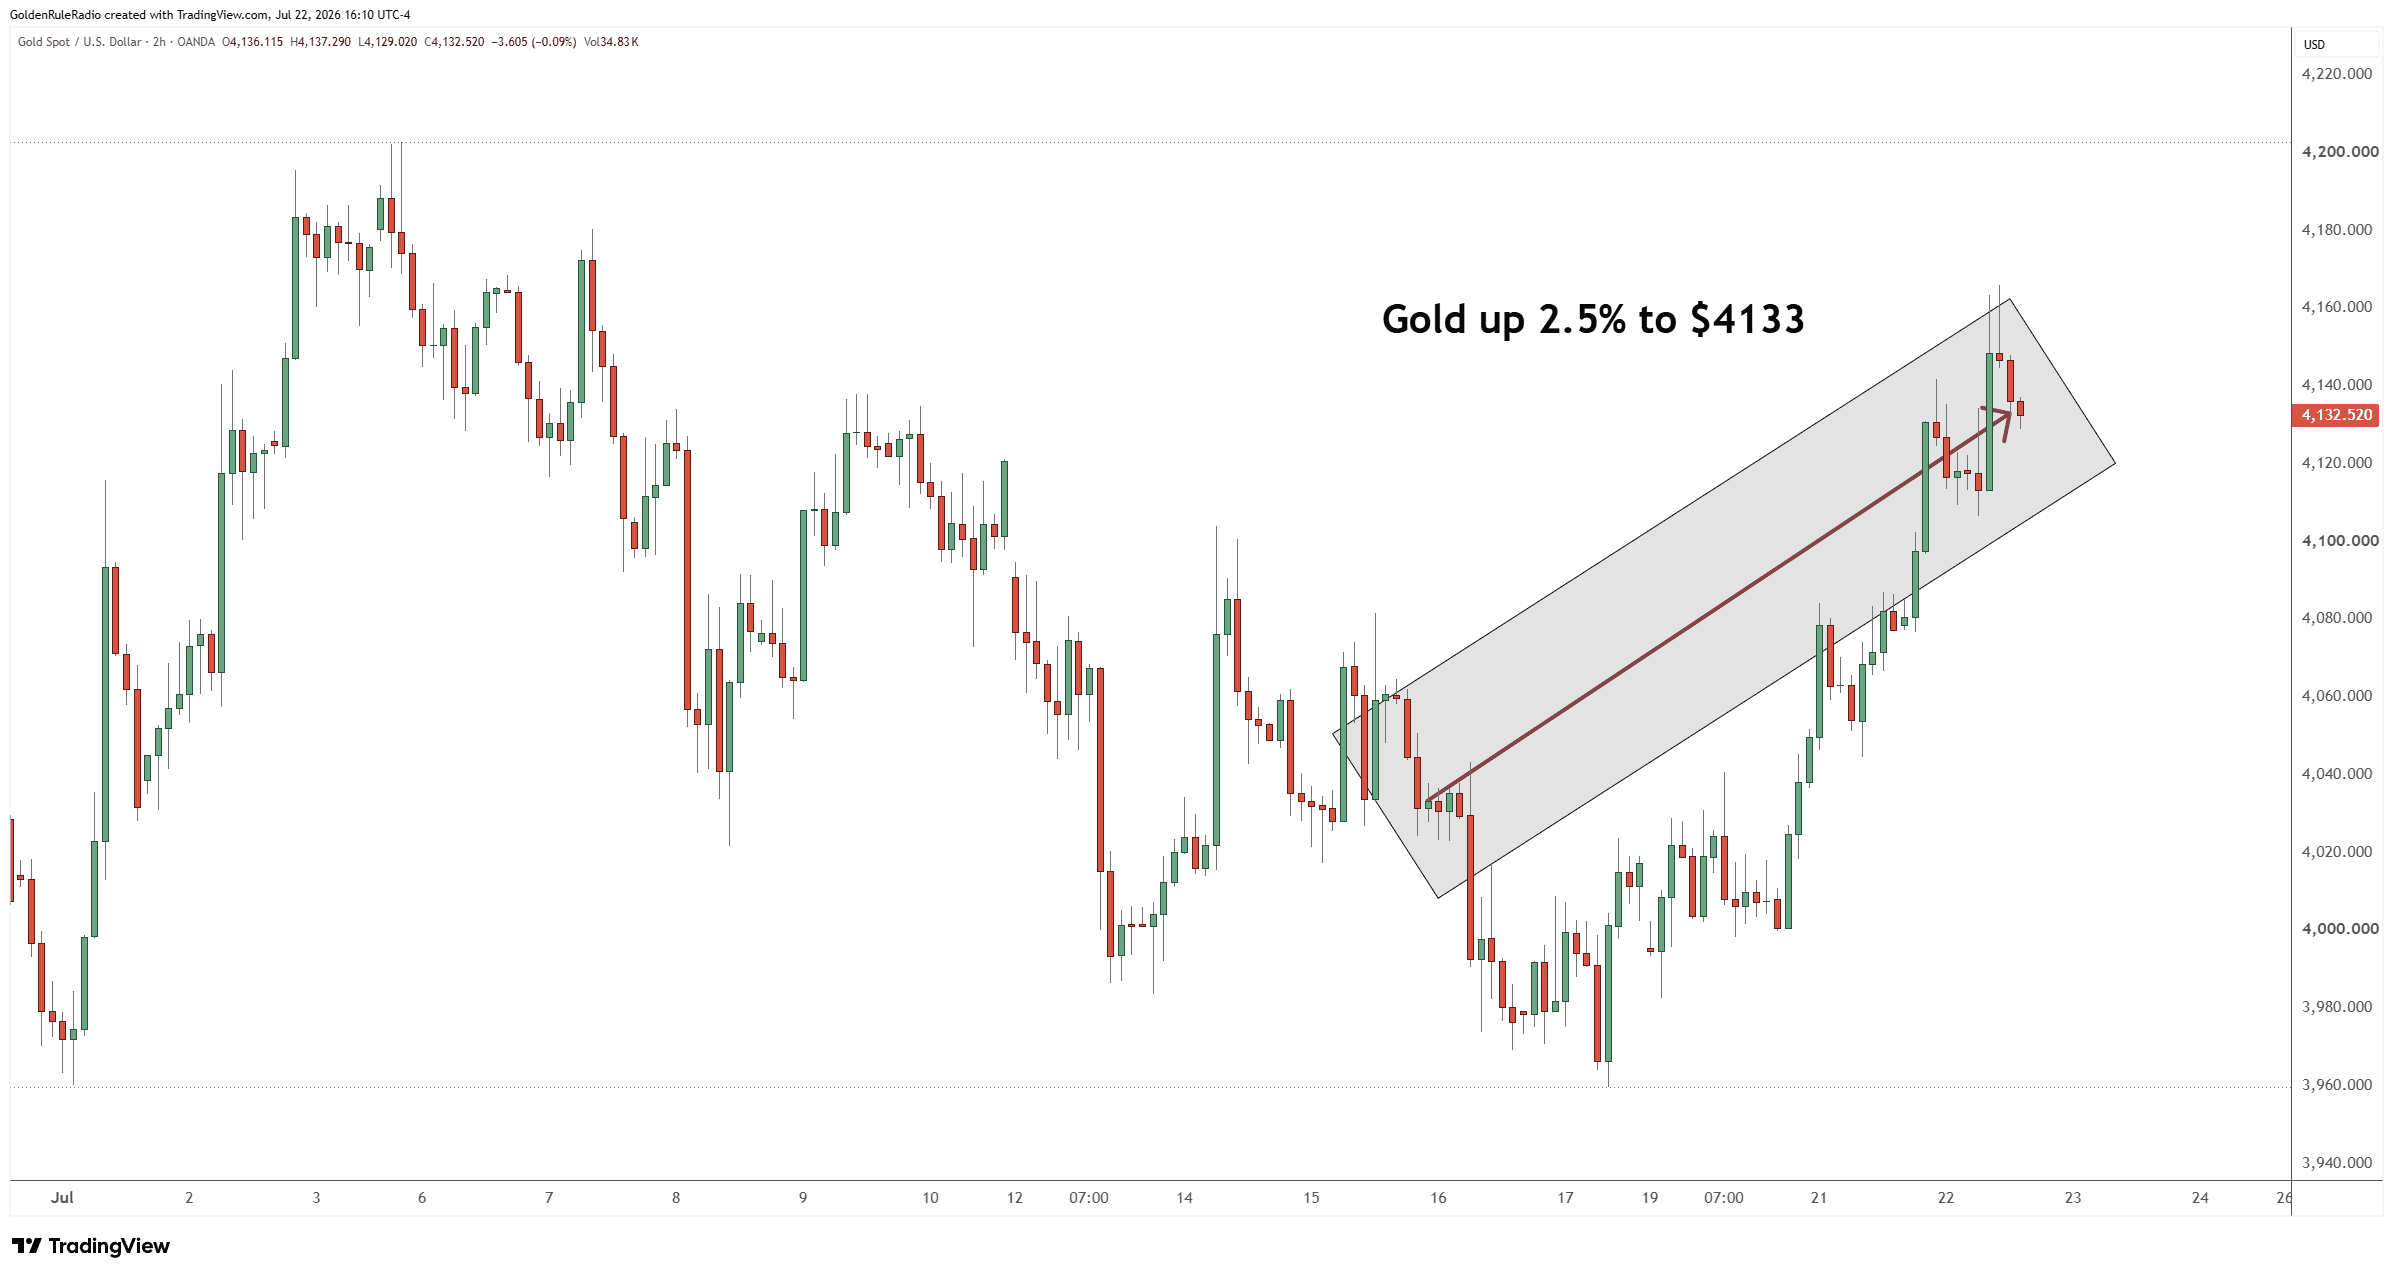 The price of silver is up 4.5%, sitting at $59.60. Whatever gold does, silver tends to do a little better.
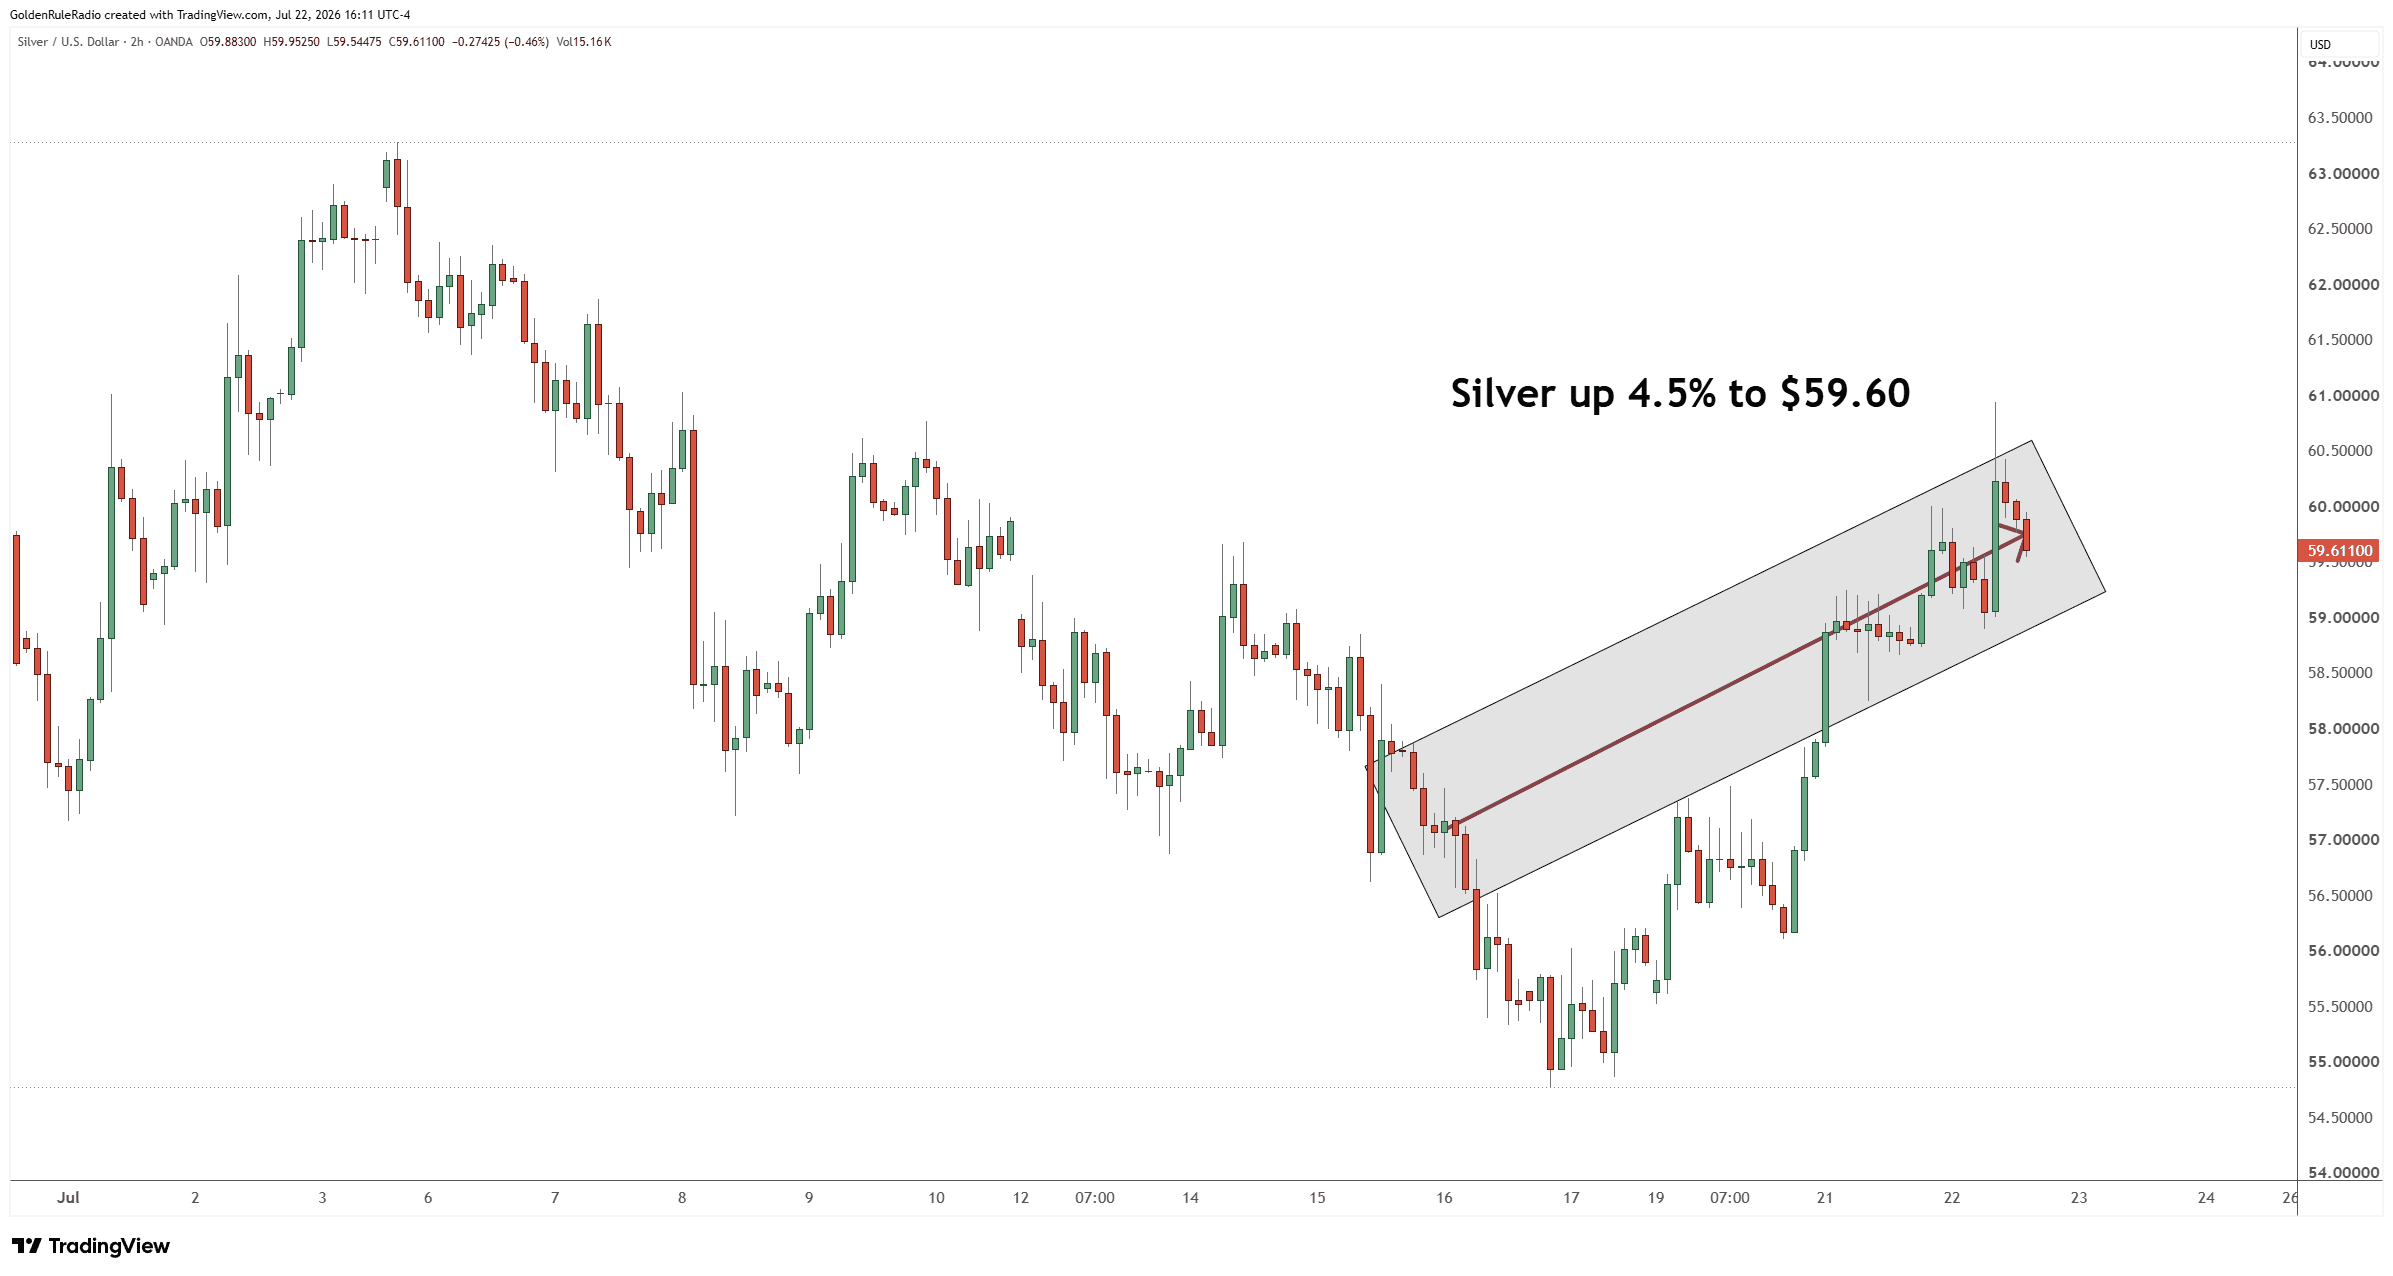 Platinum is down 1.5% at $1,631.
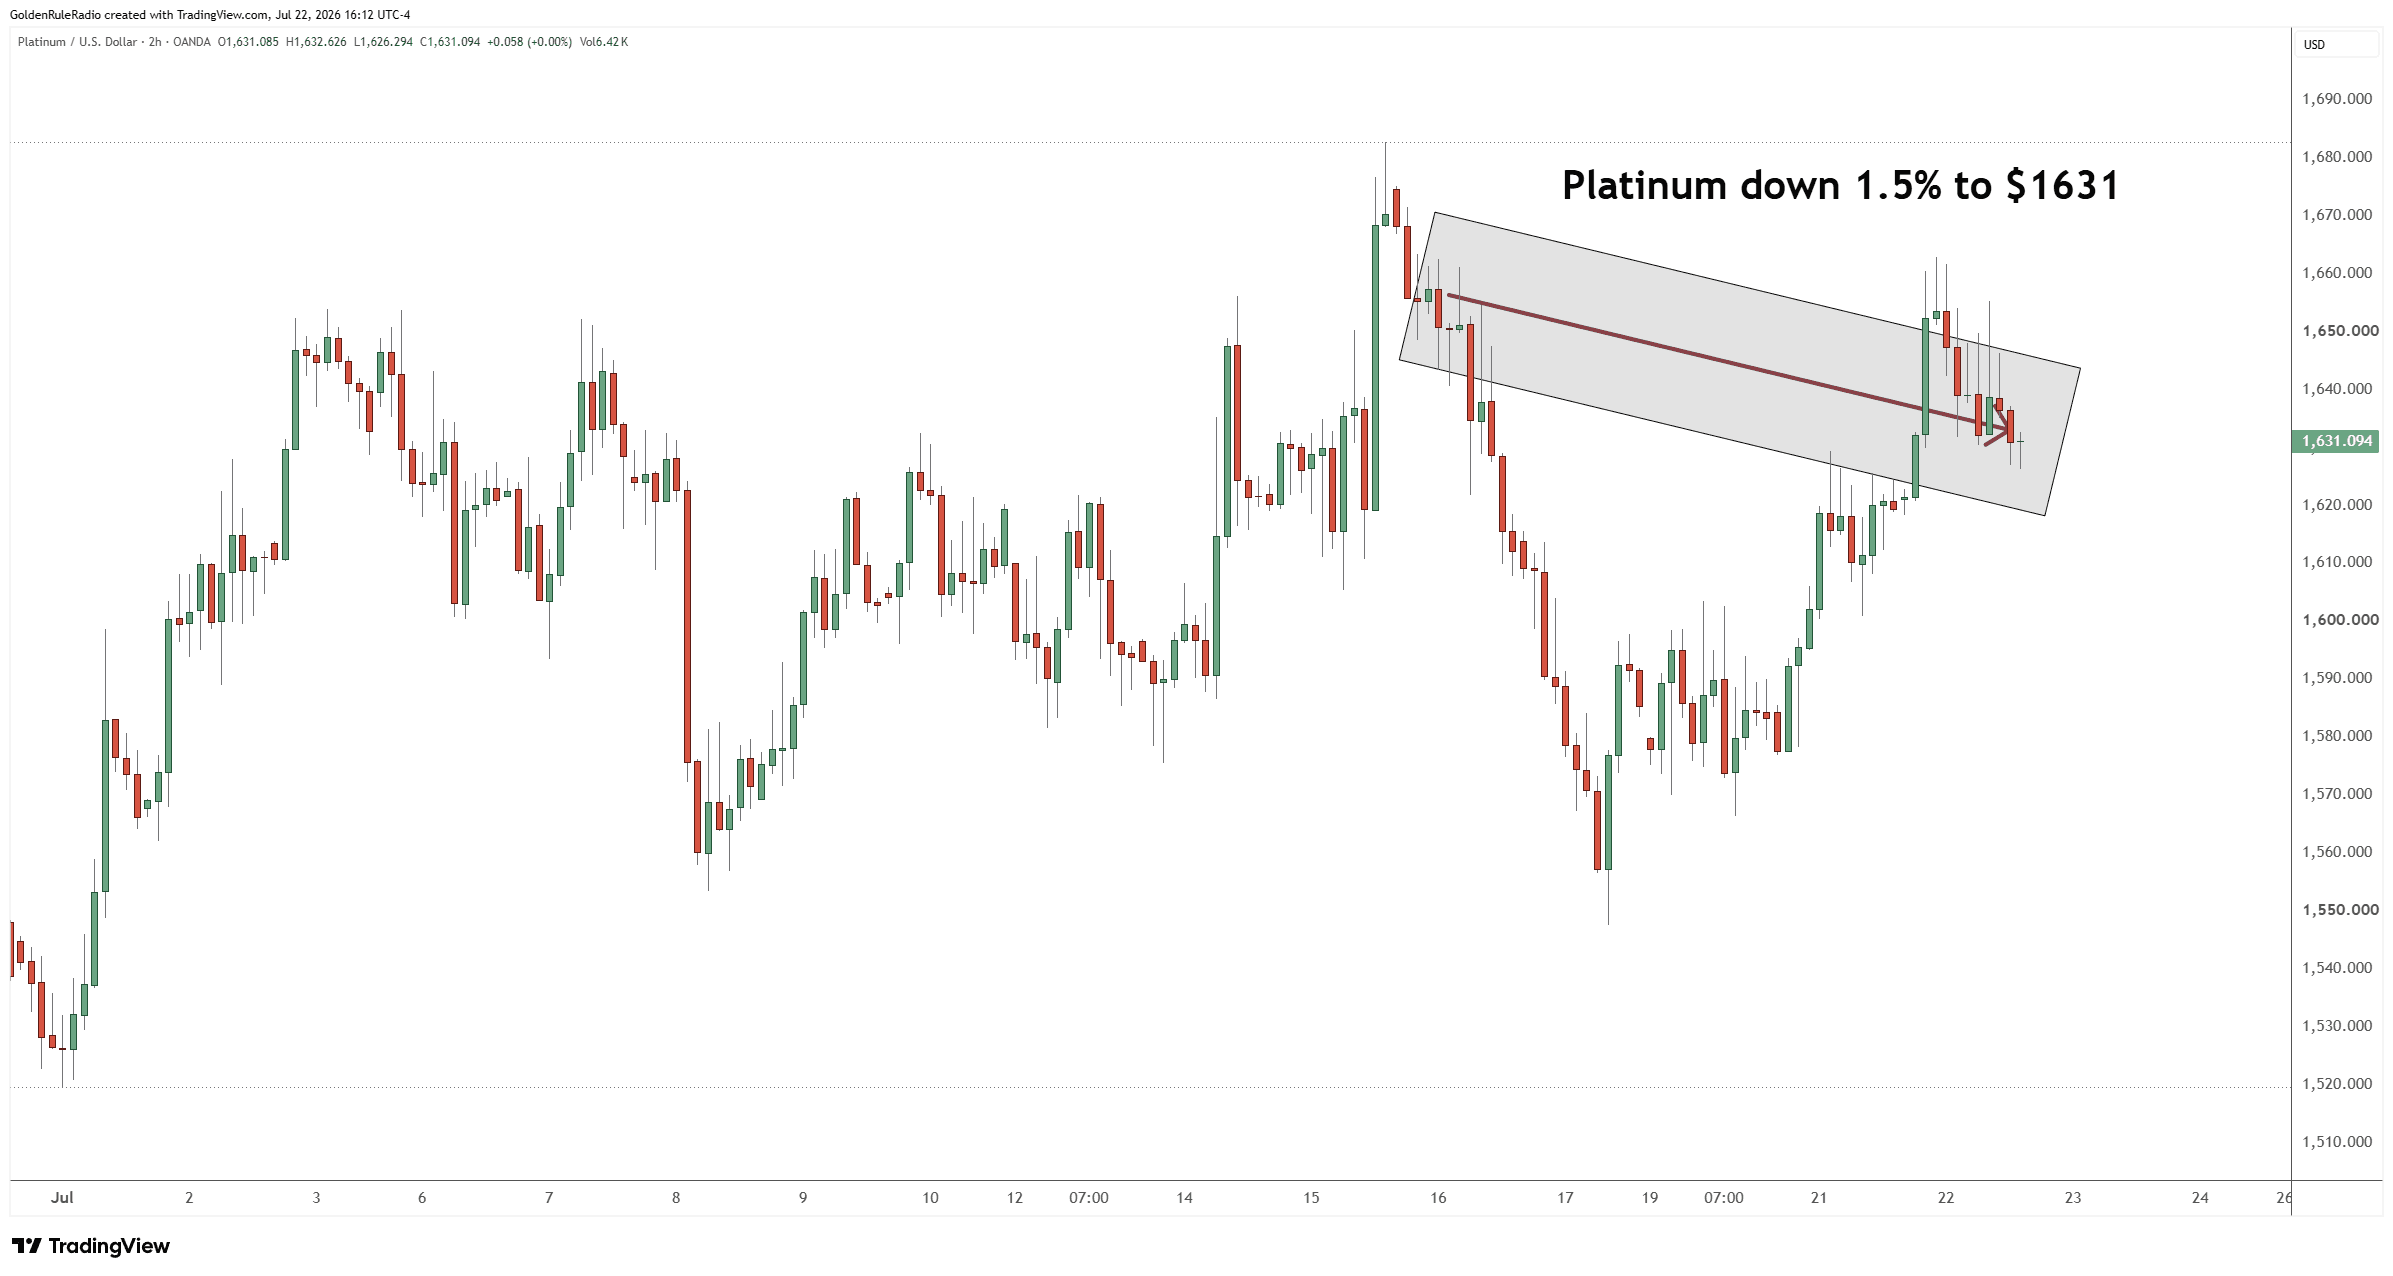 Palladium is down 1%, currently at $1,280.
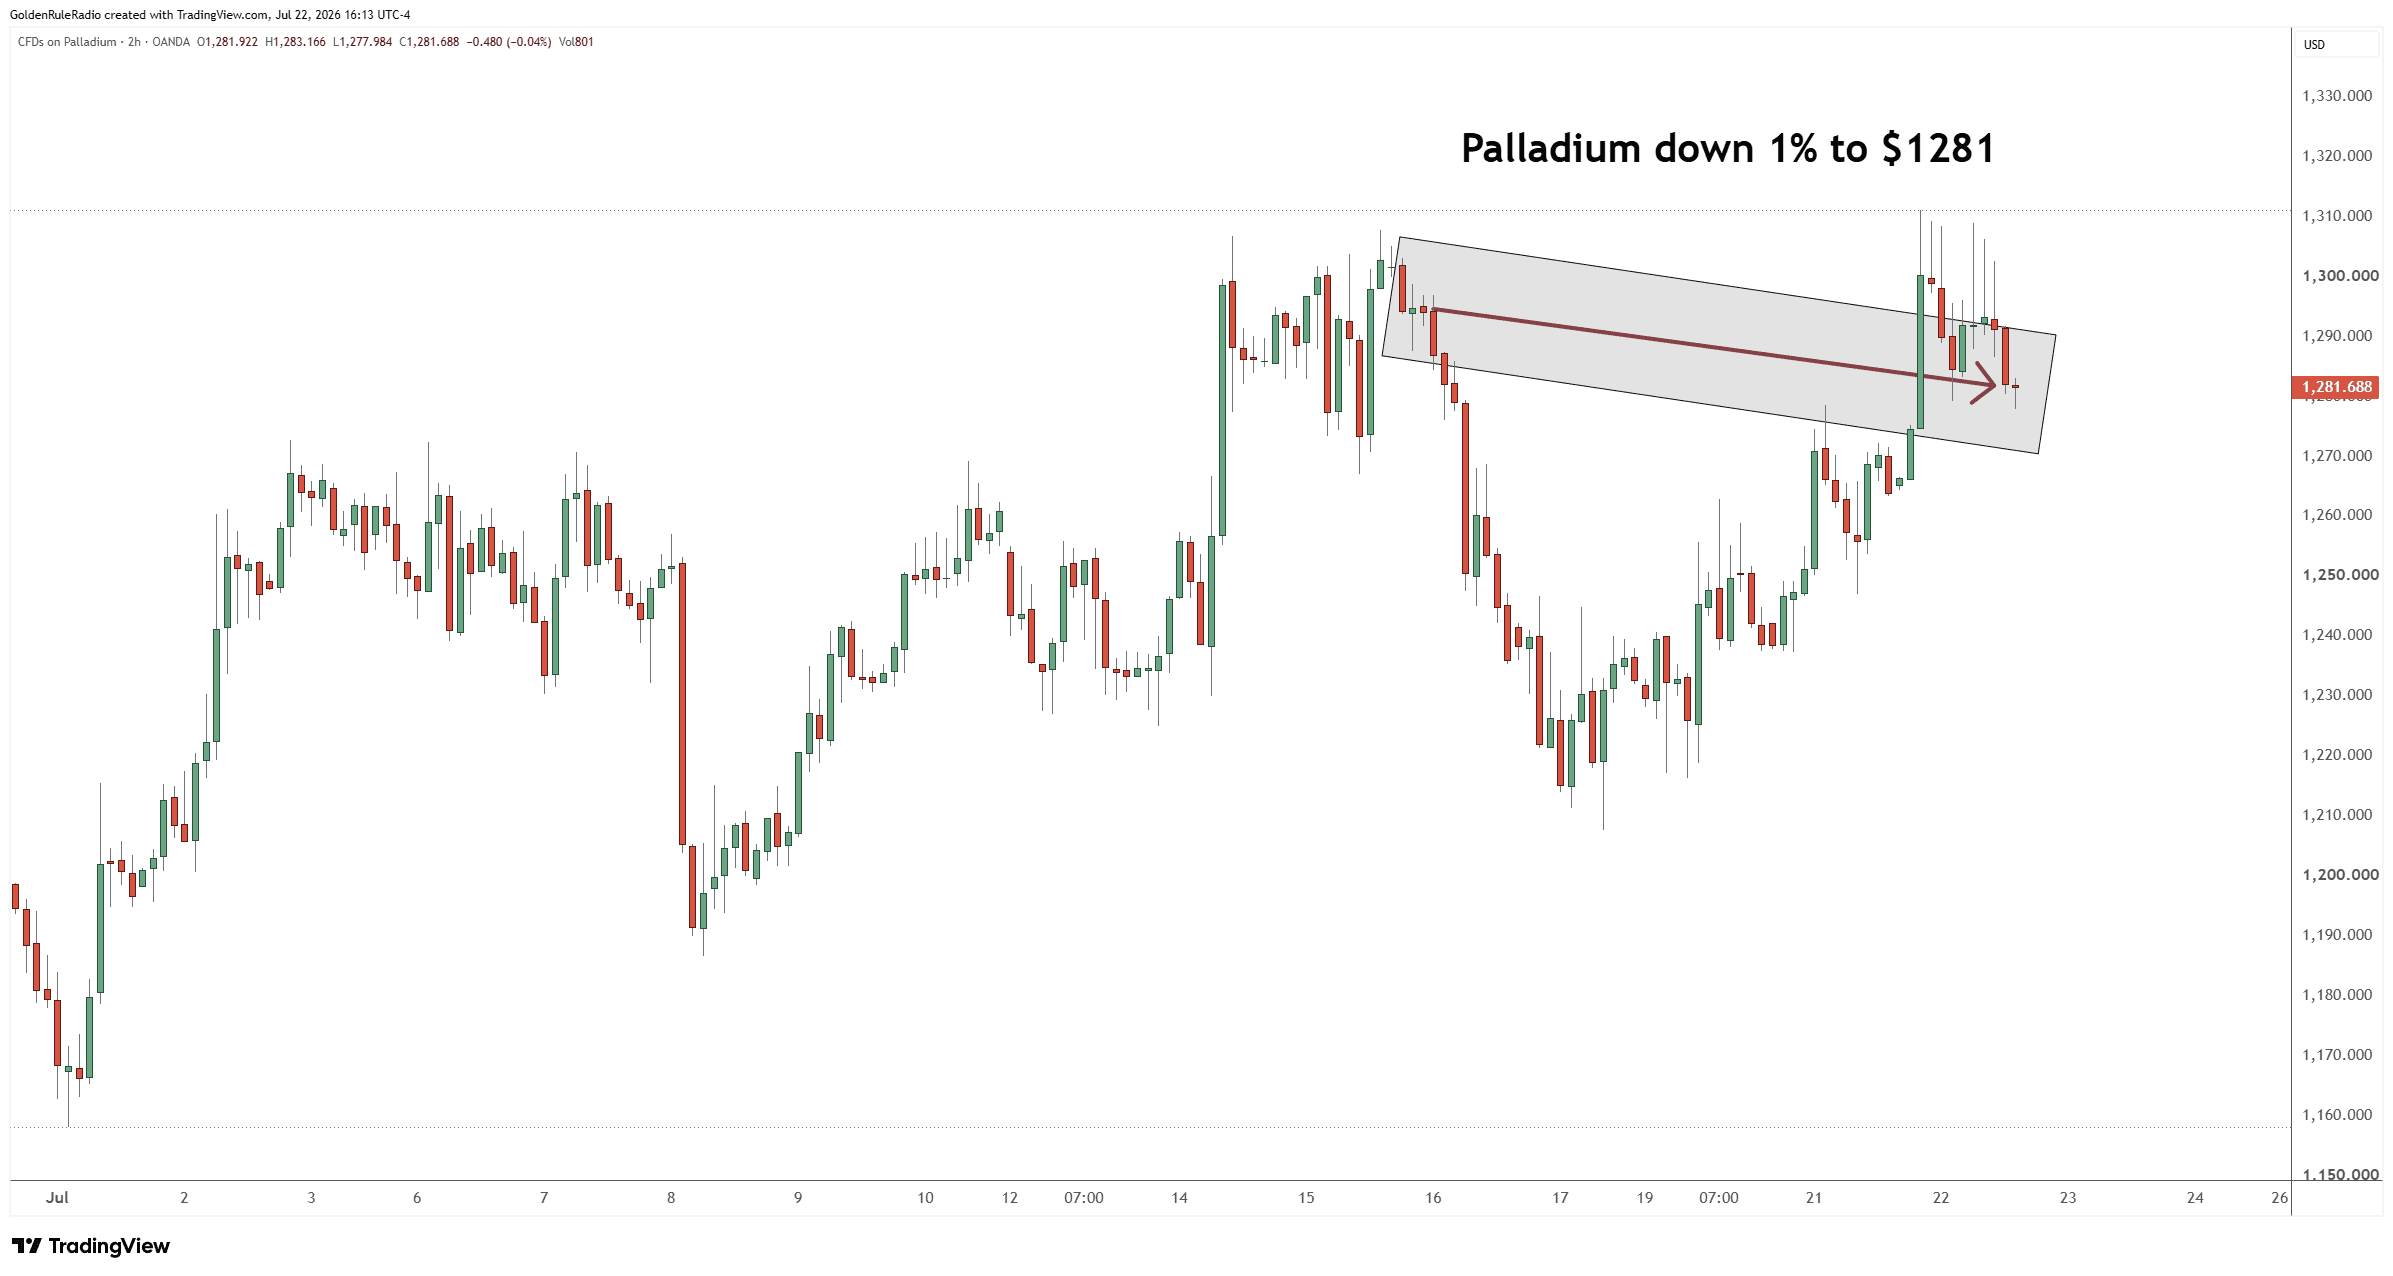 Taking a look over at the paper markets…The S&P 500 is down about 1%, sitting at 7,498.
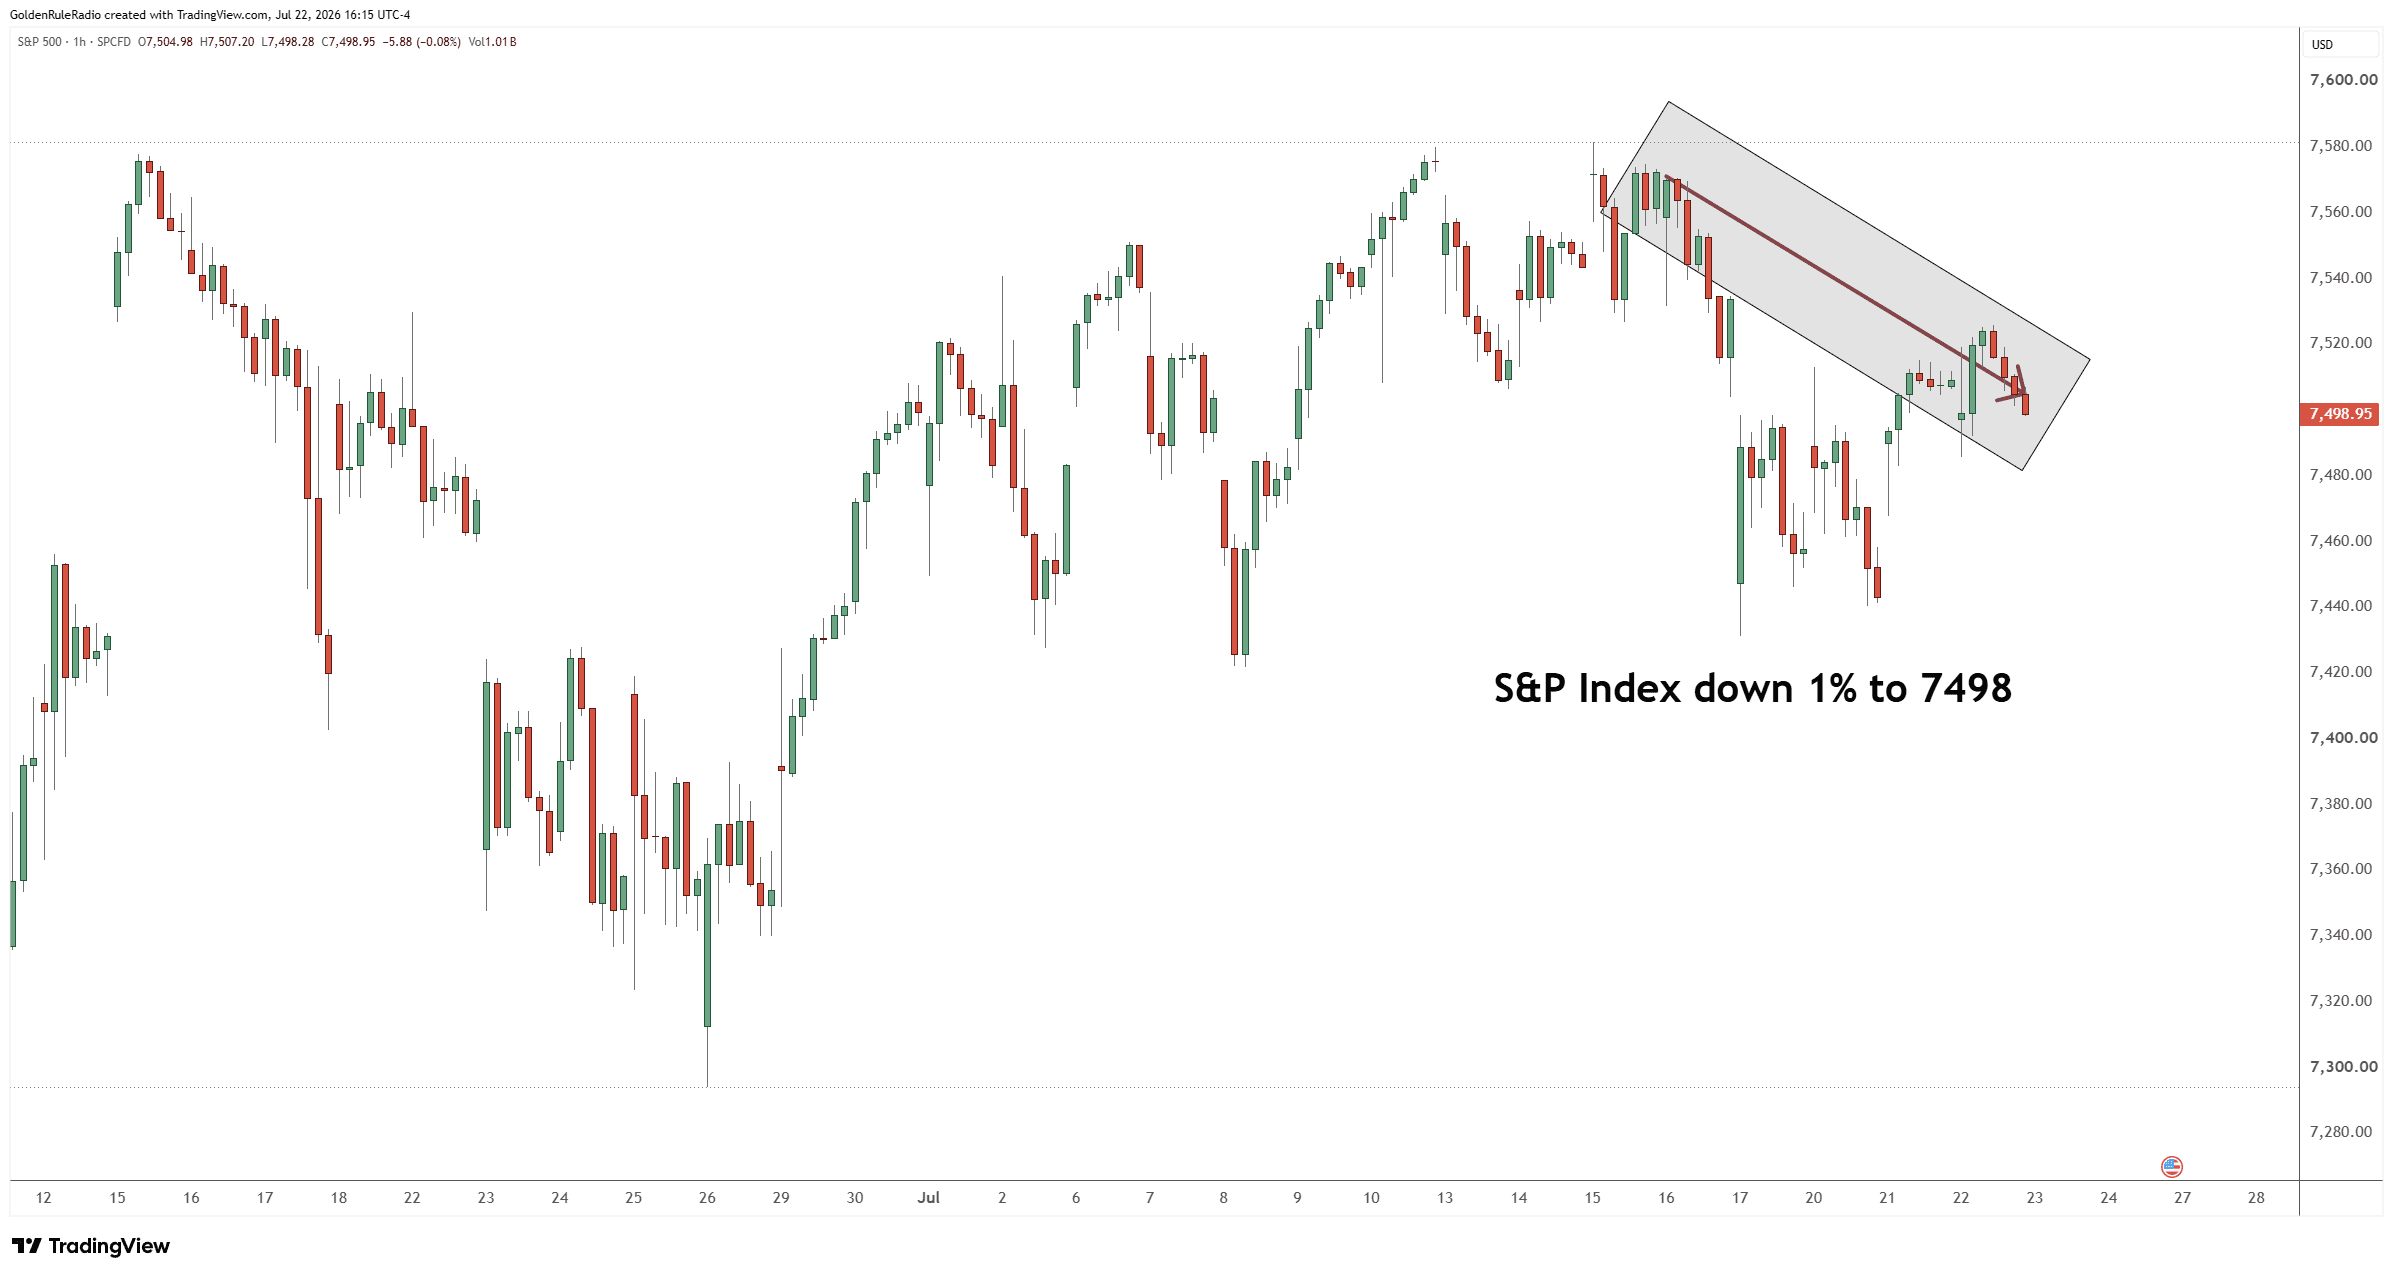 And the US Dollar Index is up 0.6% to 101.11.
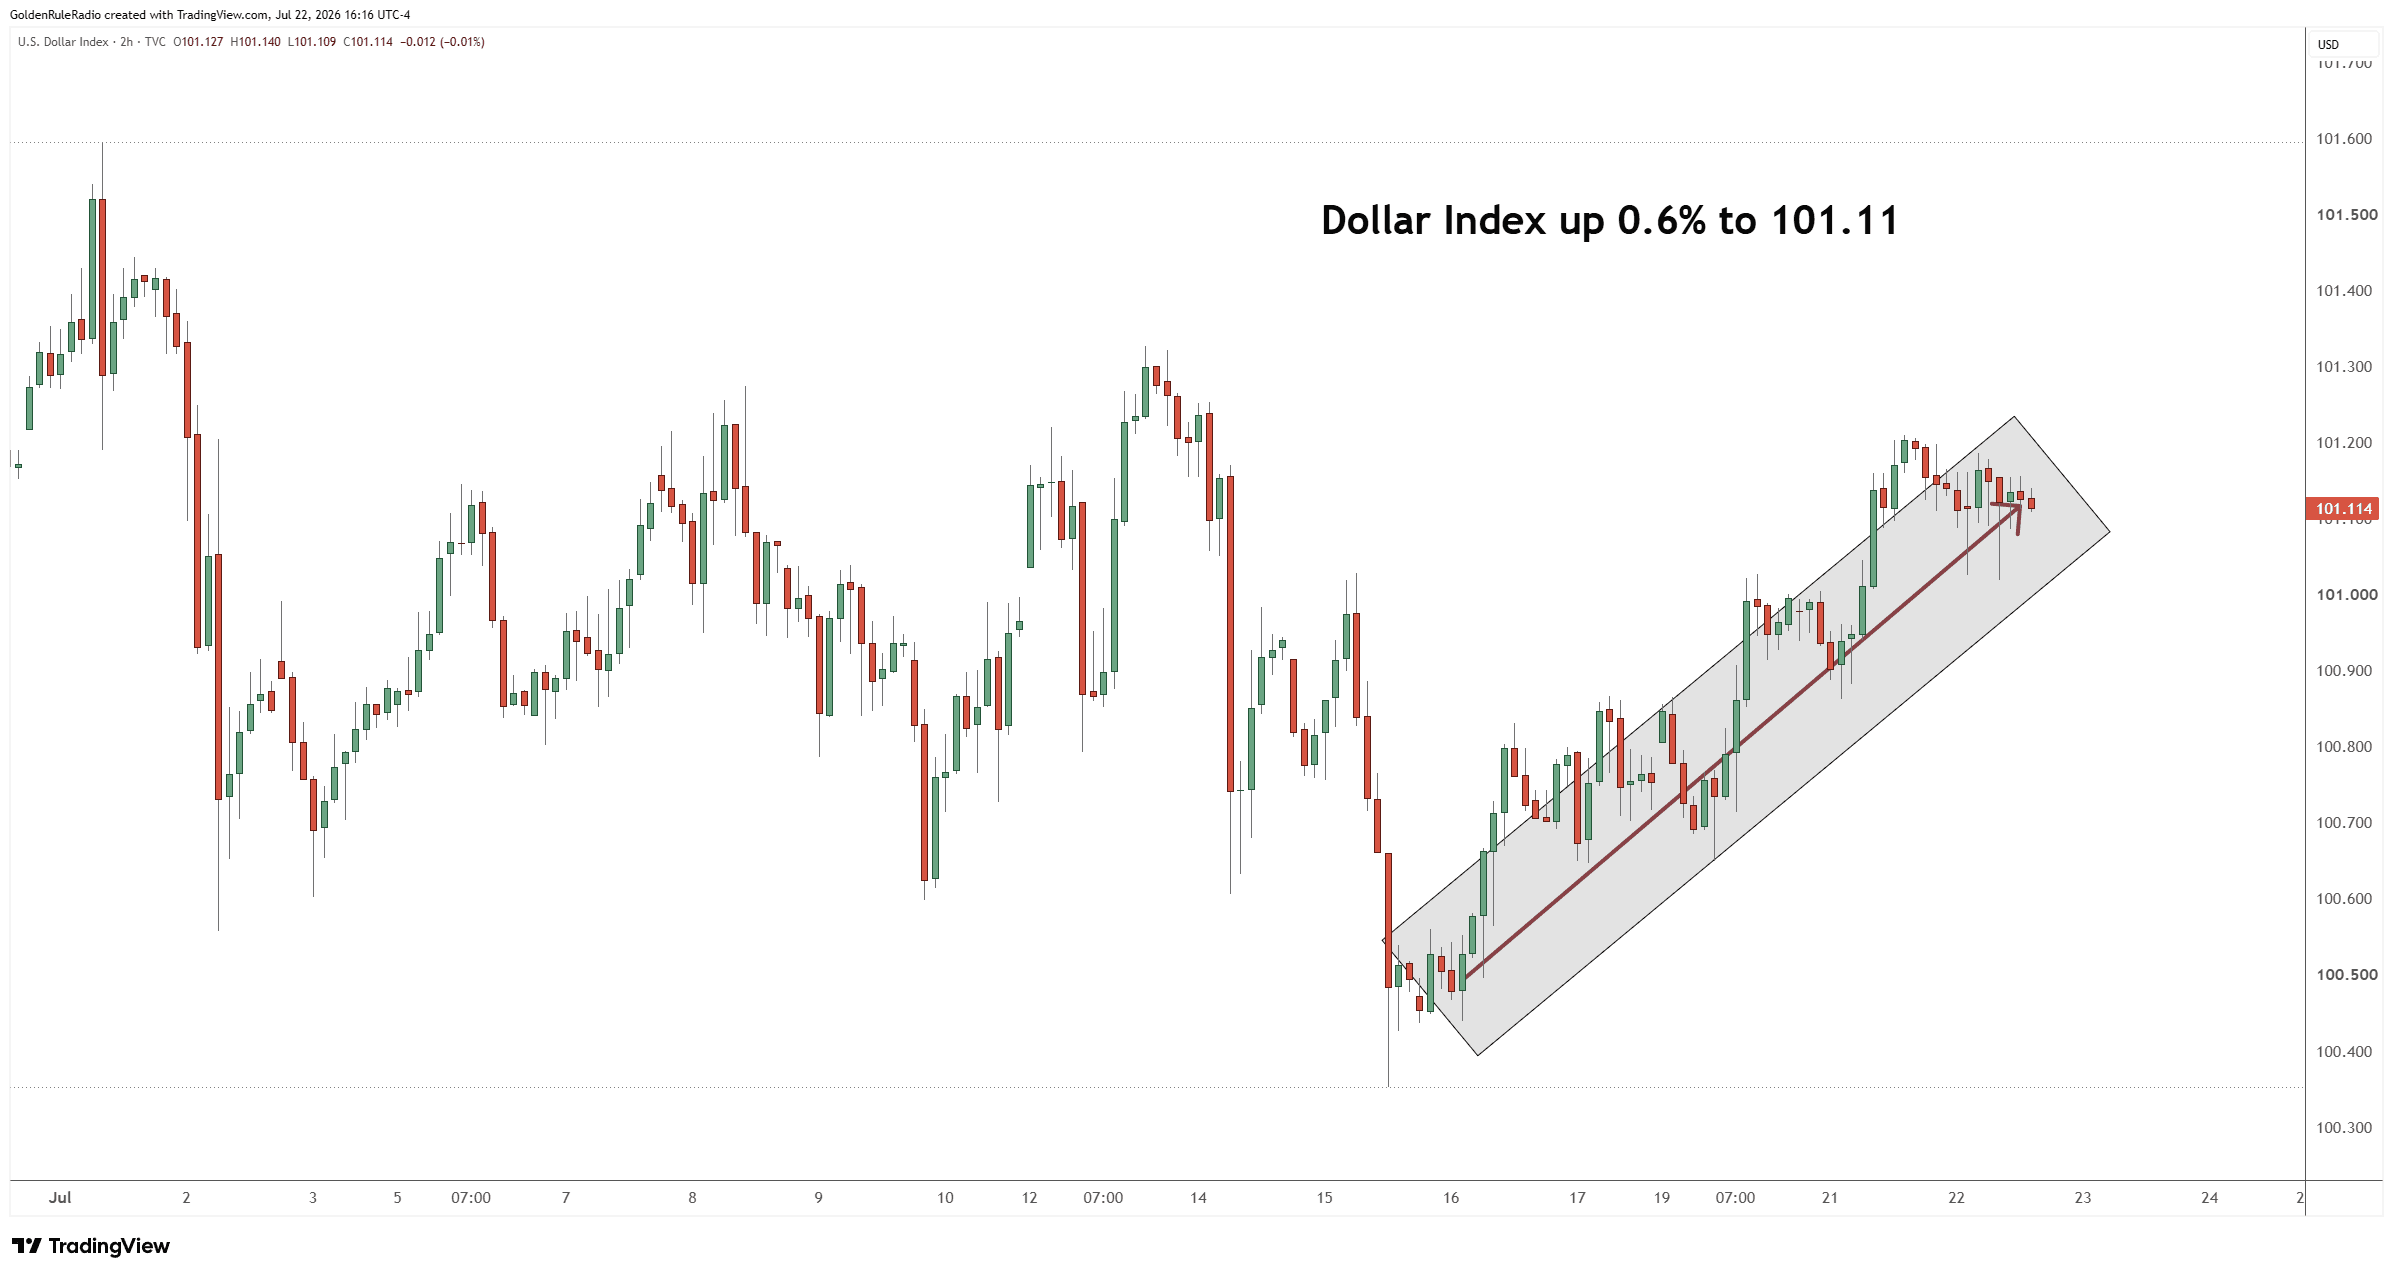 The price of silver is up 4.5%, sitting at $59.60. Whatever gold does, silver tends to do a little better.Platinum is down 1.5% at $1,631.Palladium is down 1%, currently at $1,280.Taking a look over at the paper markets…The S&P 500 is down about 1%, sitting at 7,498.And the US Dollar Index is up 0.6% to 101.11.
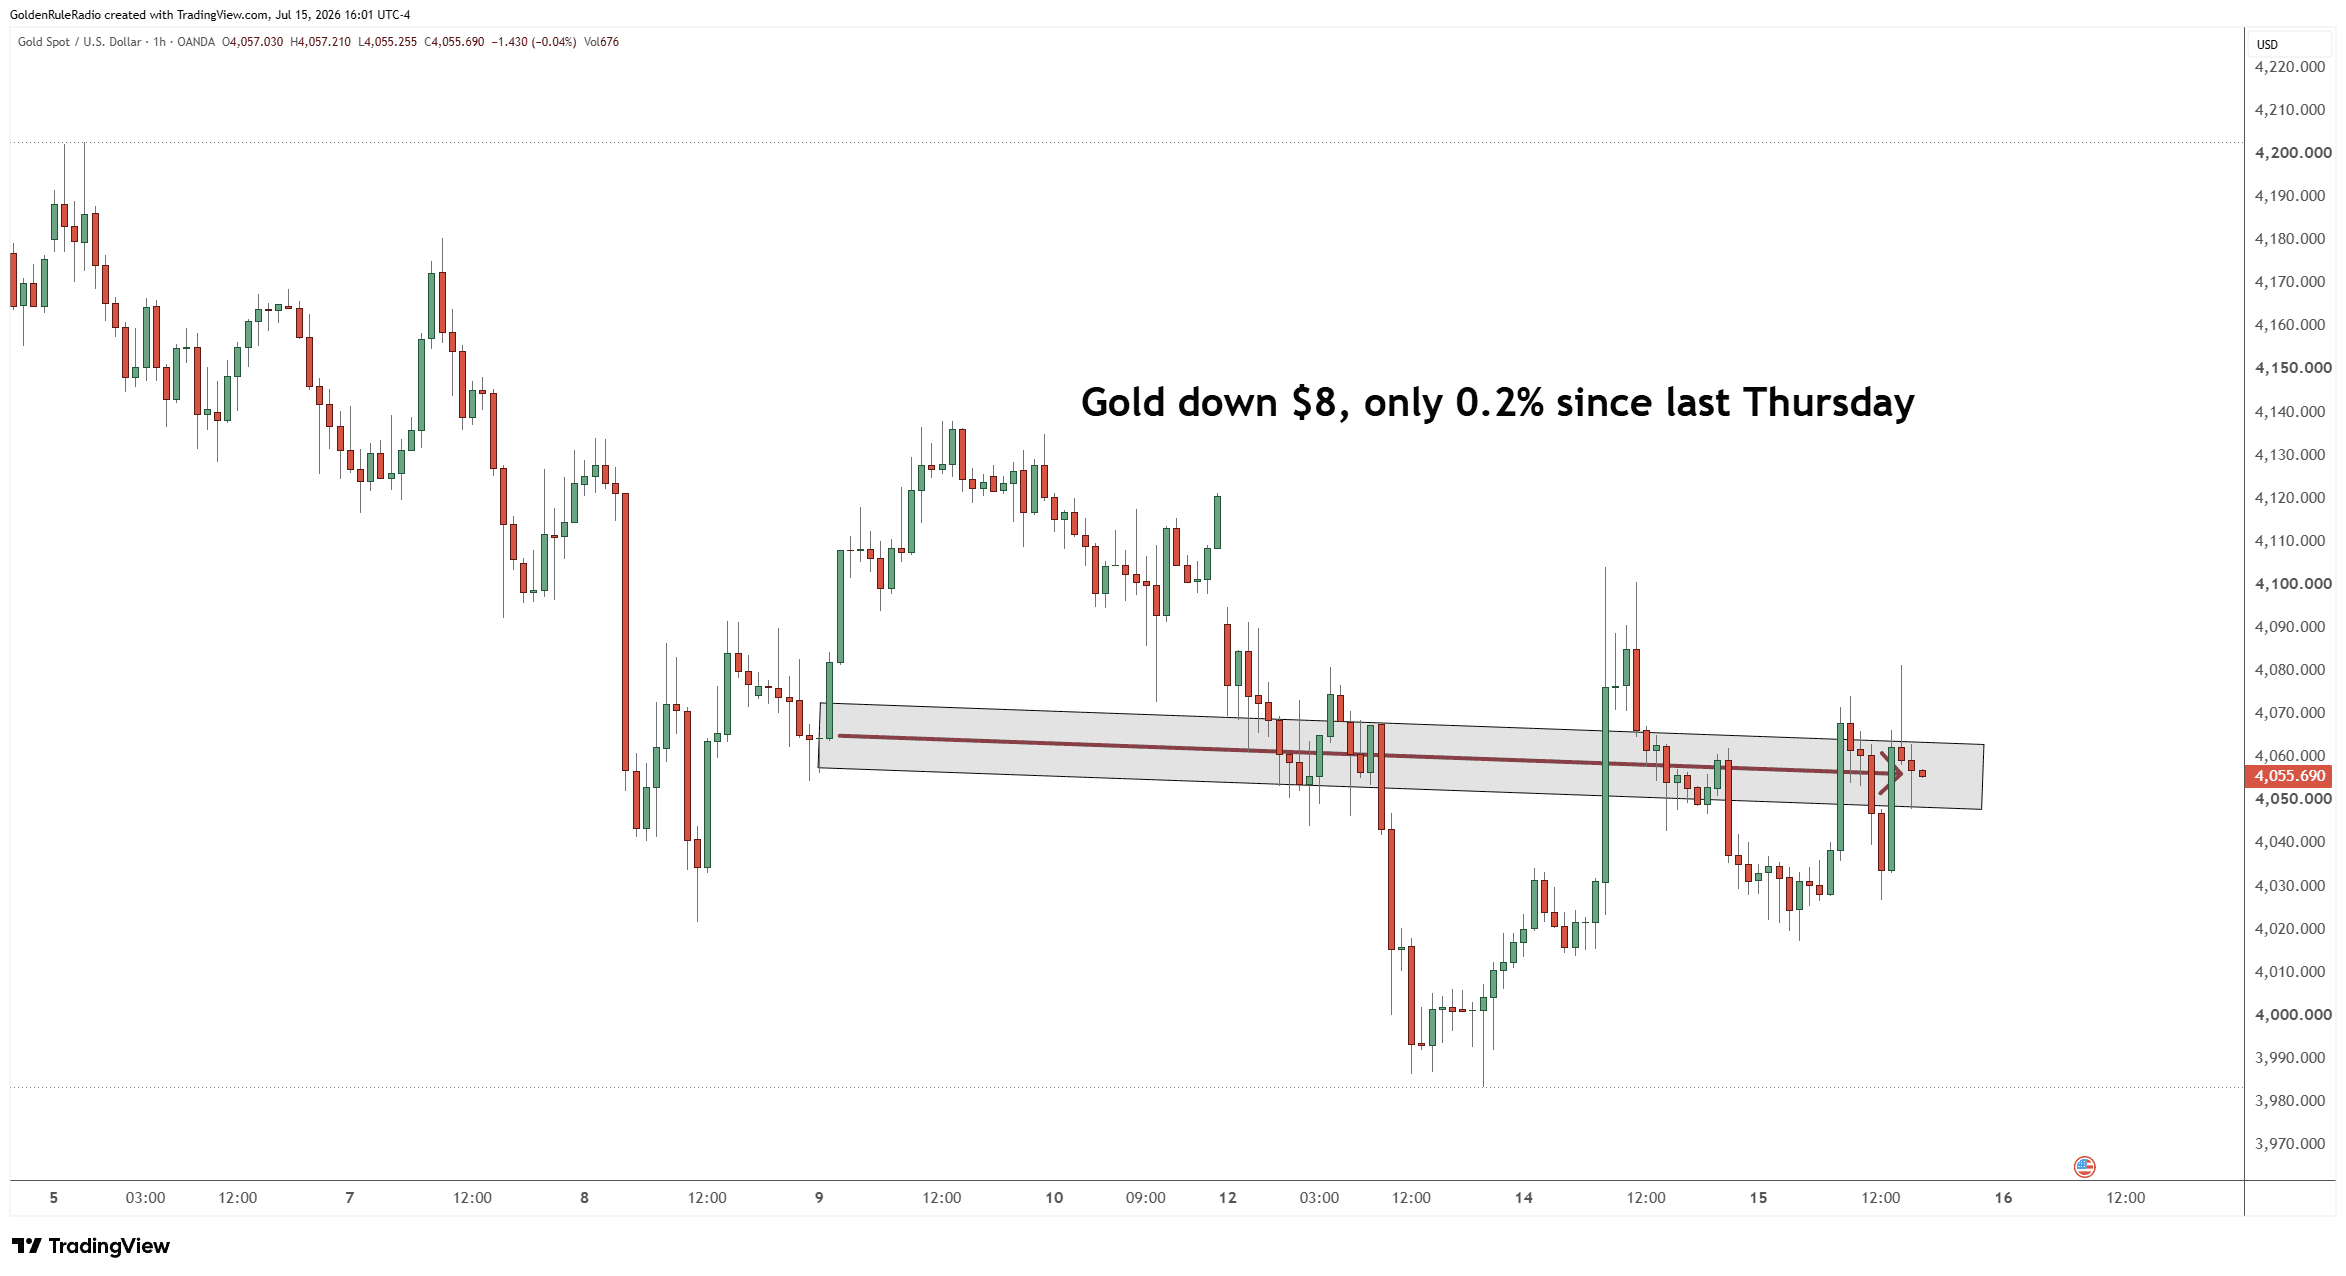 Silver is flat as well, doing its usual "little bit more than gold" — up about 4%, down about 3% — before finishing the week down just about eight cents. It's sitting in the same trading range we've been watching for weeks.
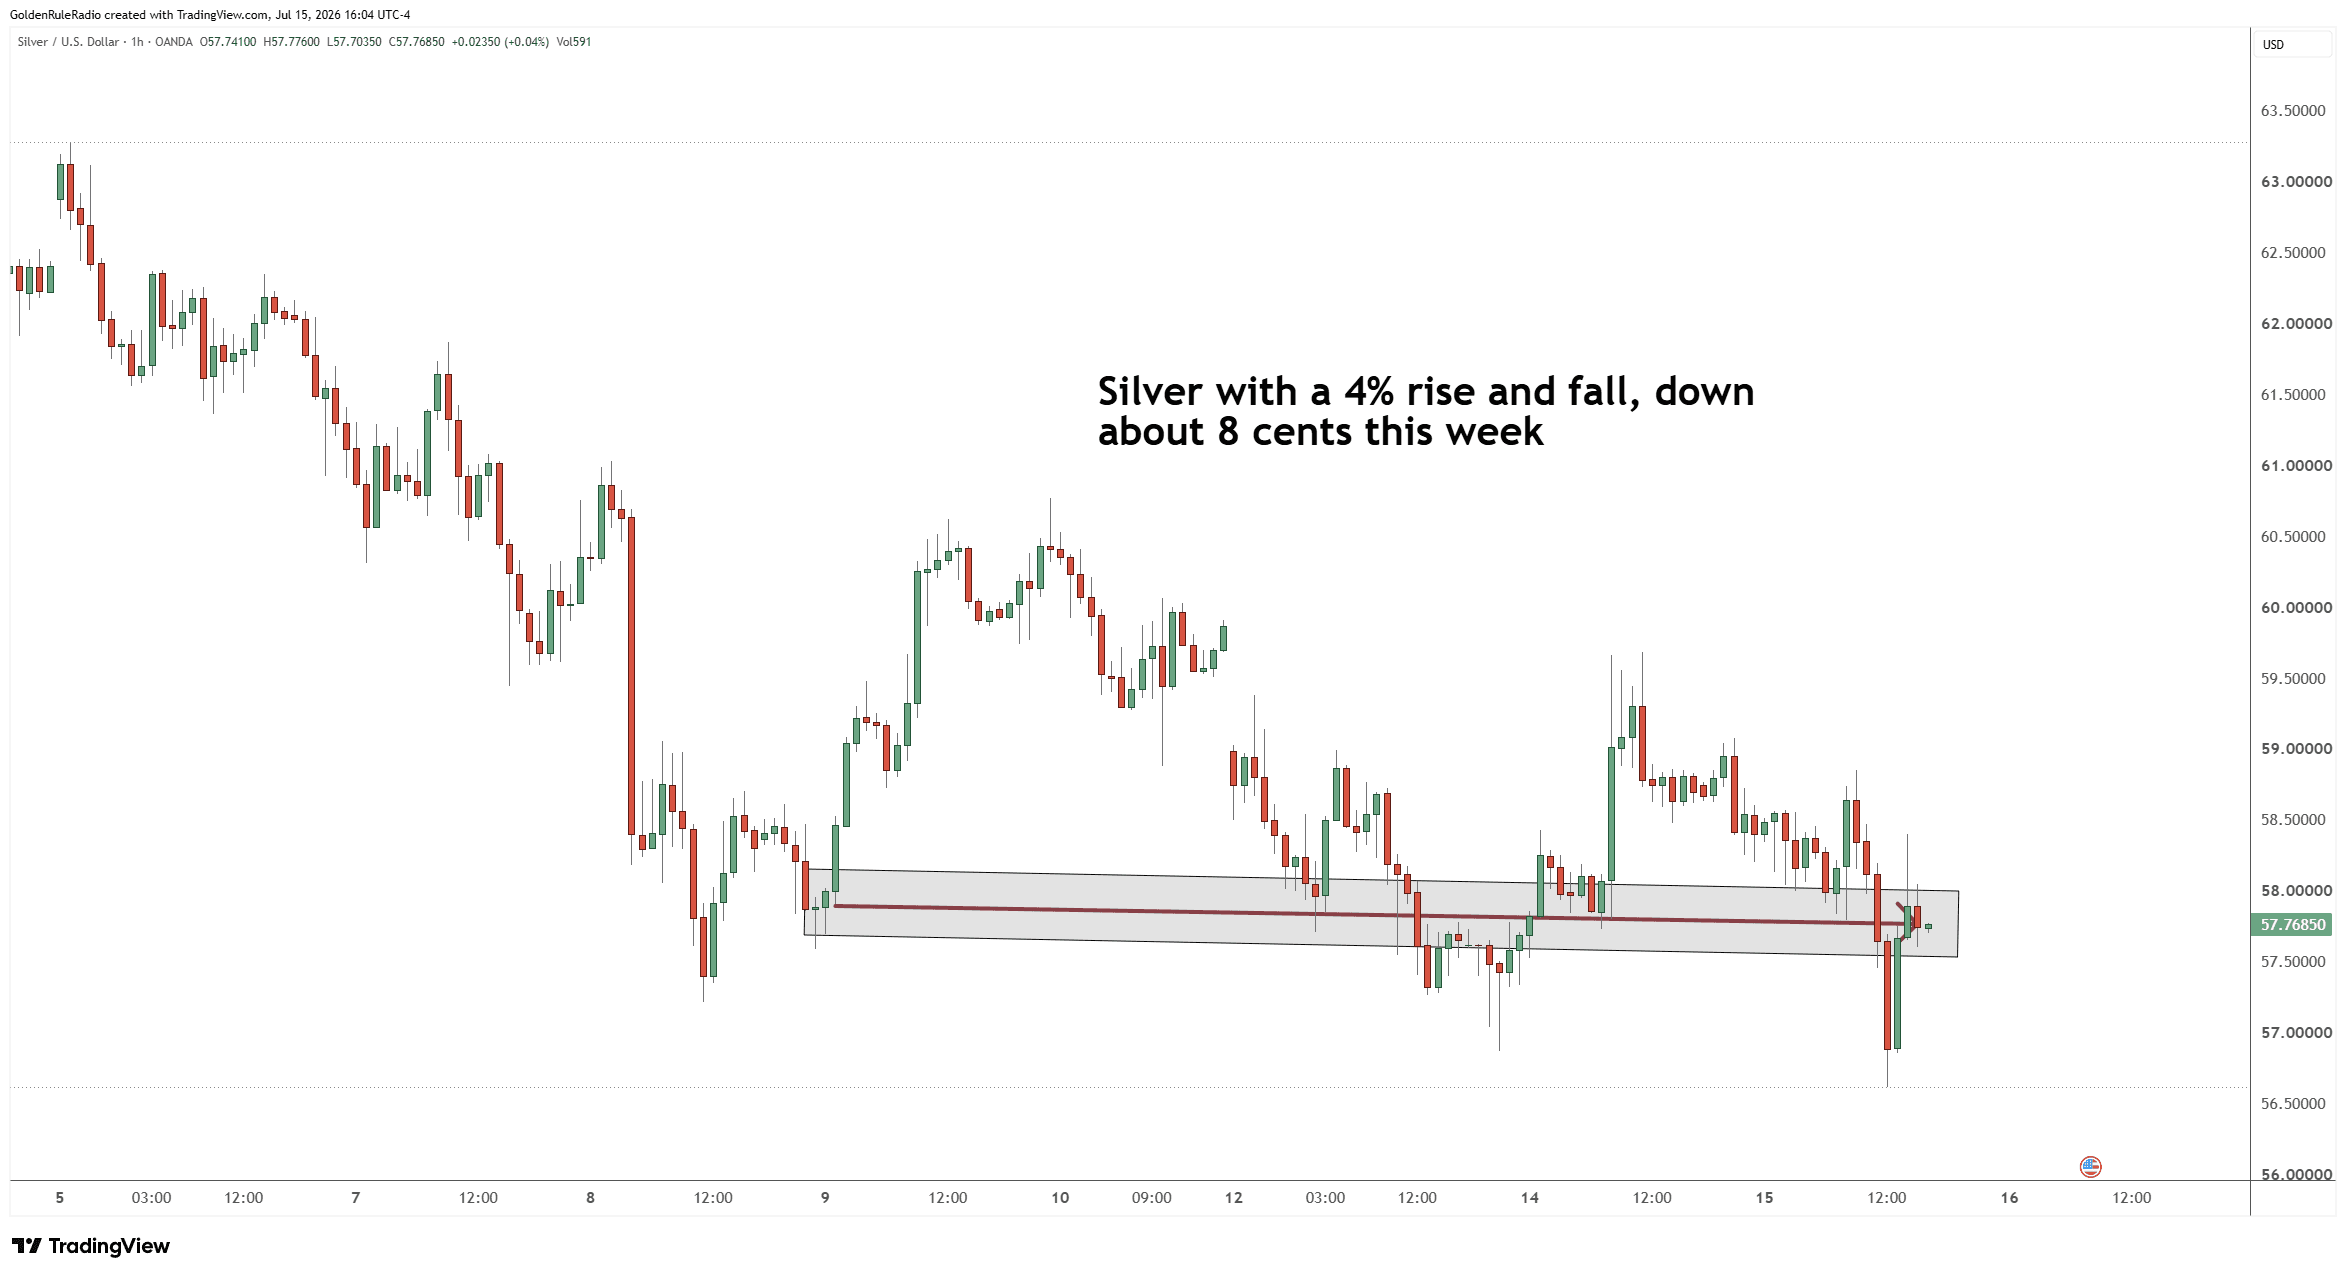 Platinum is the surprise of the week, up about 6% to $1,670. That's its highest level in roughly a month, and it's now pressing against a potential breakout point just above $1,700.
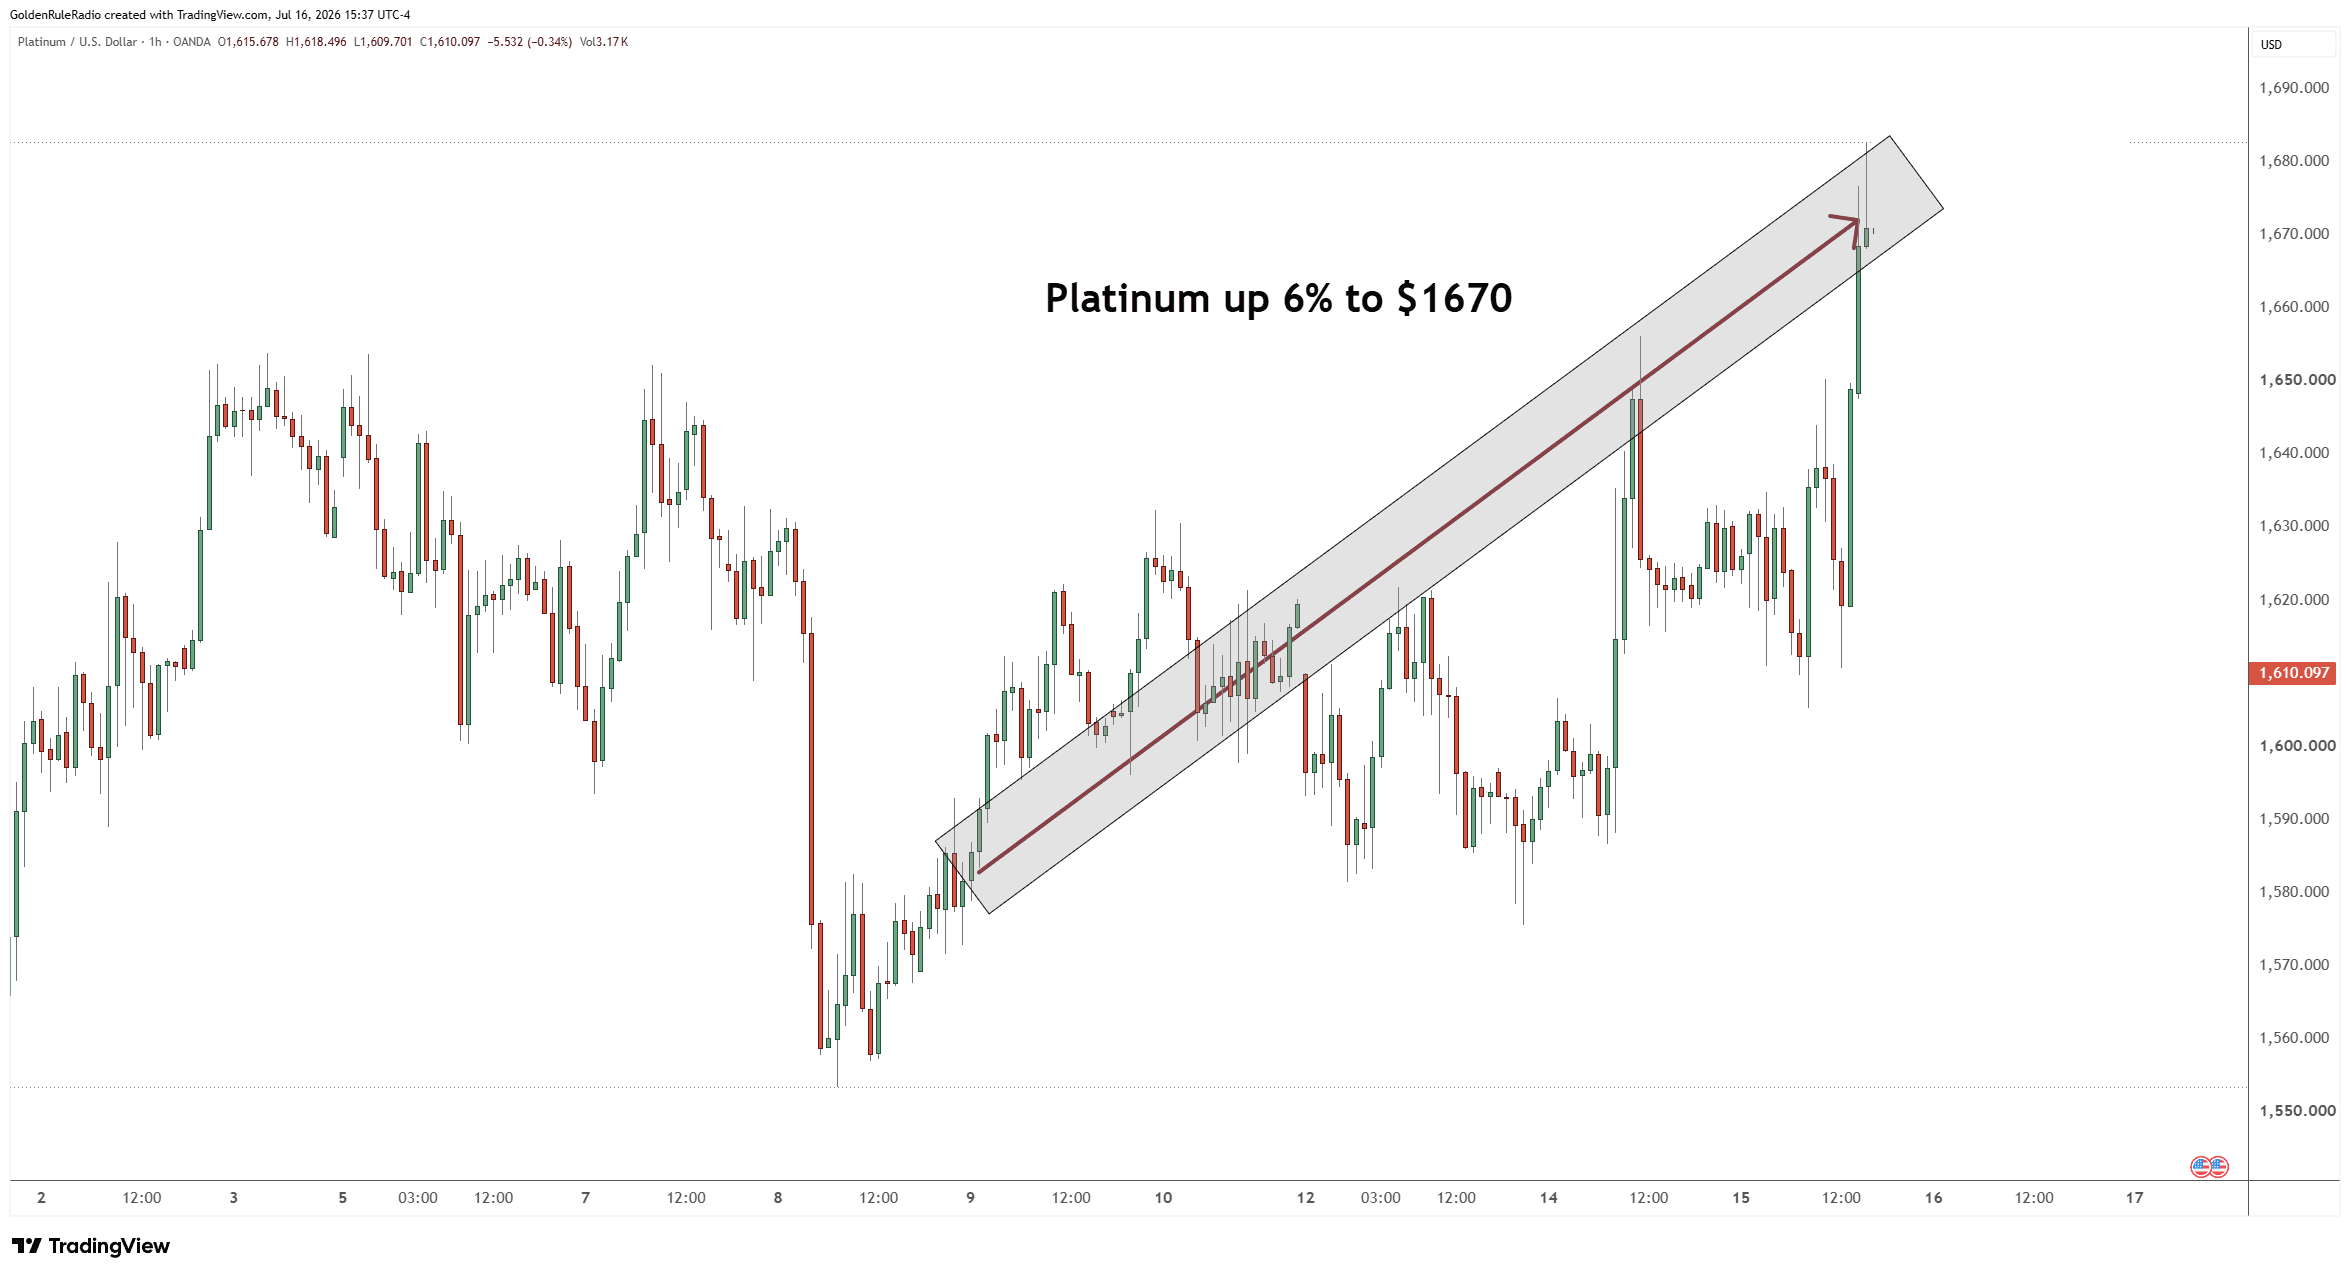 Palladium is up about 8.5% to $1,302. It’s back above the $1,300 mark, breaking a short-term interim high set back in June.
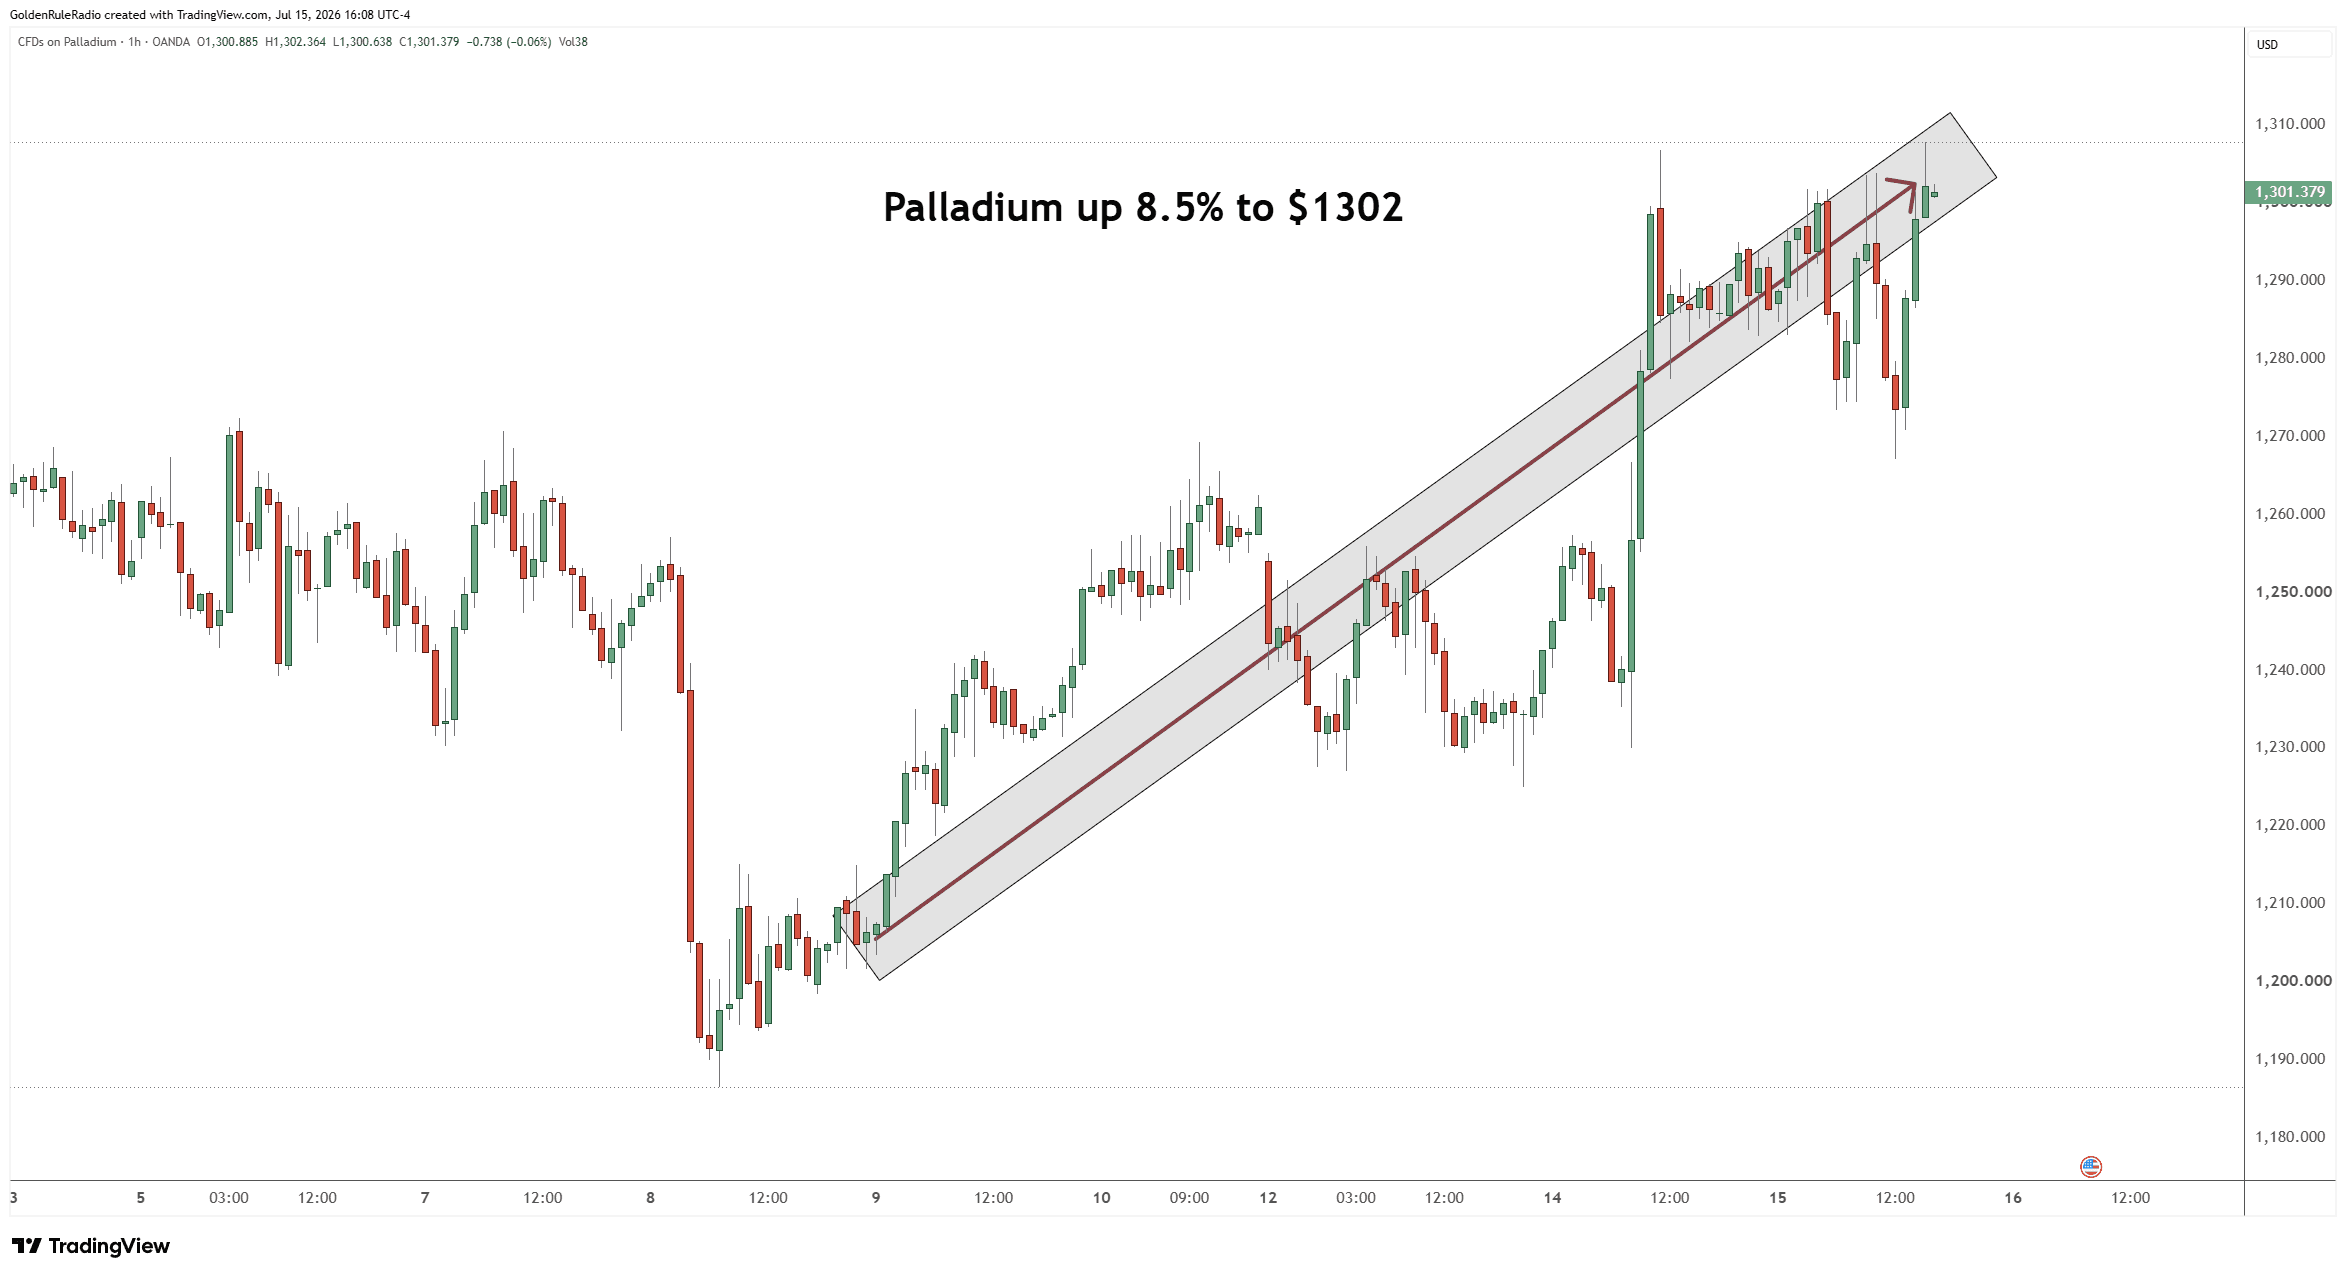 Looking over at the paper markets…The S&P 500 is up about 1% to 7,572. That's still below the all-time high set at the beginning of June — the index is knocking on that door again after failing to reclaim it in mid-June.
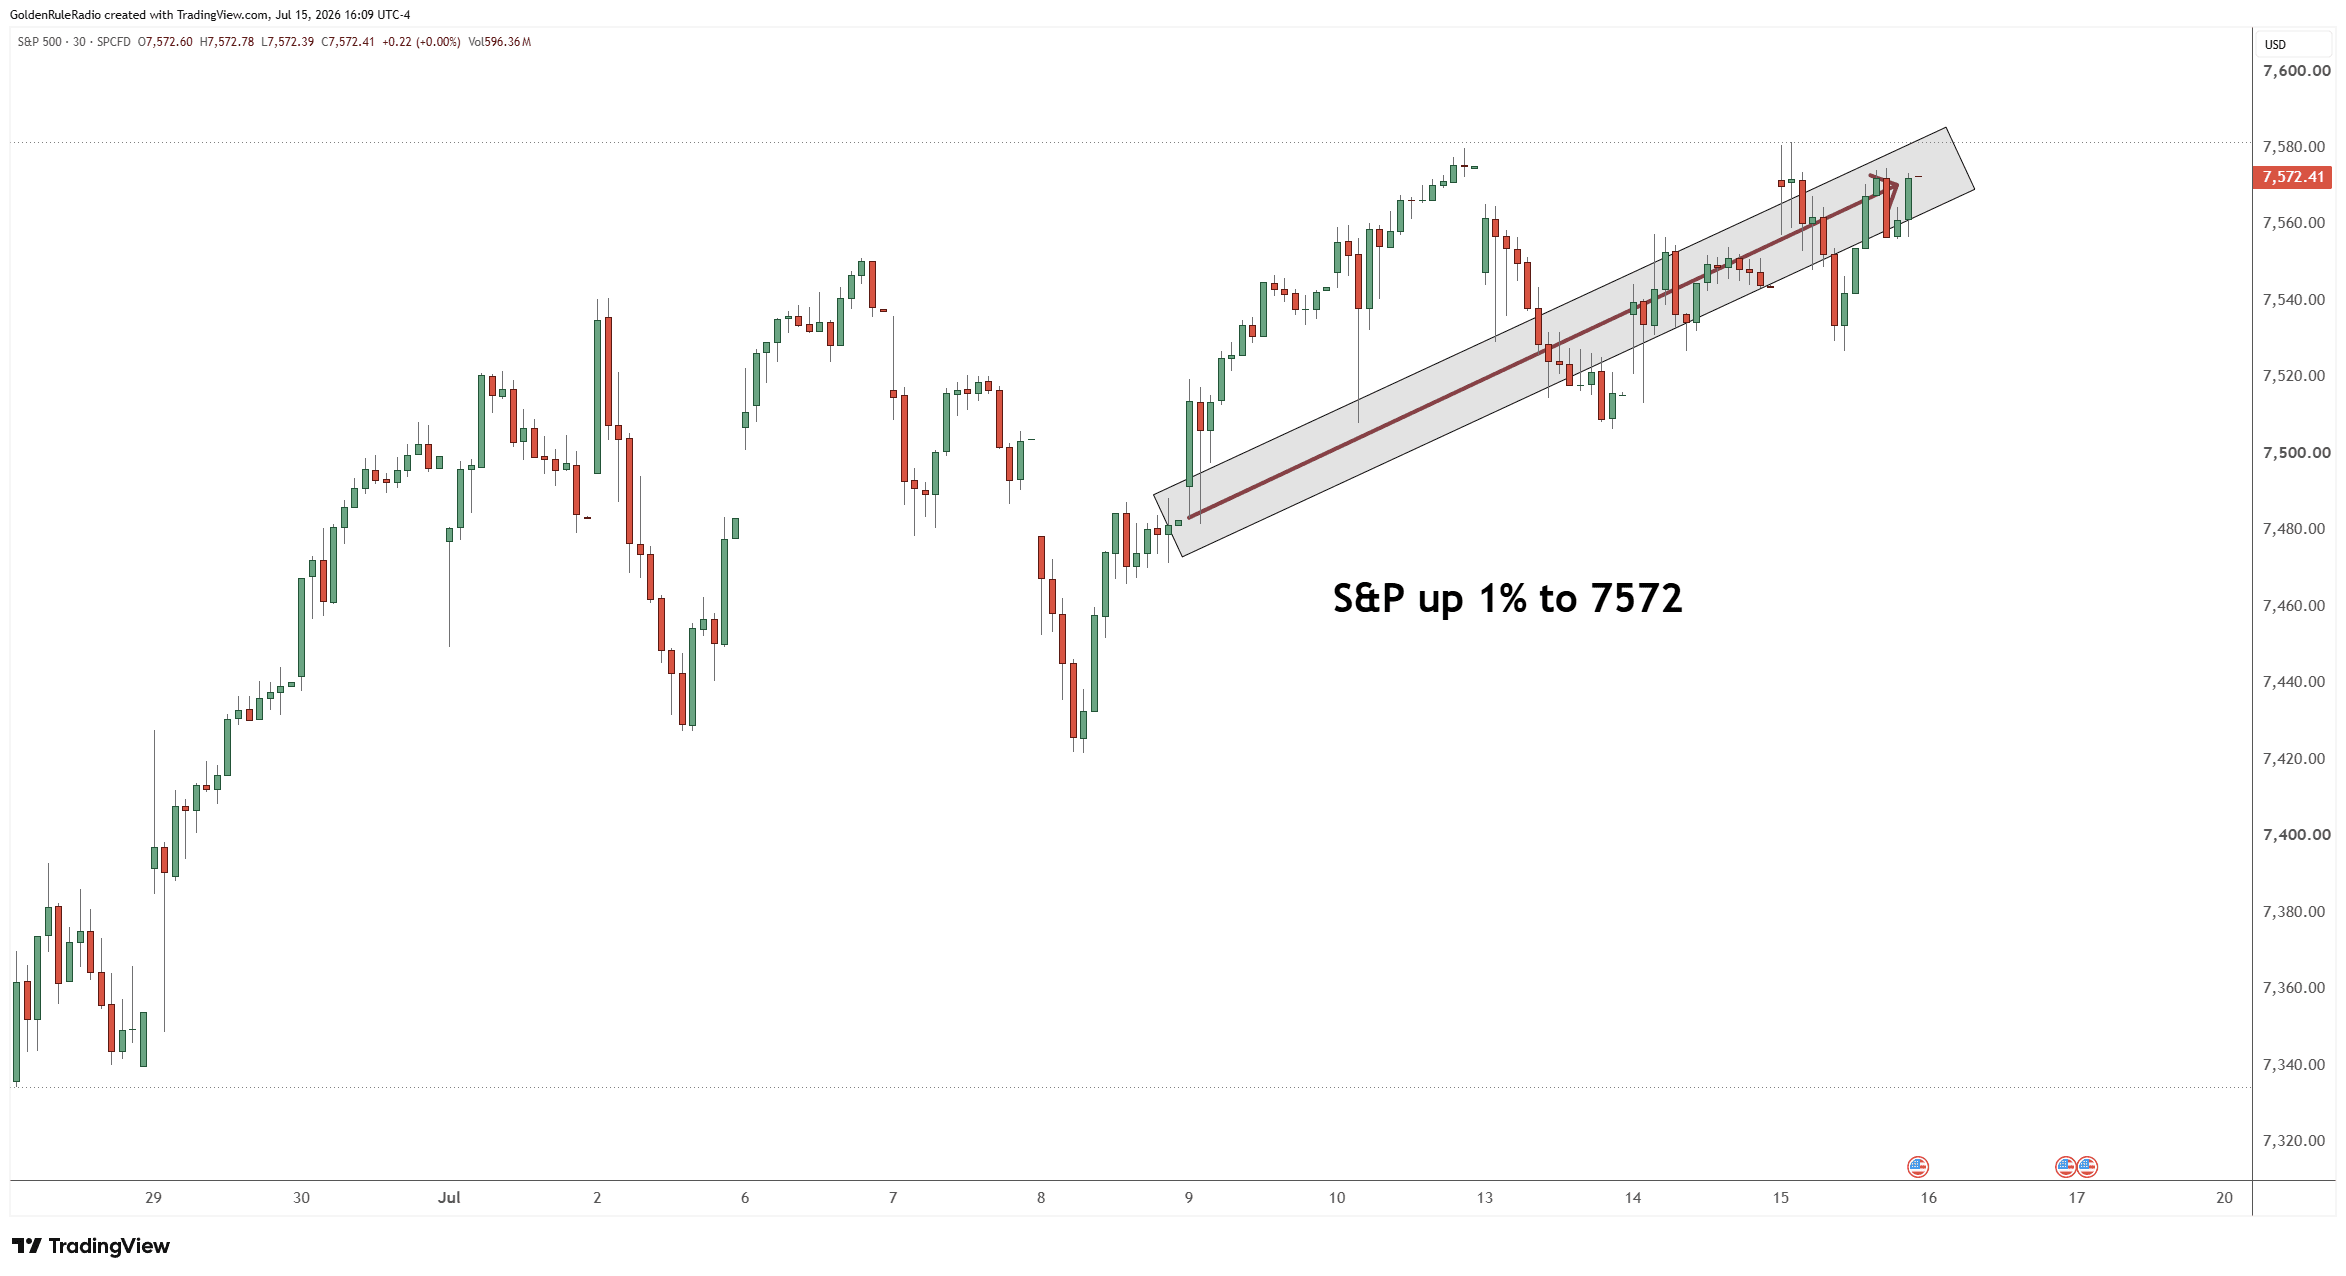 The US Dollar Index is down about 0.5%, breaking a short-term floor on a hard dive and now sitting around 100.5.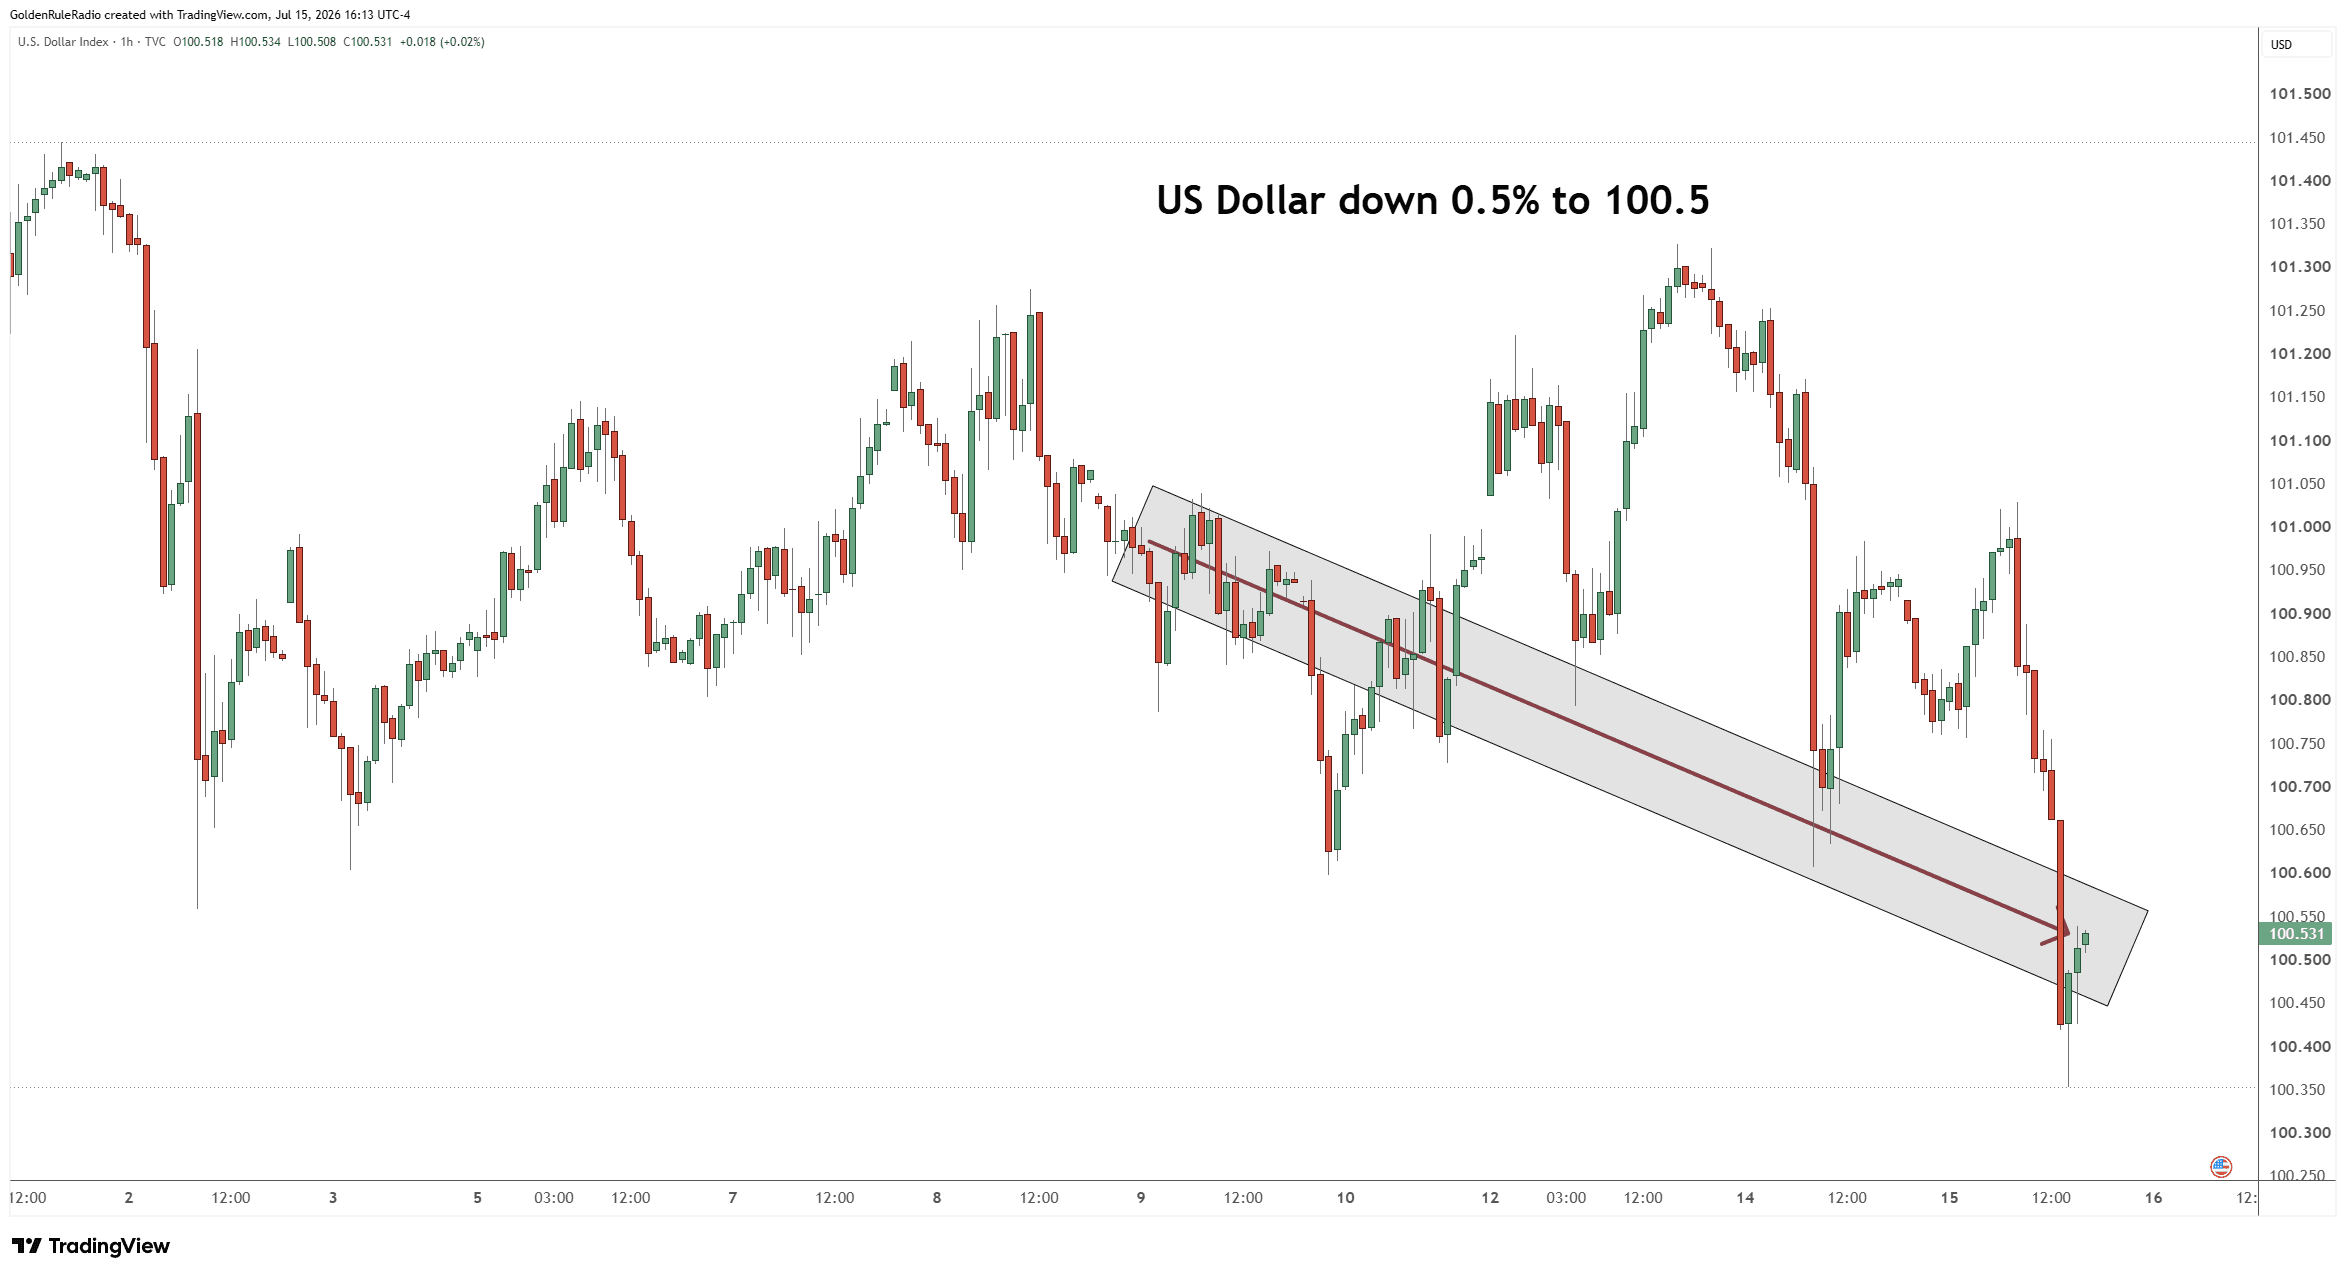

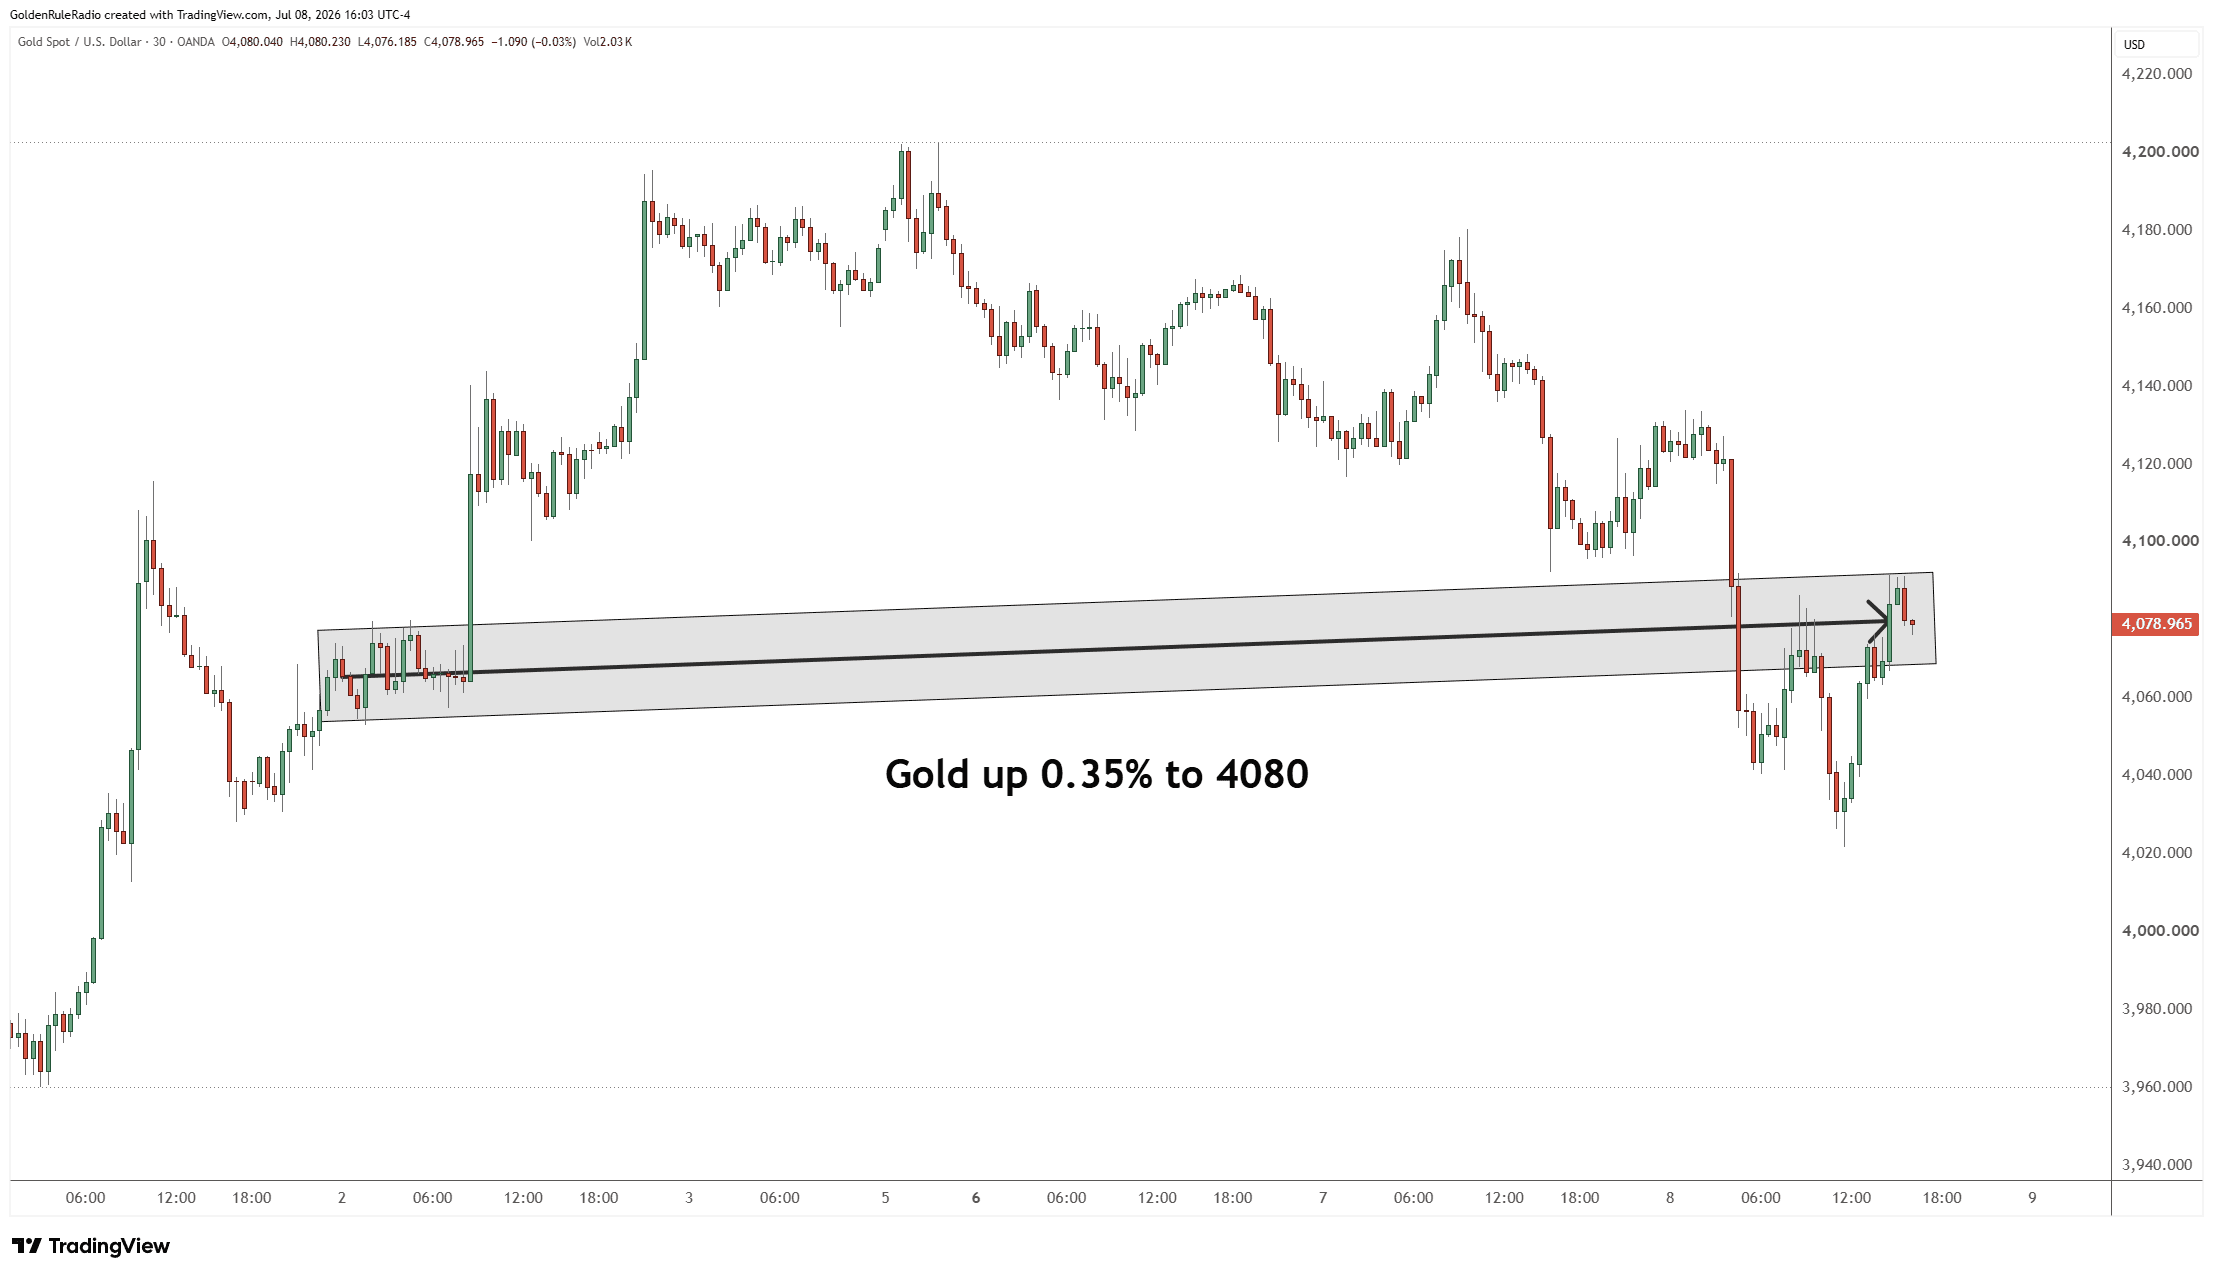 The price of silver is down 3%, currently at $58.40 — the biggest mover on the board this week, and not in the direction silver bulls wanted.
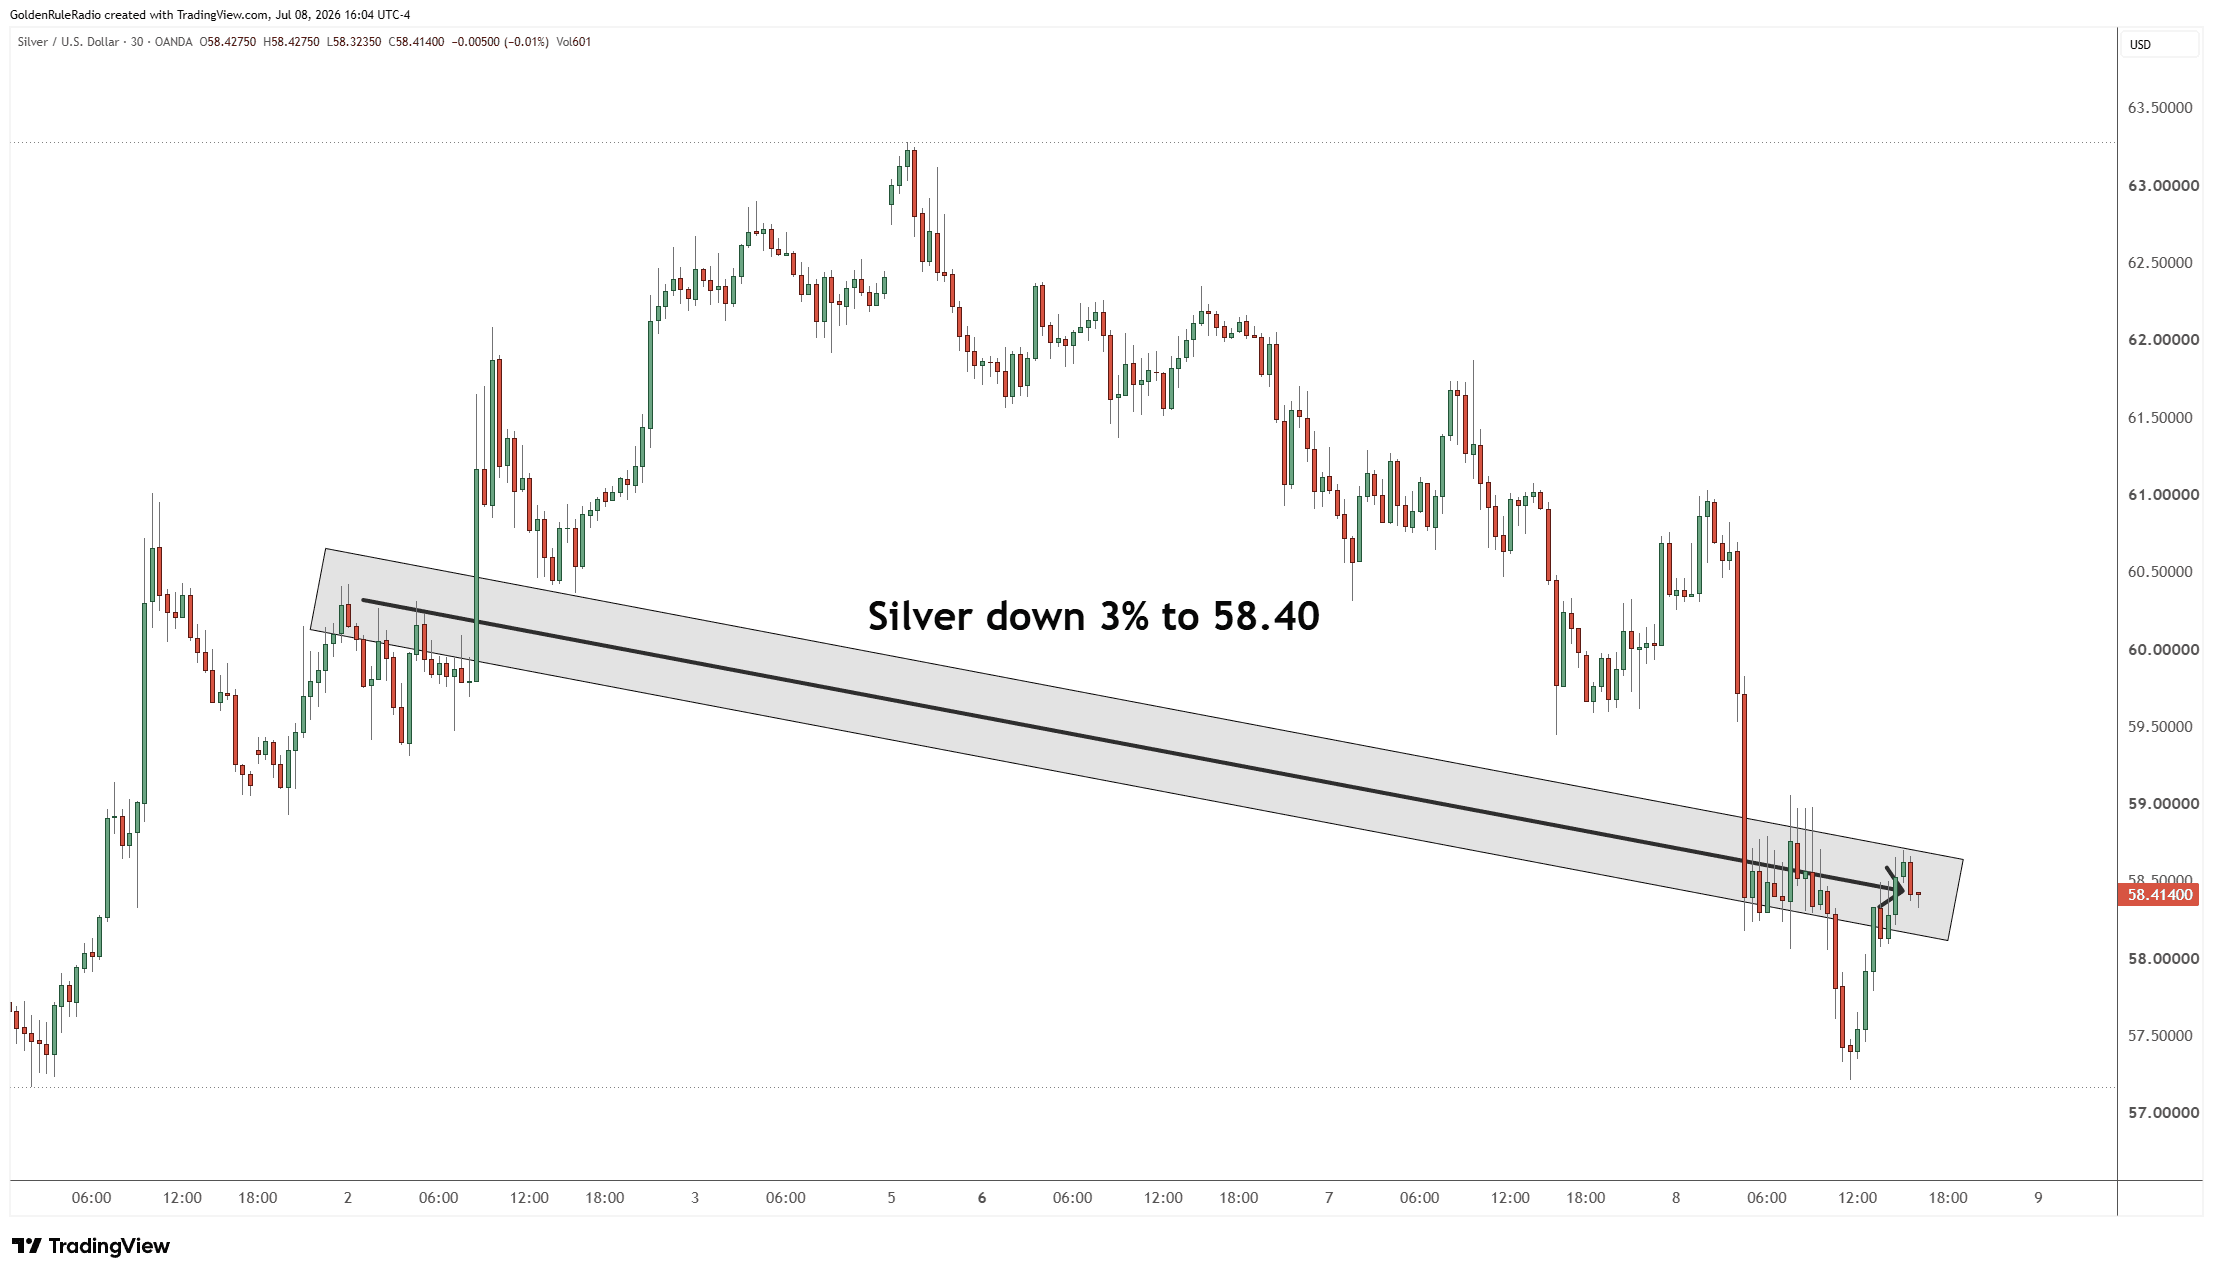 Platinum is down 1.8% at $1,575, still holding under the $1,600 mark.
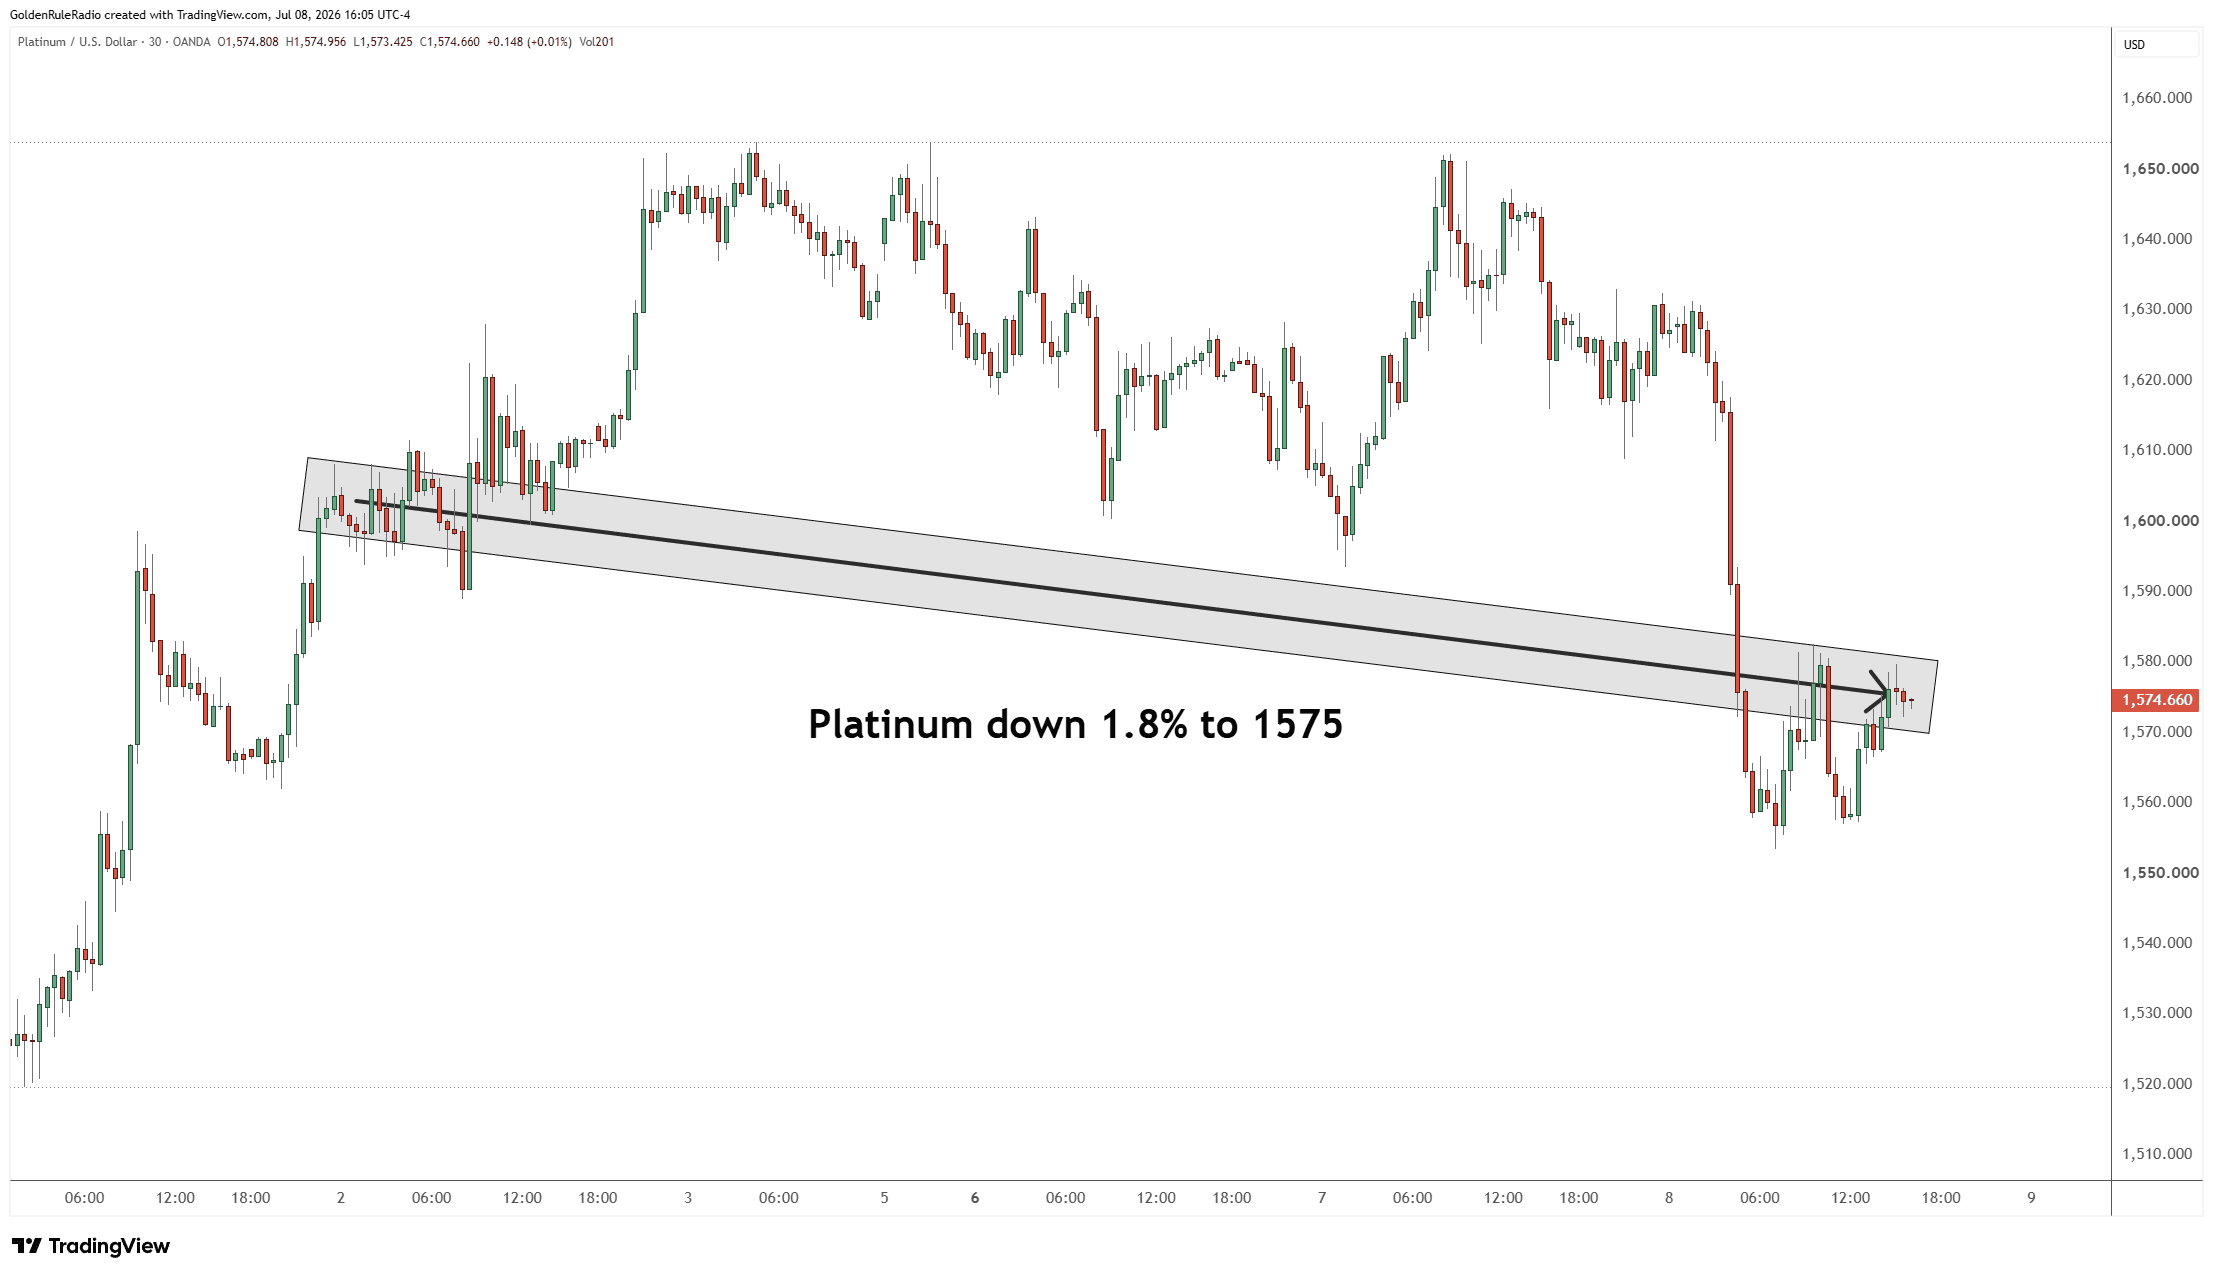 Palladium is essentially flat, down a couple of dollars to $1,206.
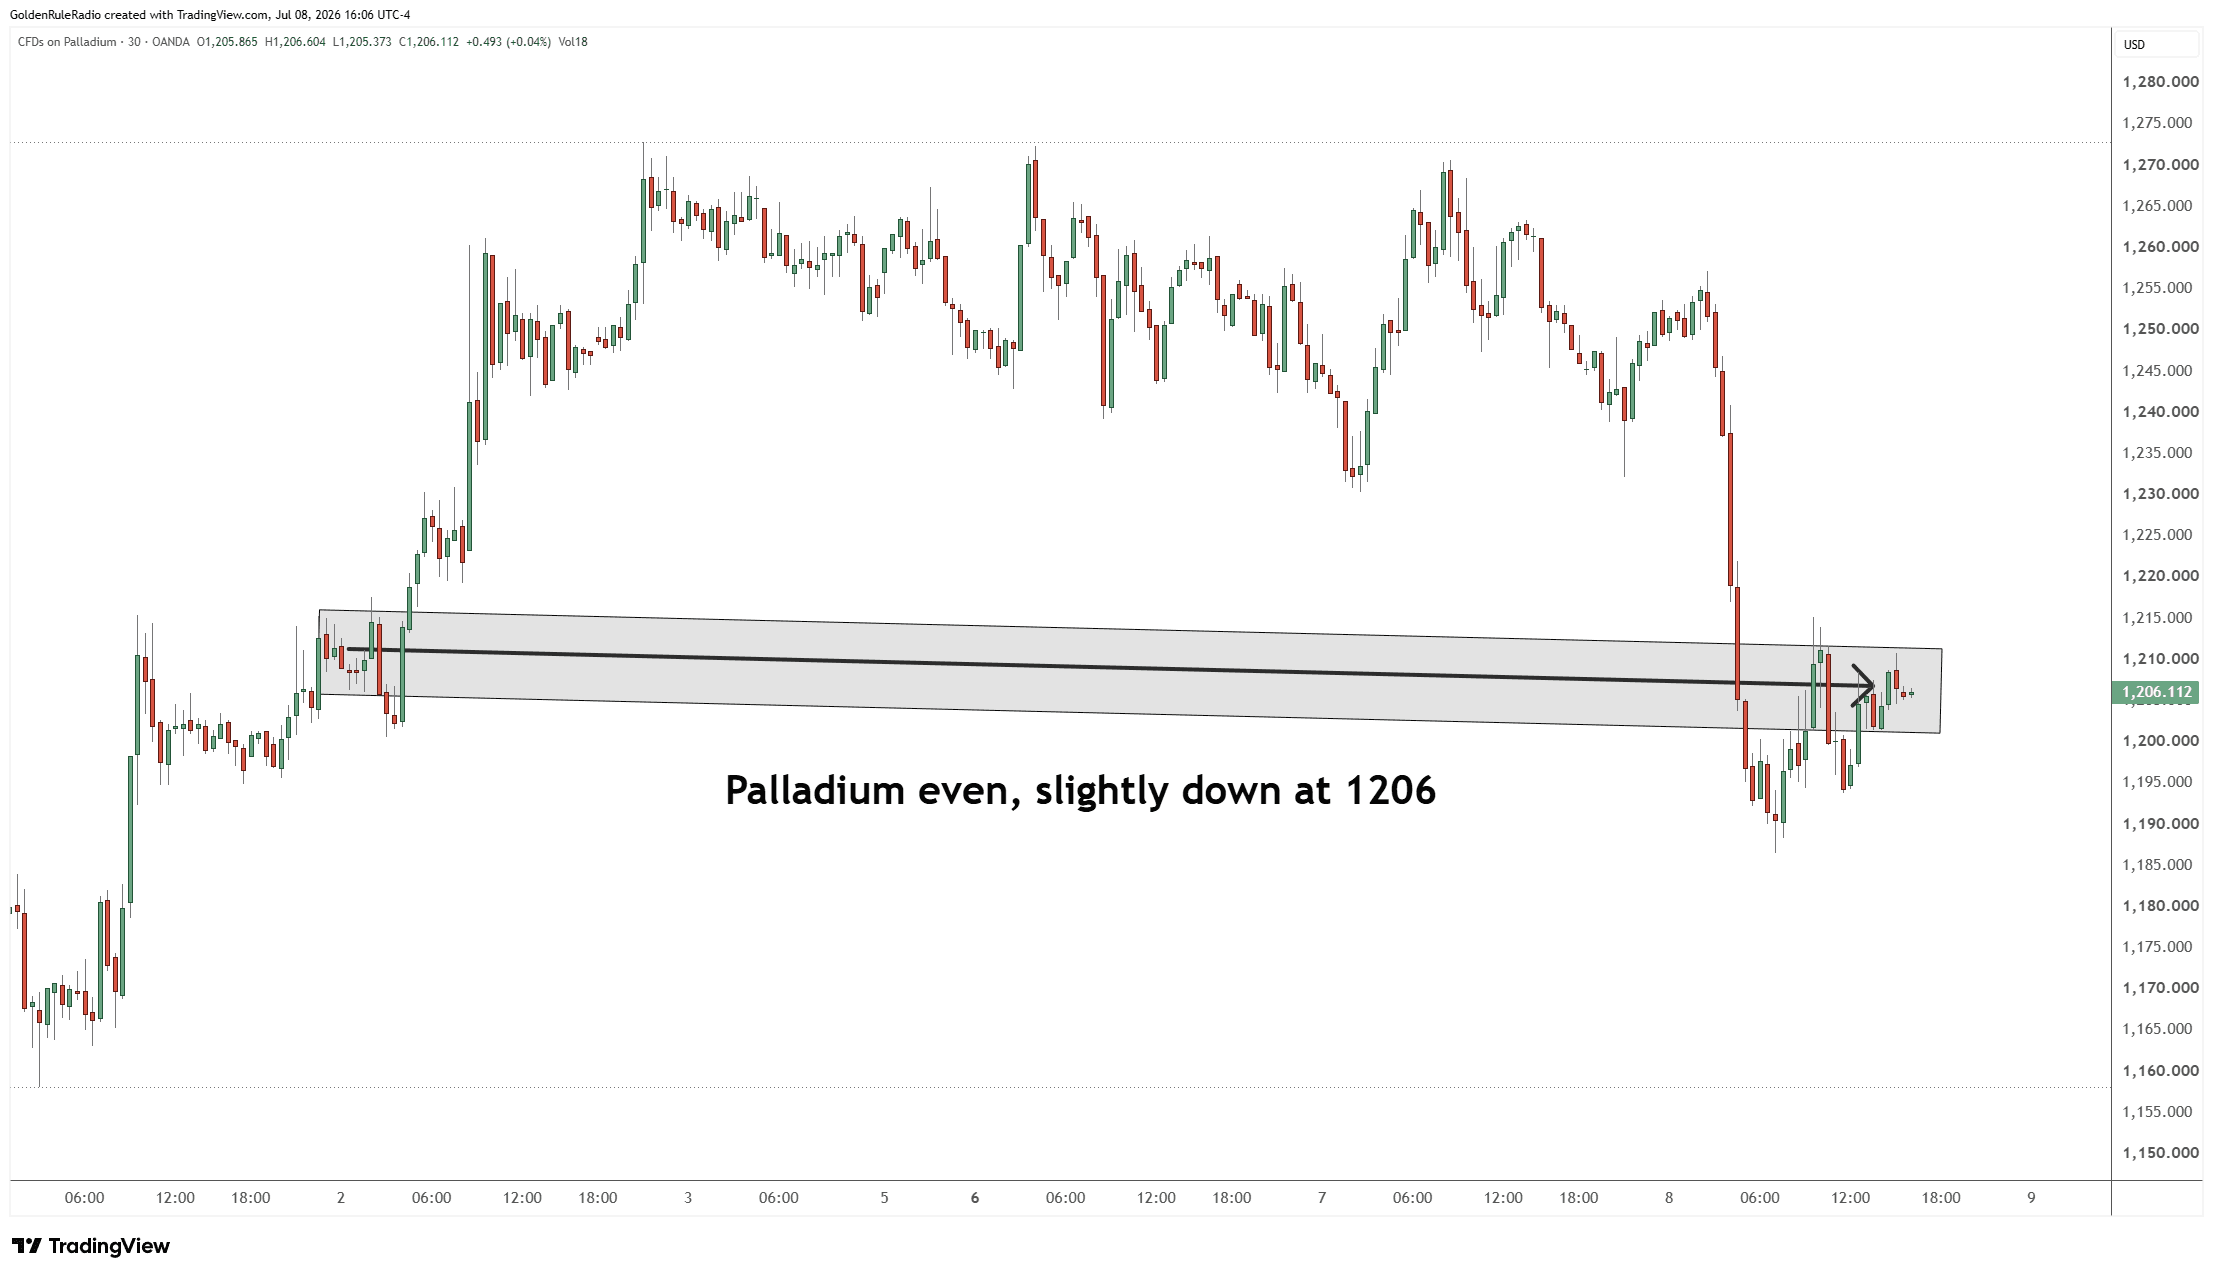 Looking over at the paper markets…The S&P 500 is down about 0.33% to 7,482.
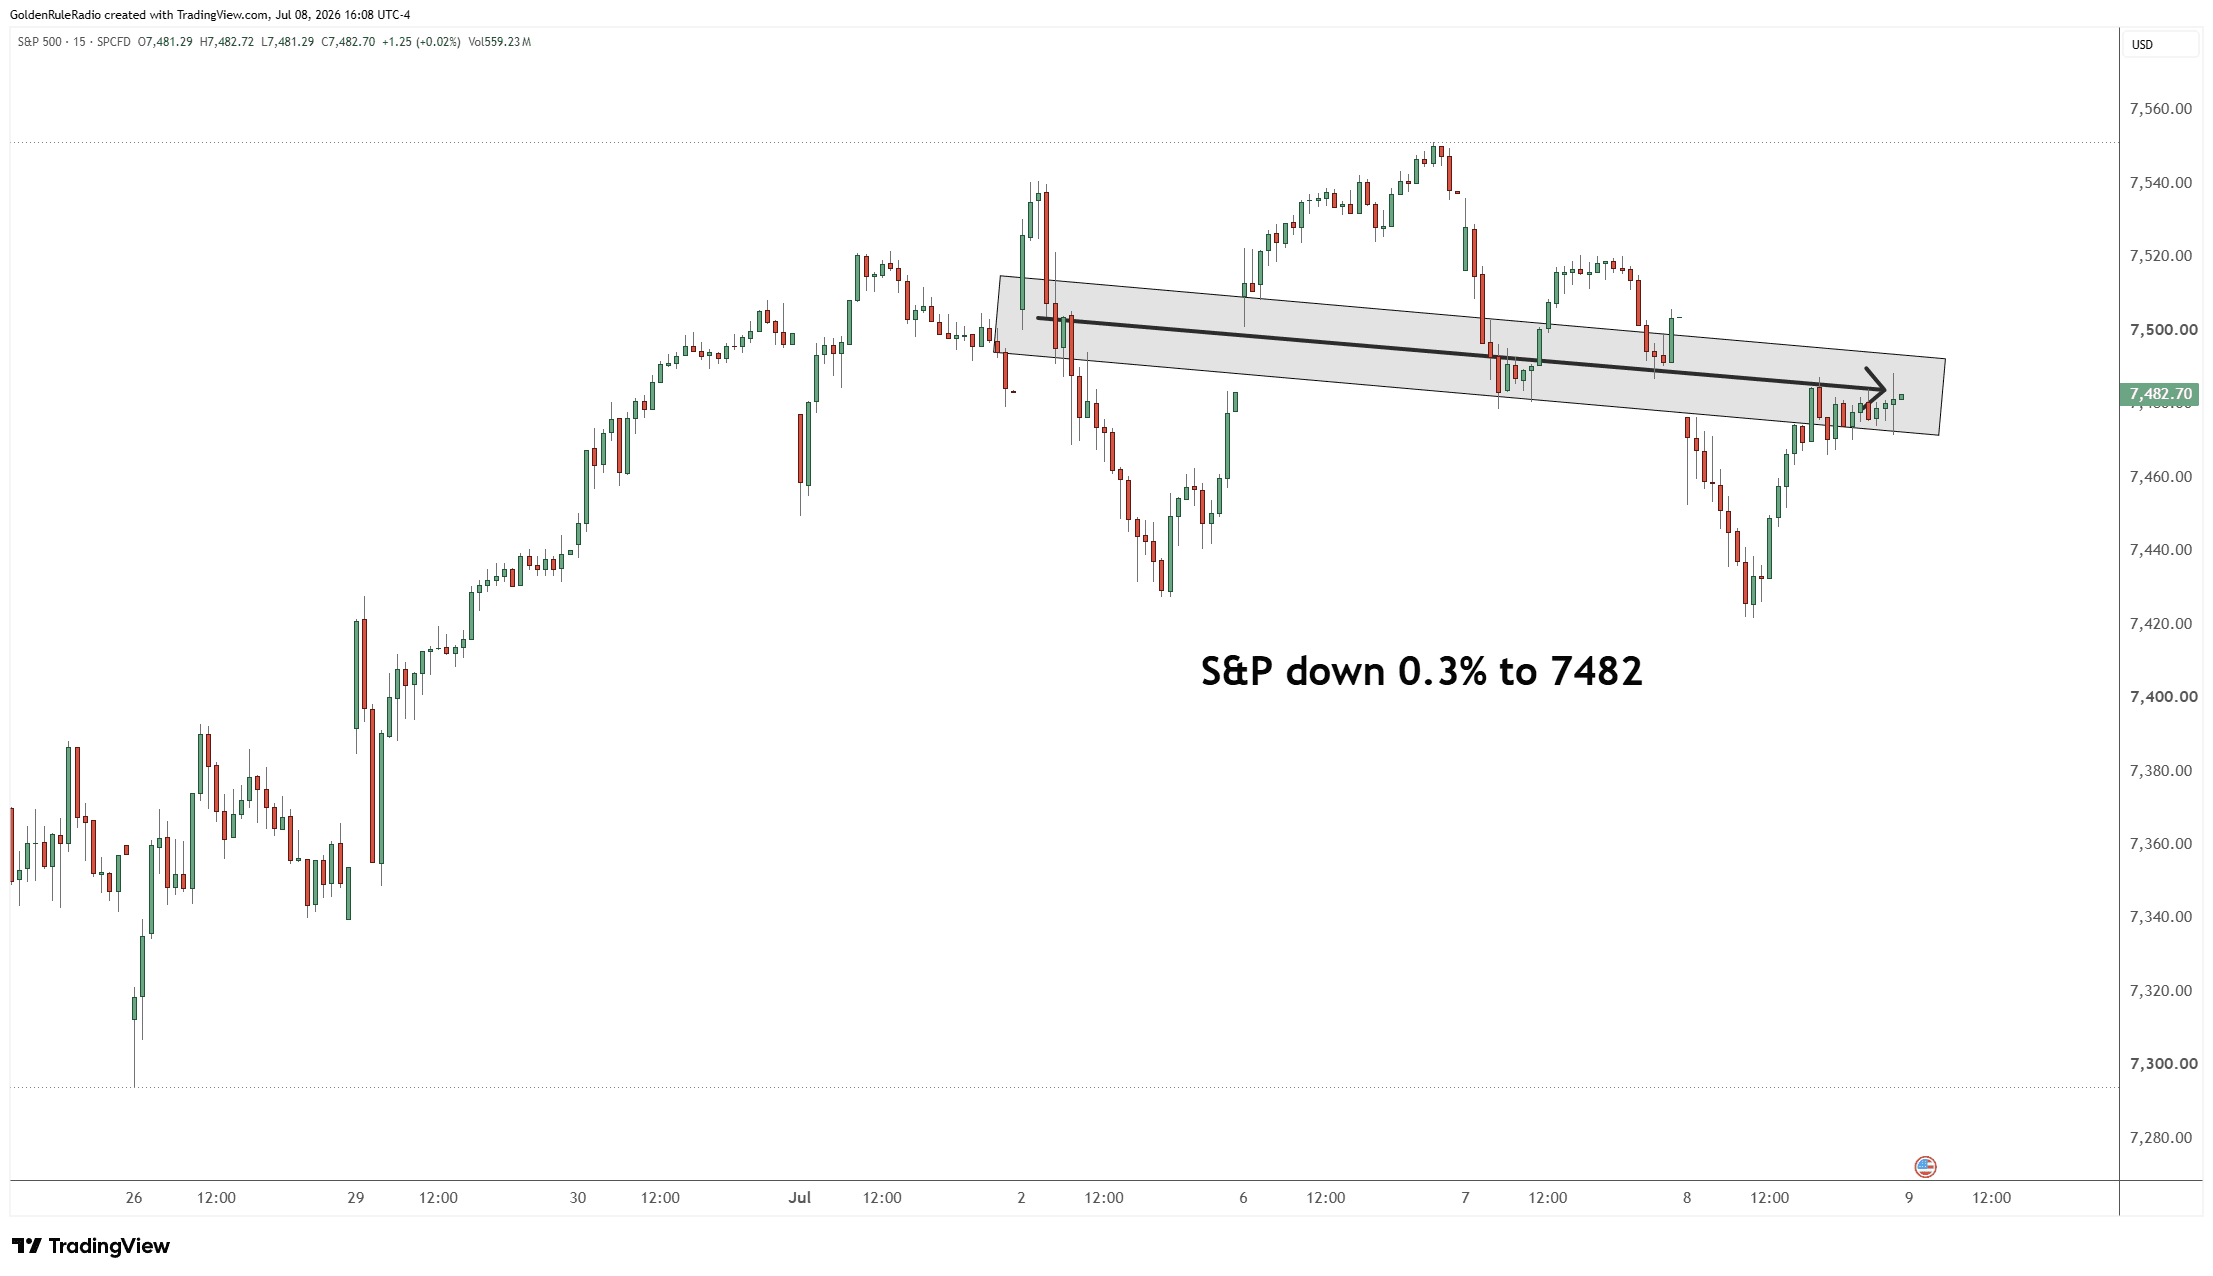 And the US Dollar Index is down 0.35%, sitting right around 101 — though it has been climbing over the last several hours.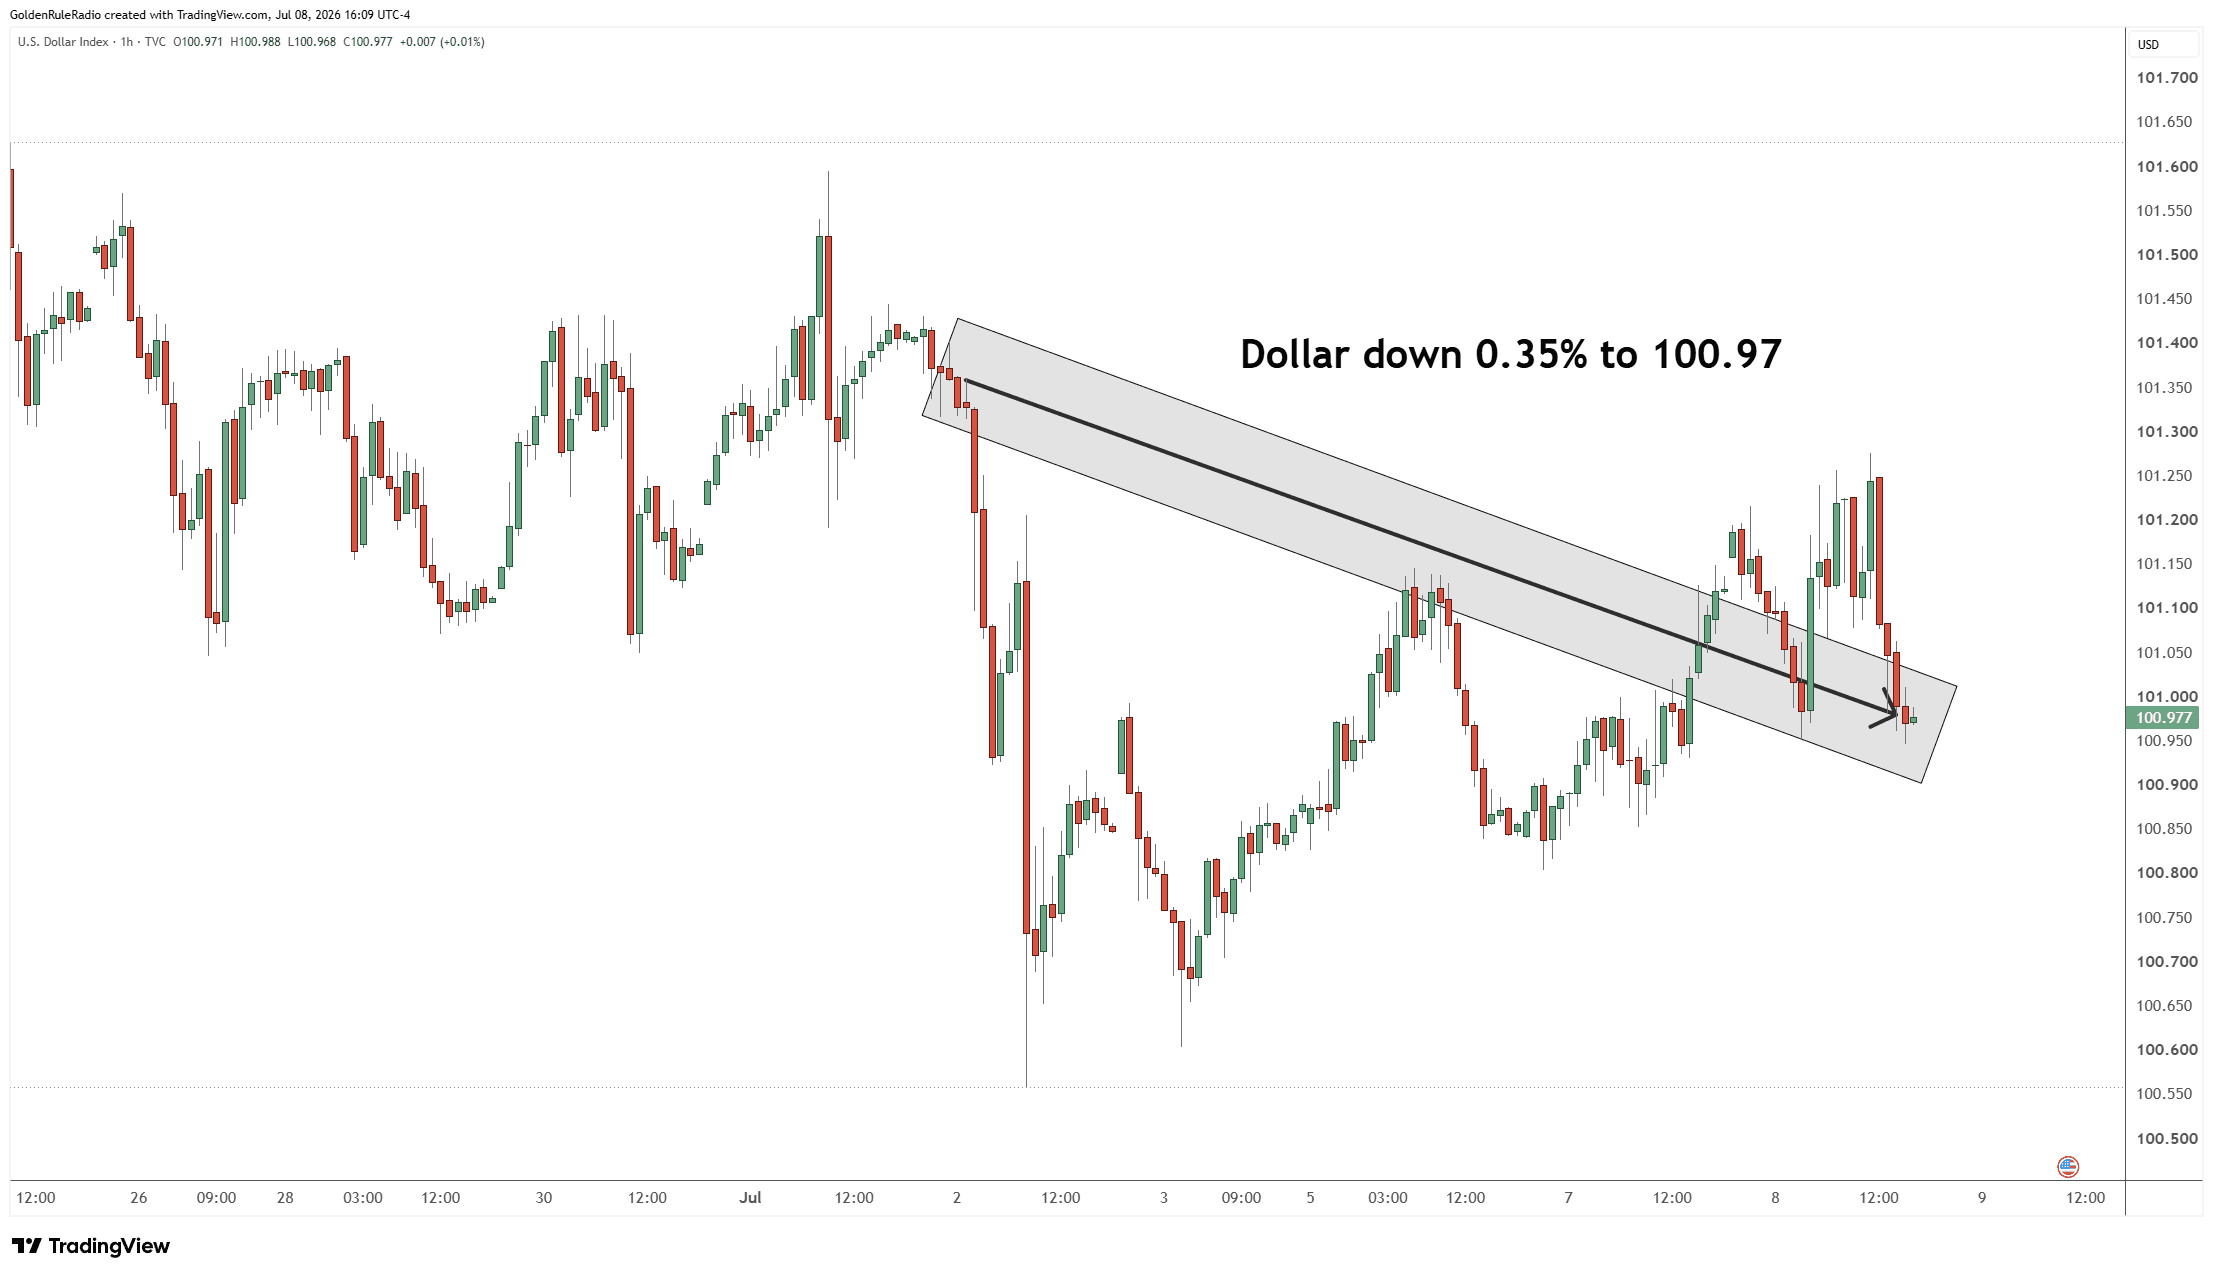

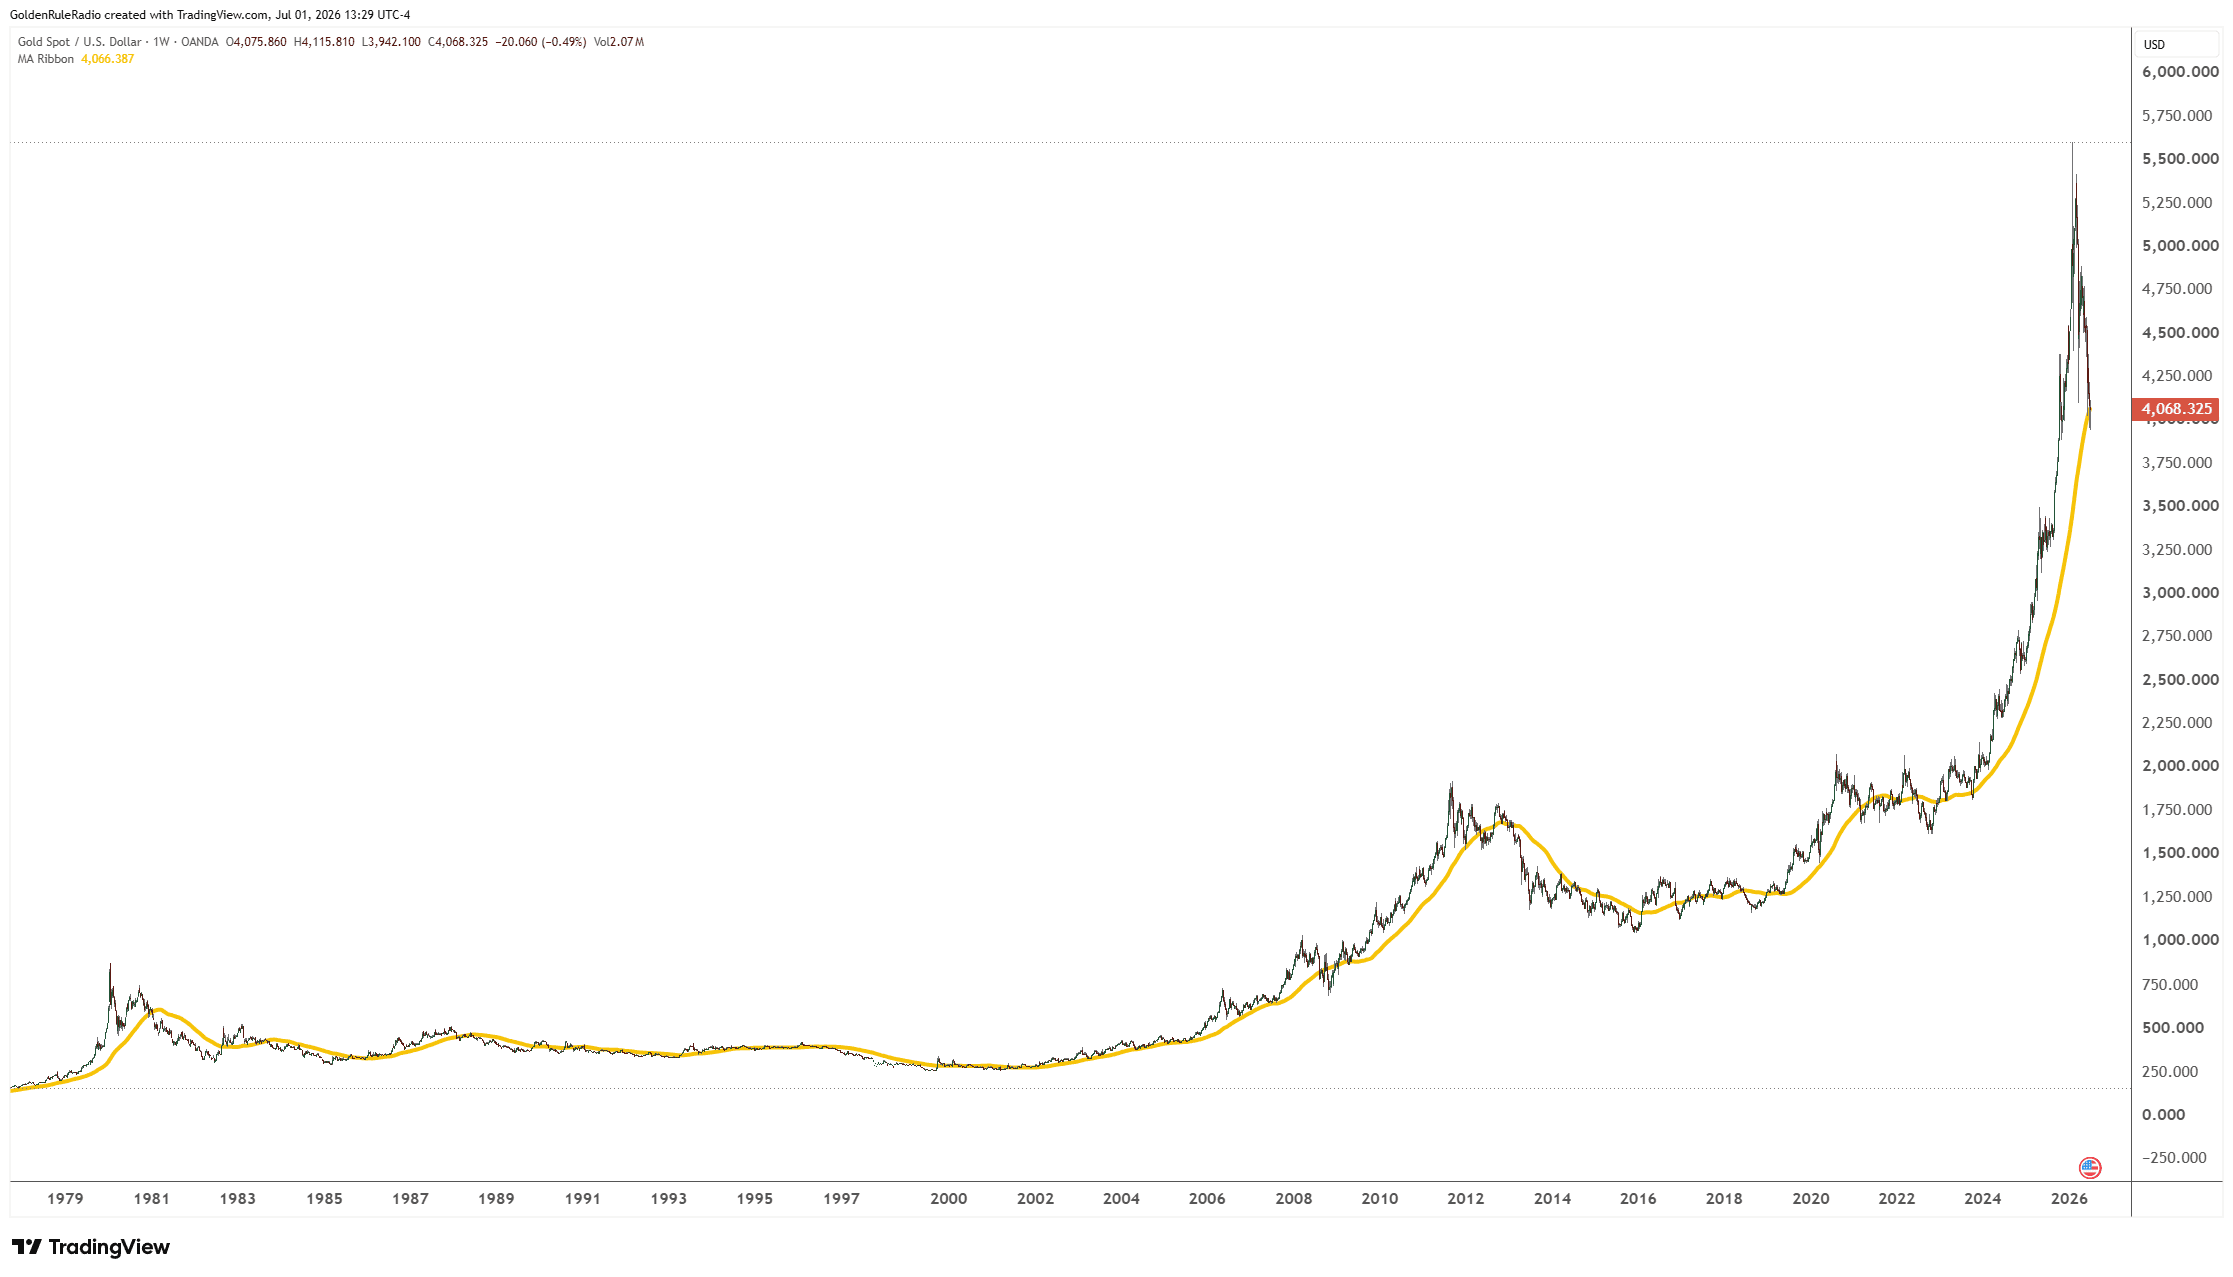 The price of silver is up 5.7%, currently at $60 and flirting with that level again after briefly dipping below it last week.
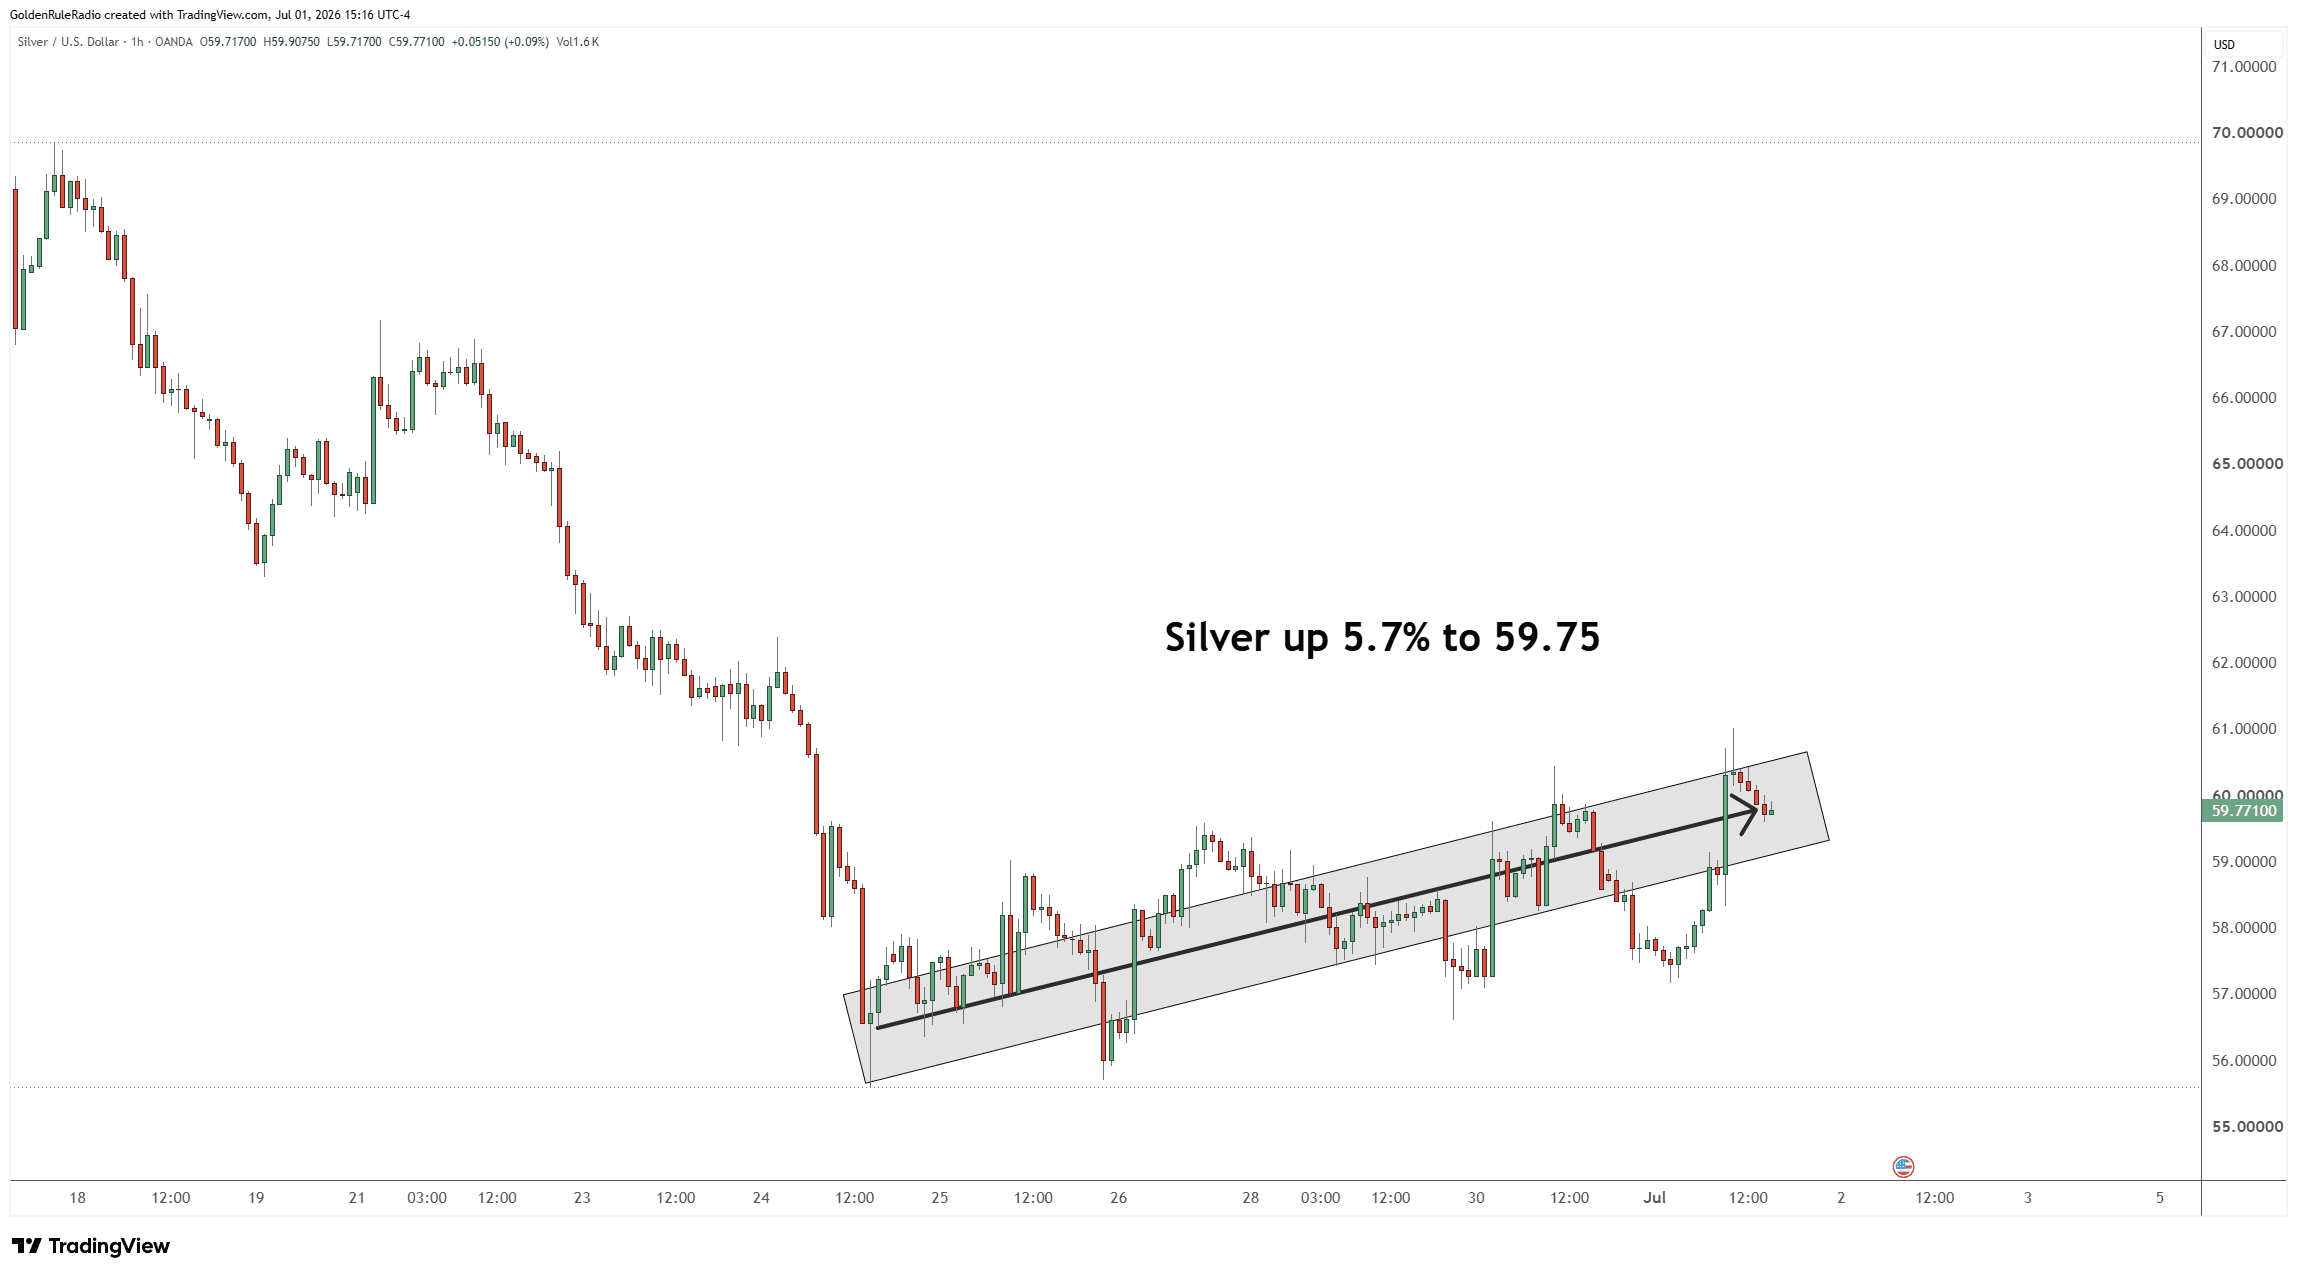 Platinum is up about 2%, sitting at $1,575, still under the $1,600 mark.
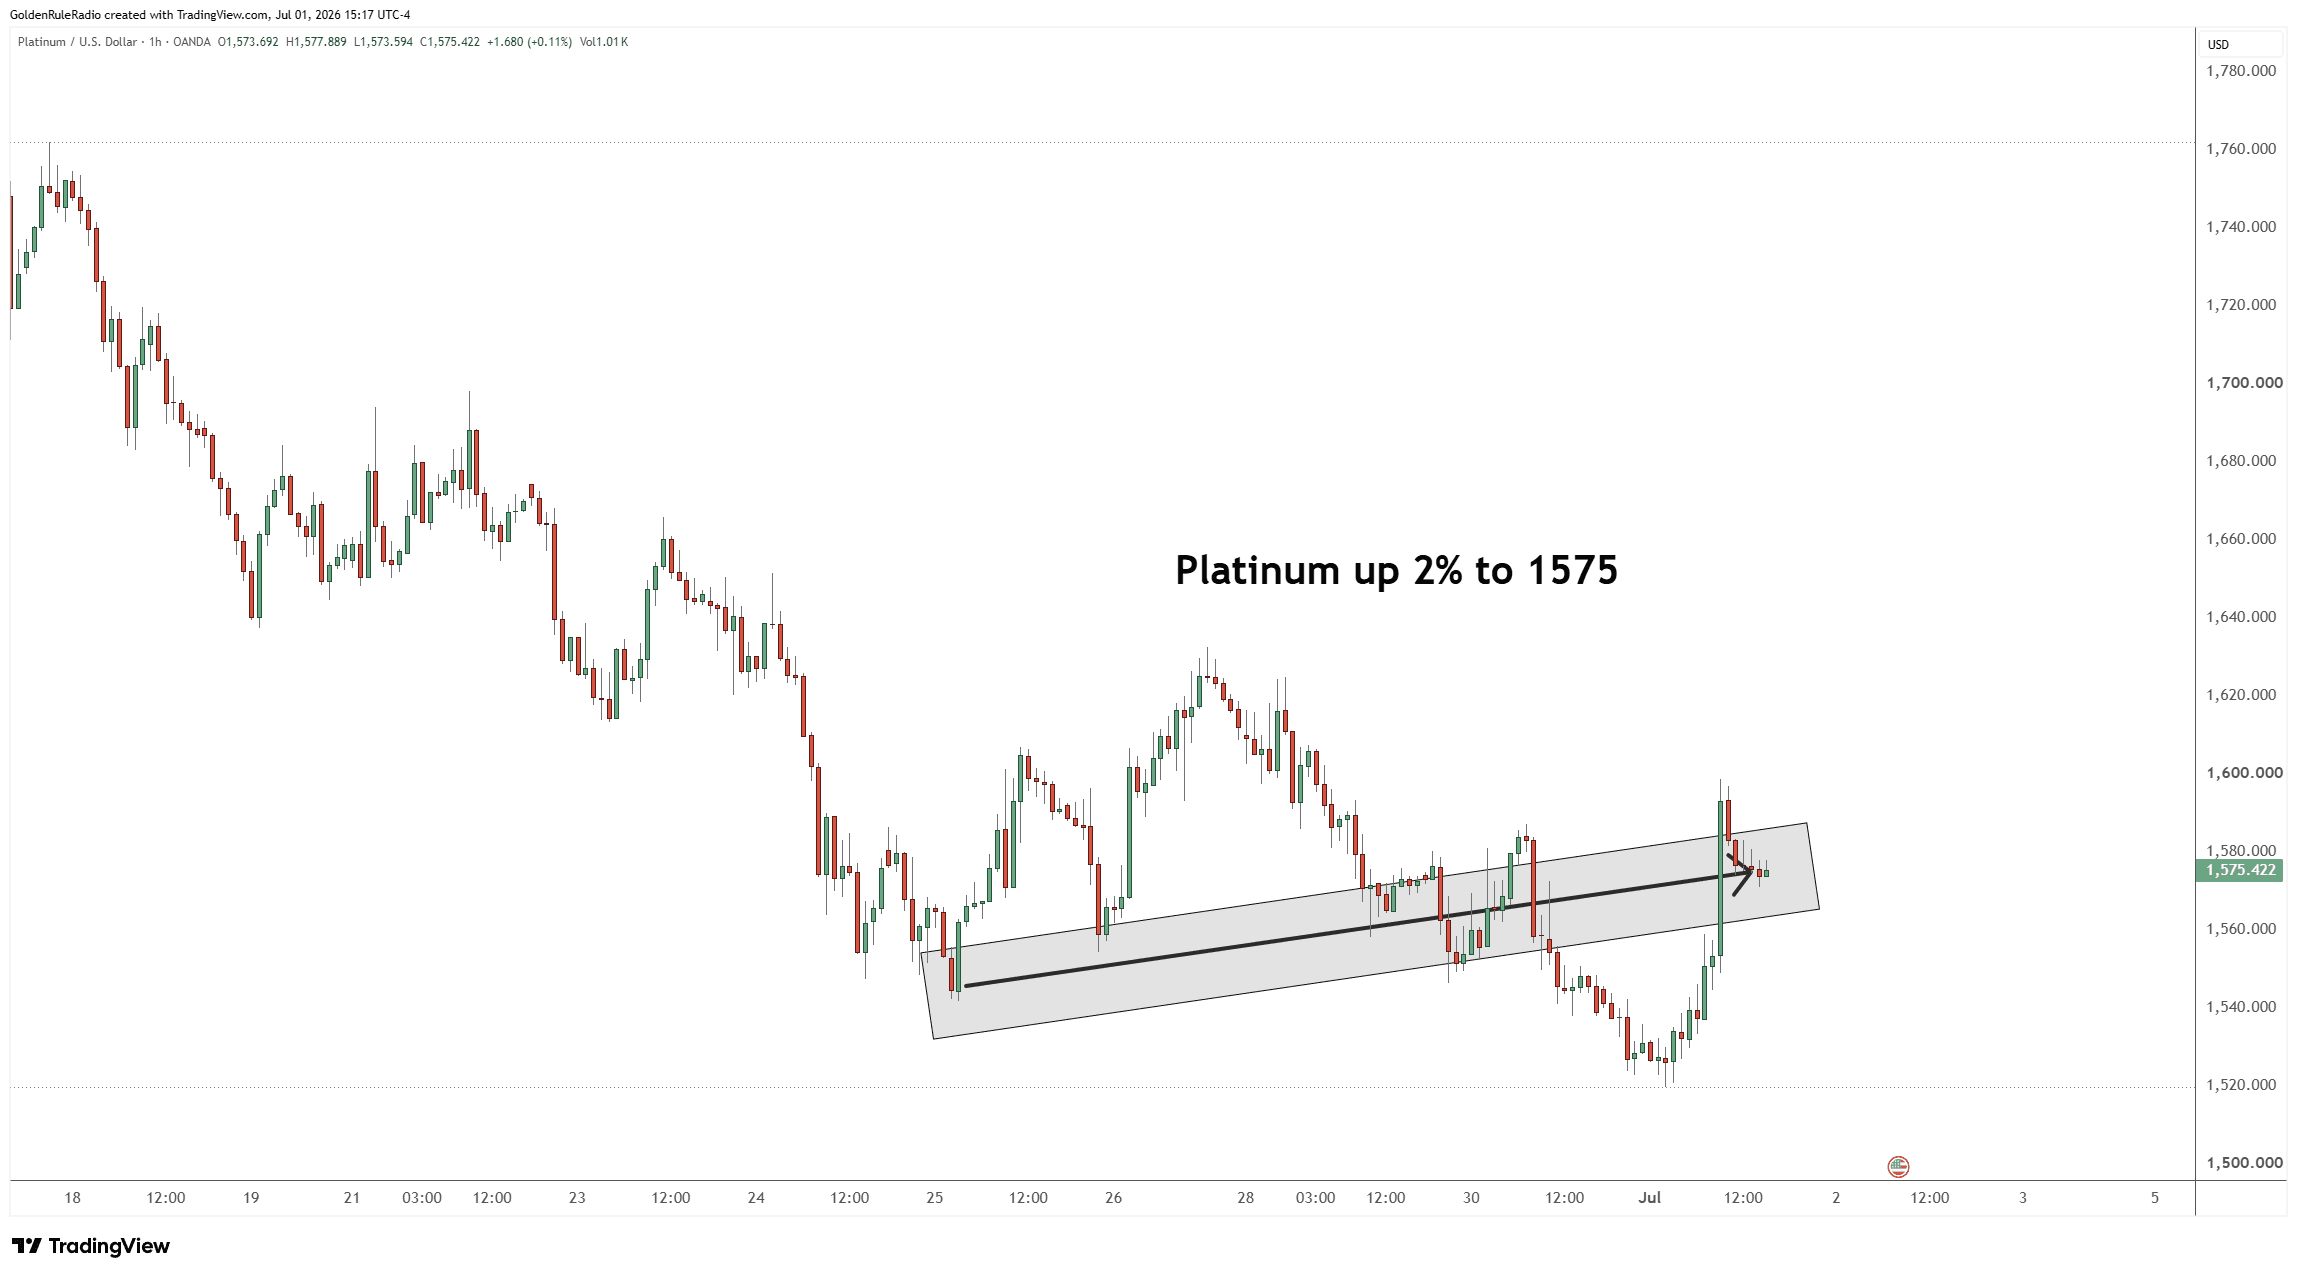 Palladium is up 4.5%, sitting at $1,200.
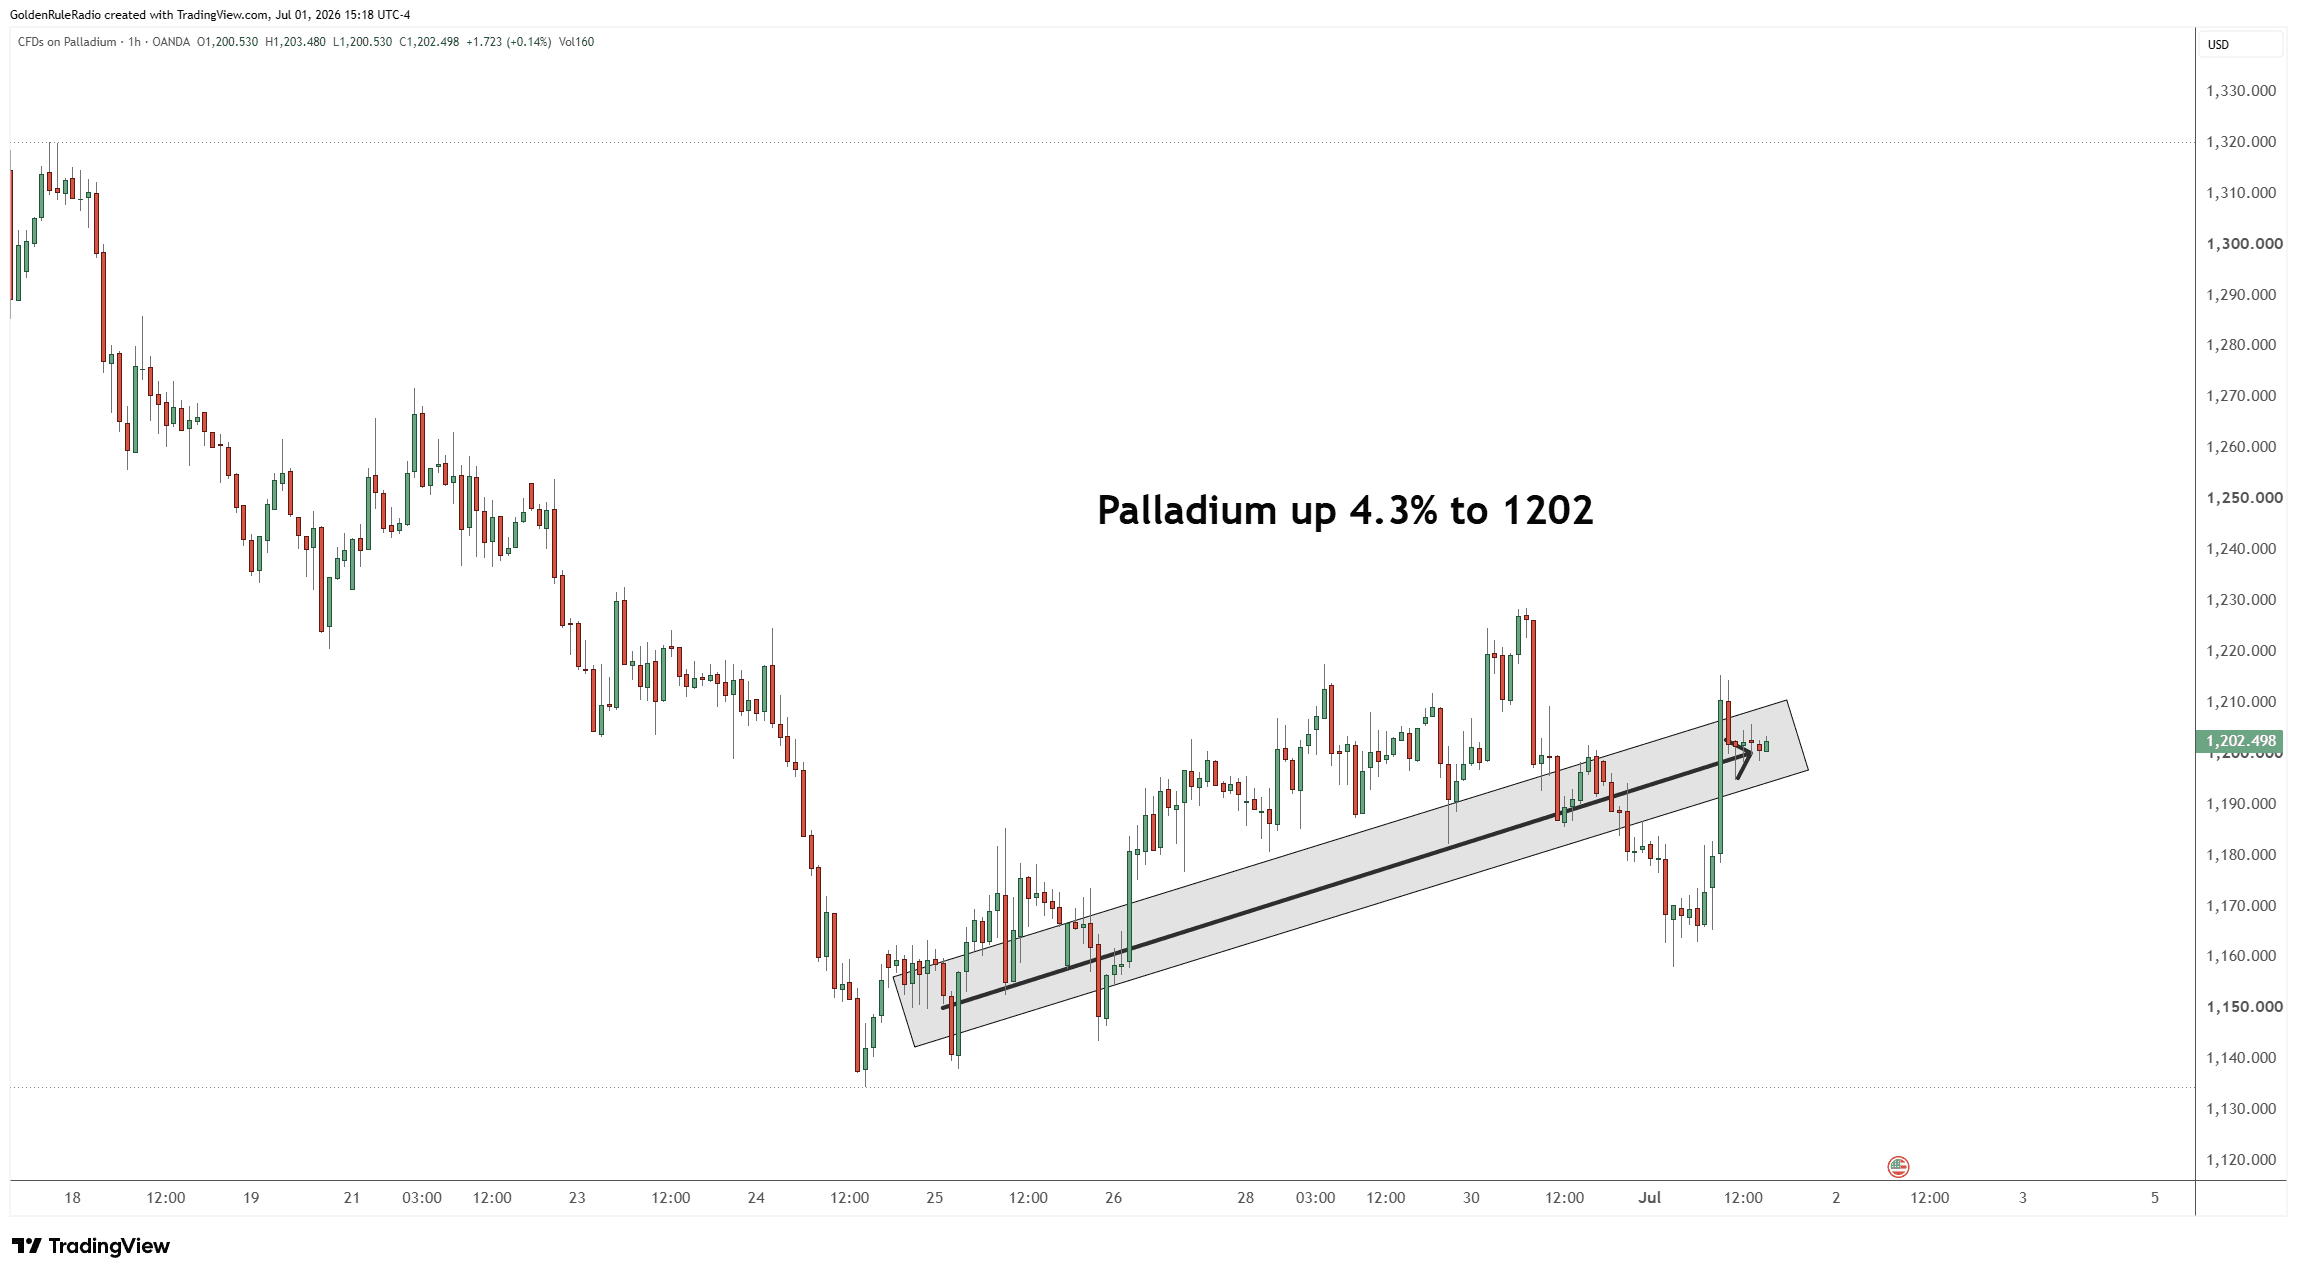 Looking over at the paper markets…The S&P 500 is up about 1%, bouncing around 7,500. The Dow Industrials and Dow Transports are both up roughly 1% as well.
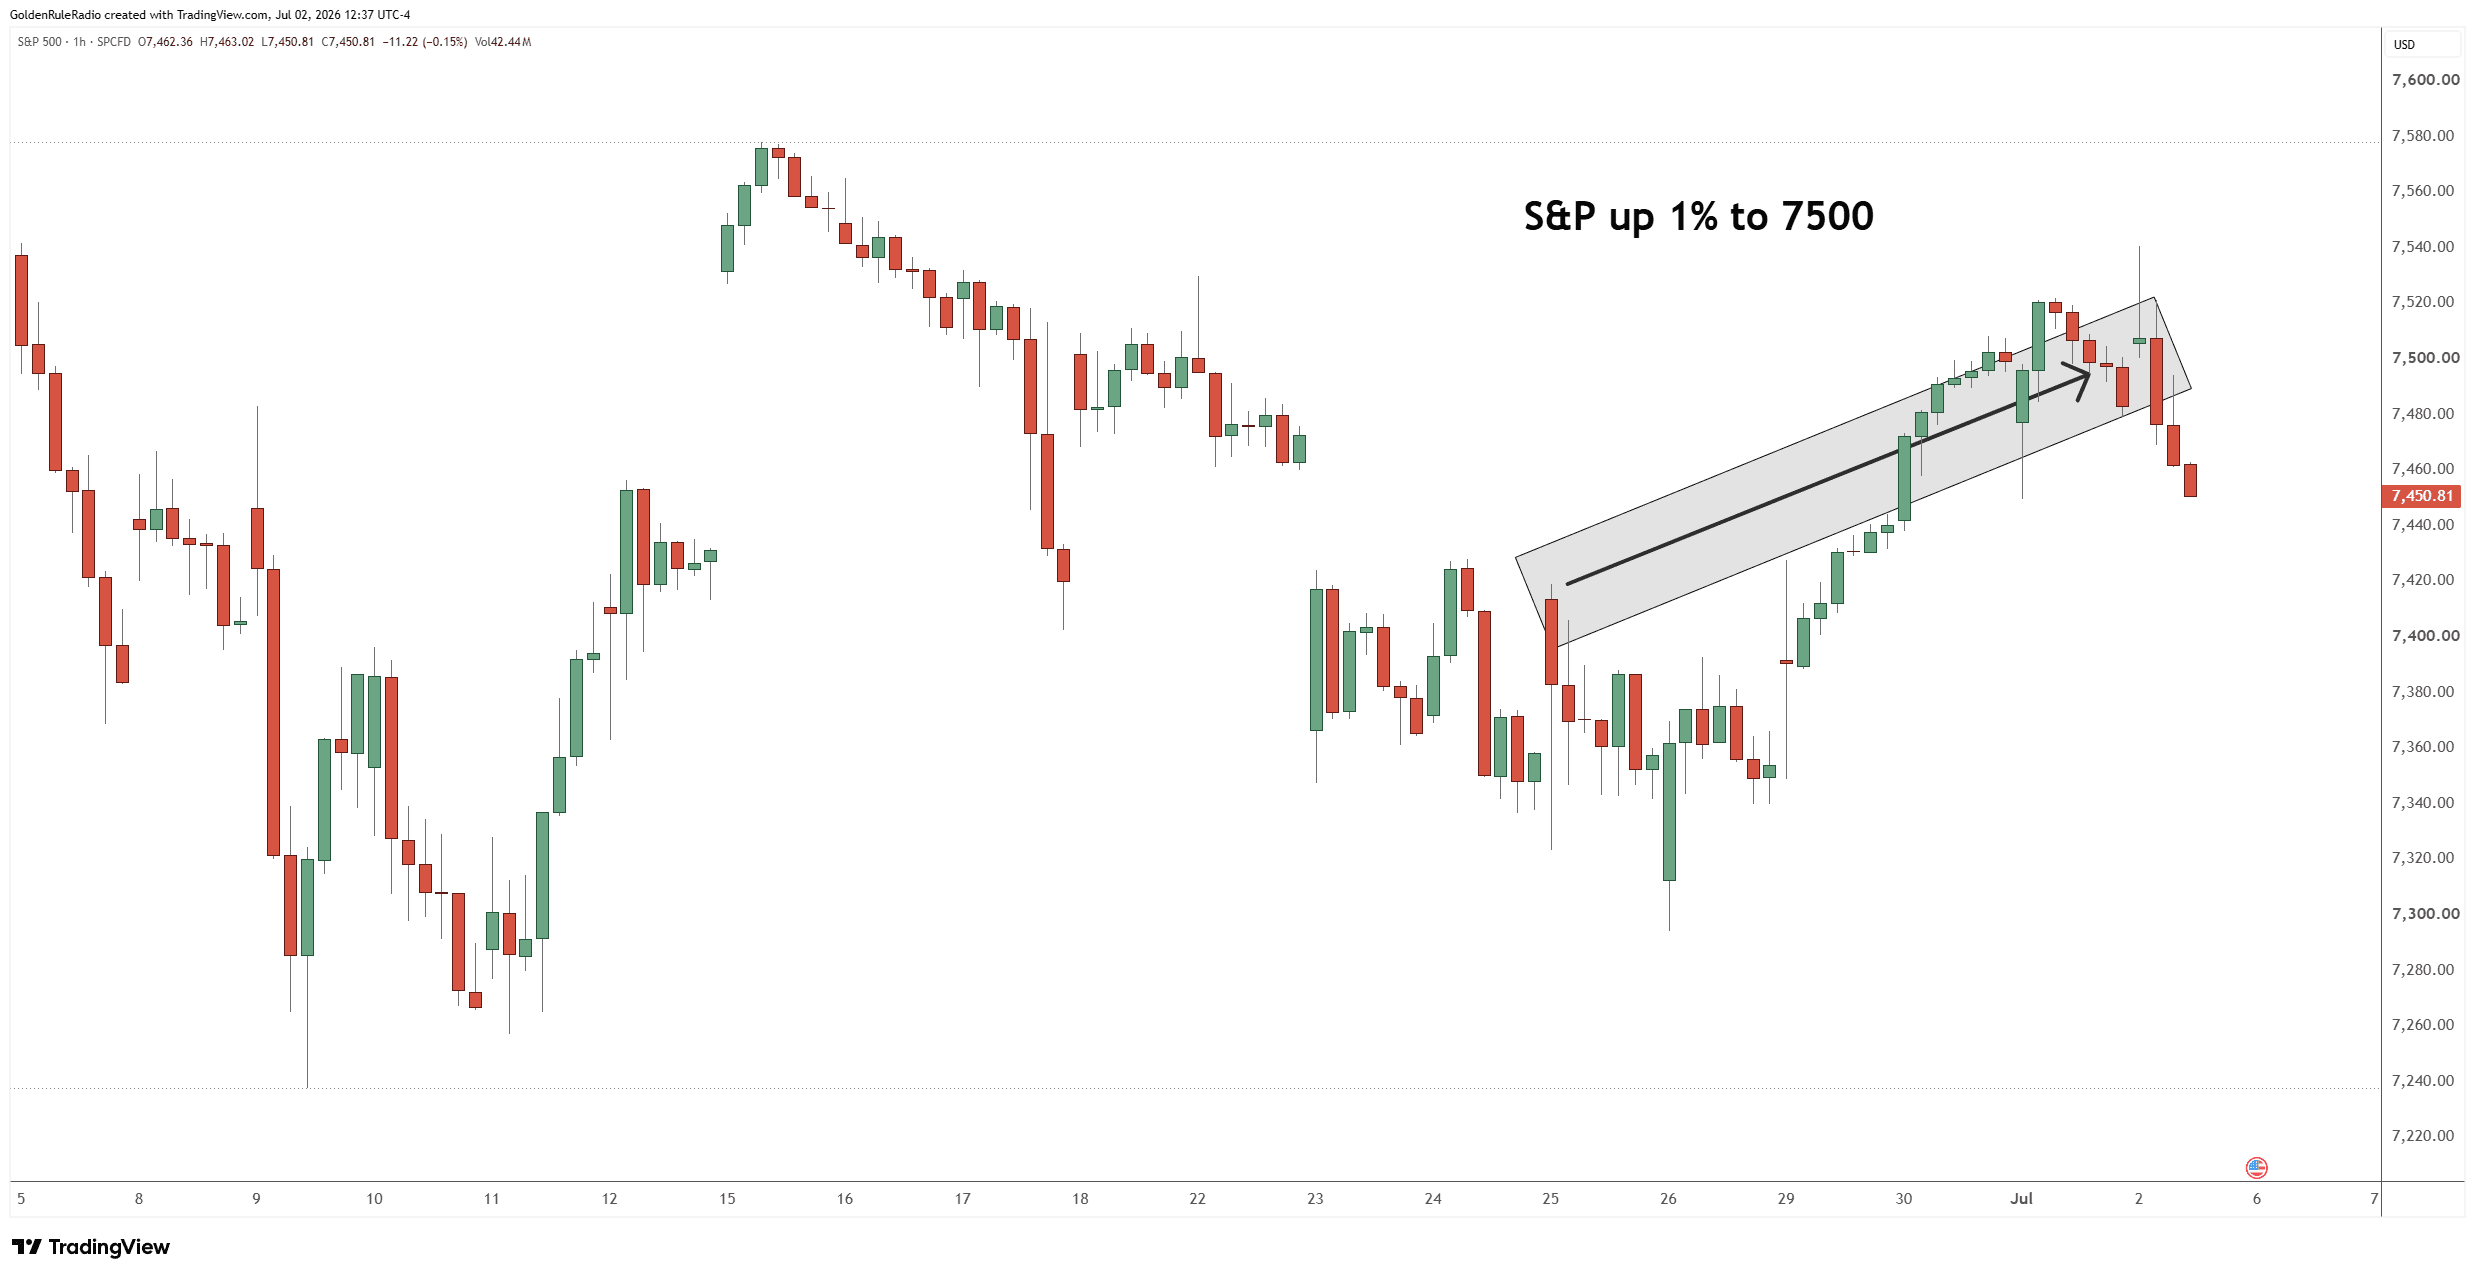 The US dollar index is down 0.1% from last week, sitting near 101.4.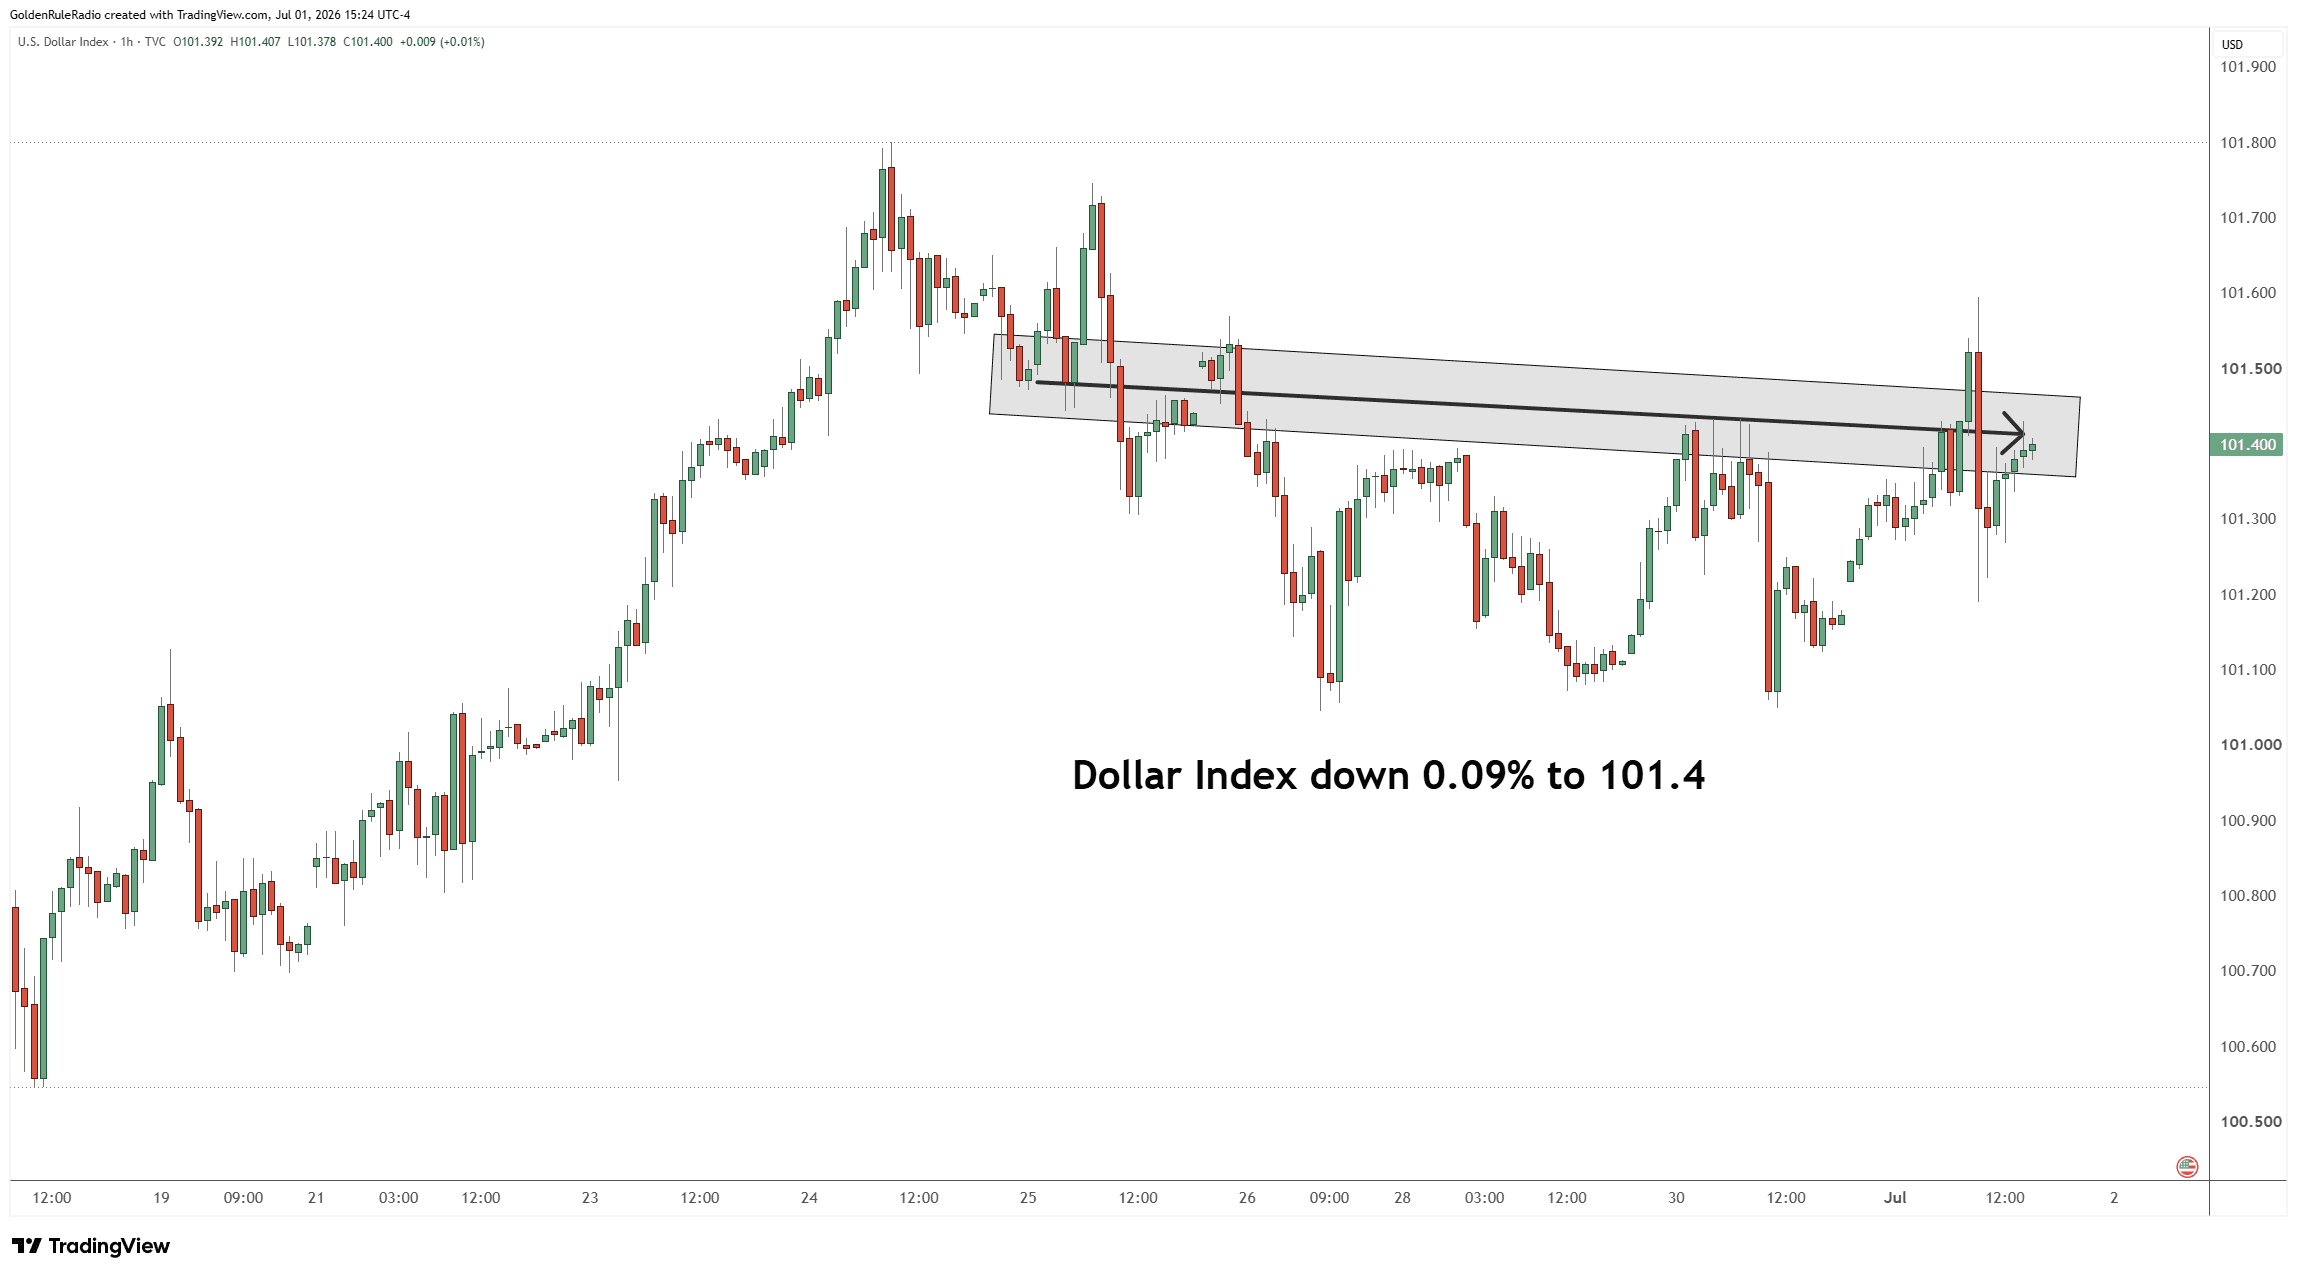

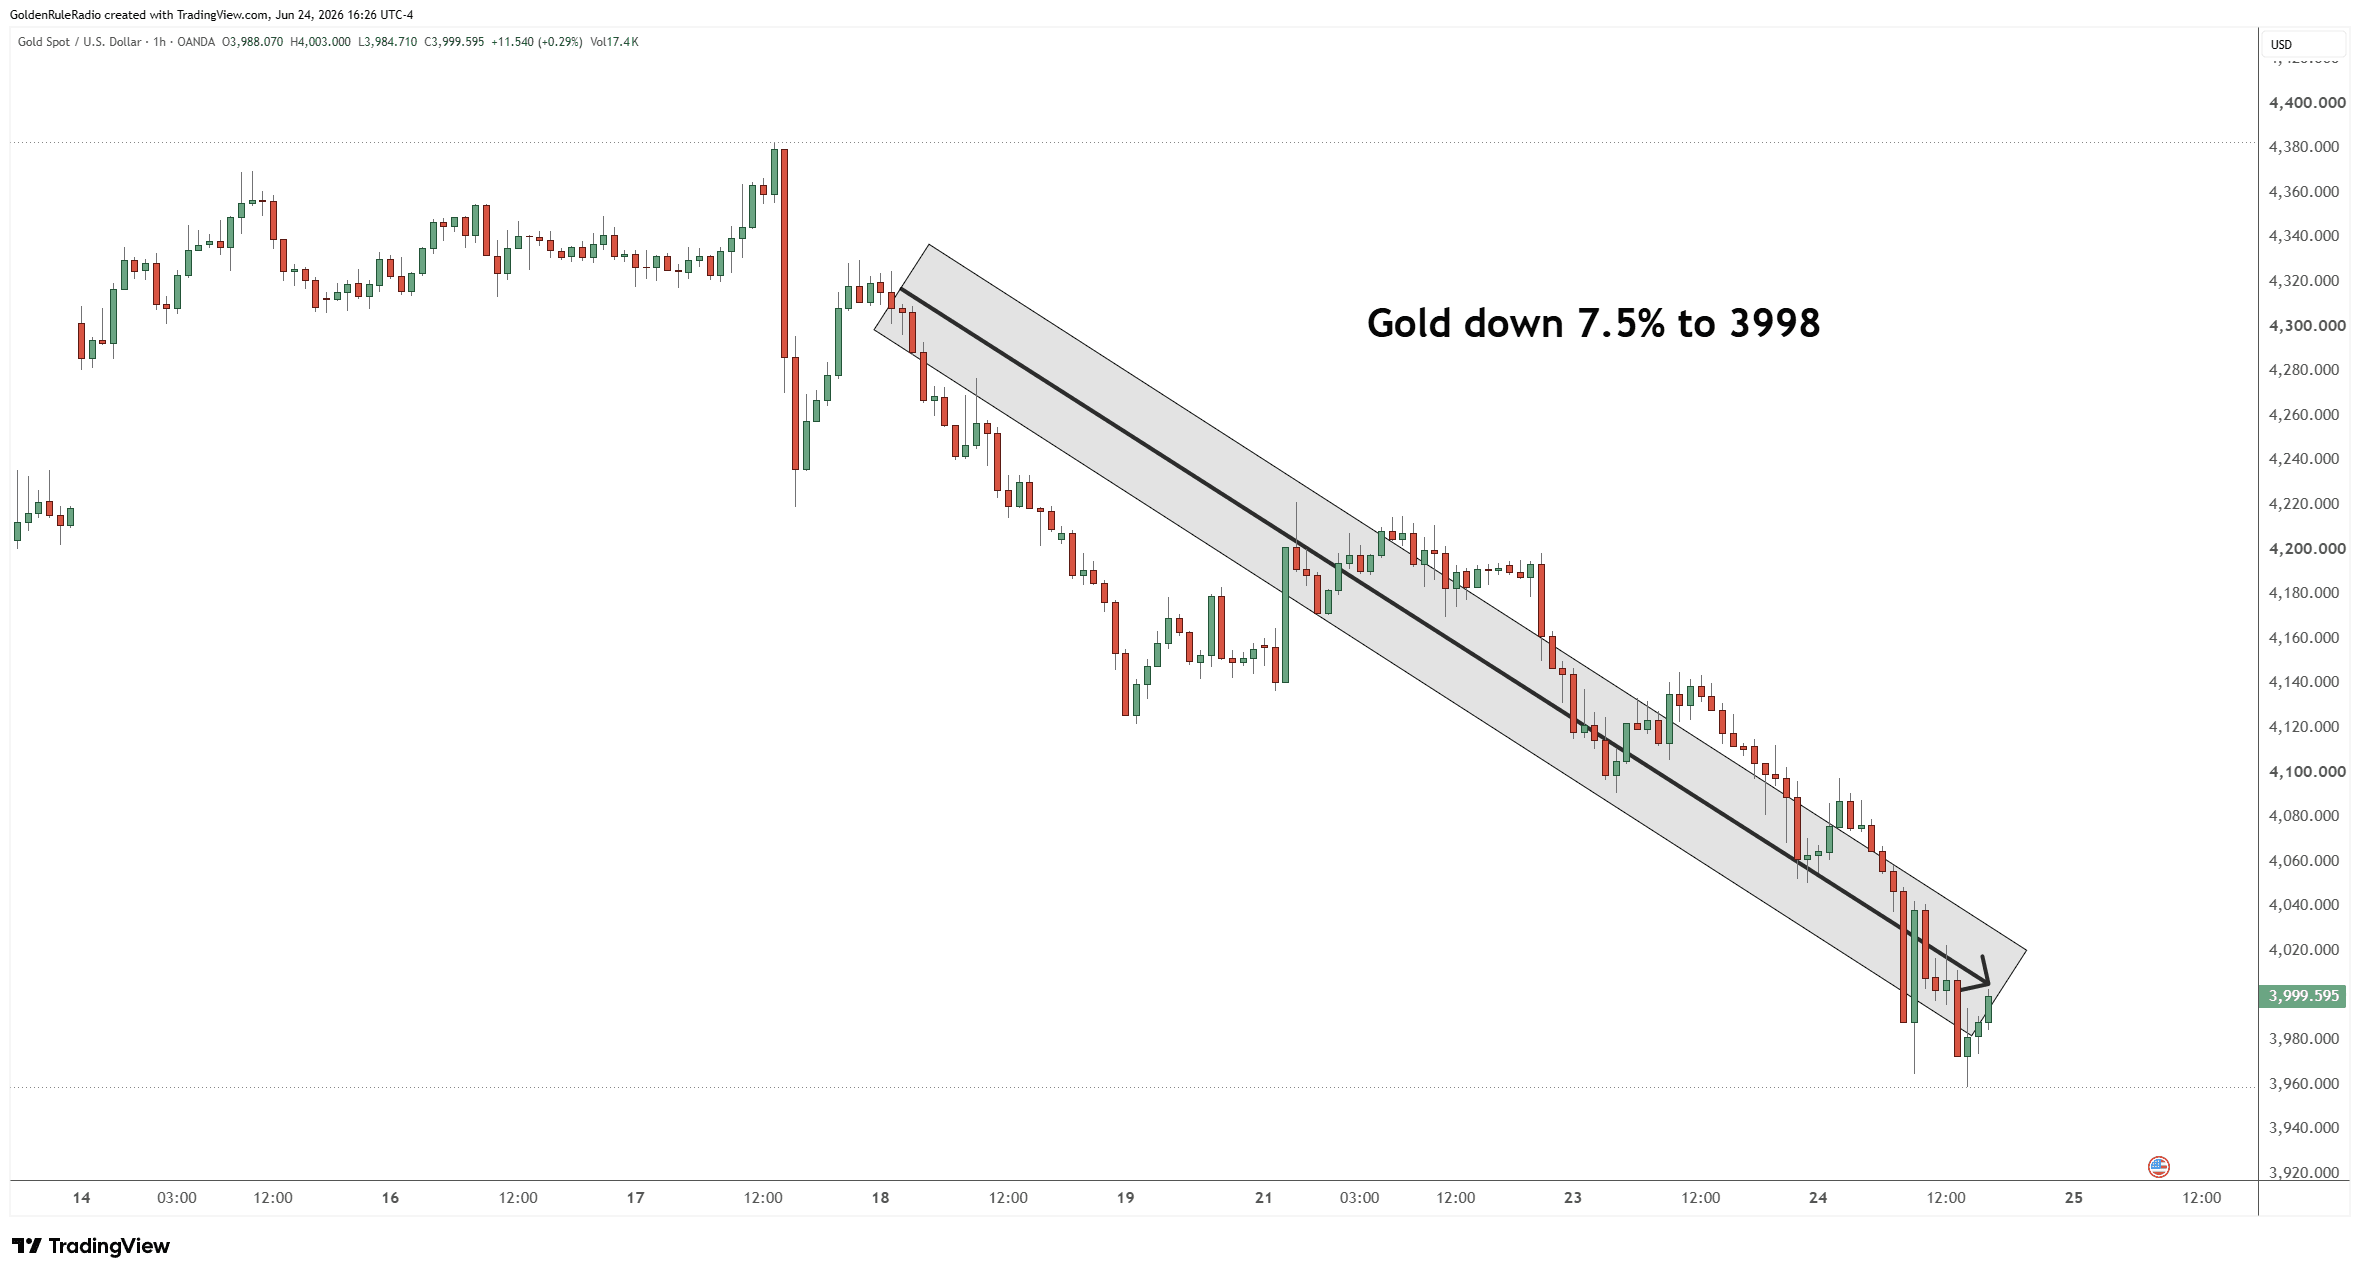 The price of silver is down 17%, falling from about $69 last week to $57.50. That's a big drop, but keep it in perspective — silver is still roughly twice what it was a little over a year ago.
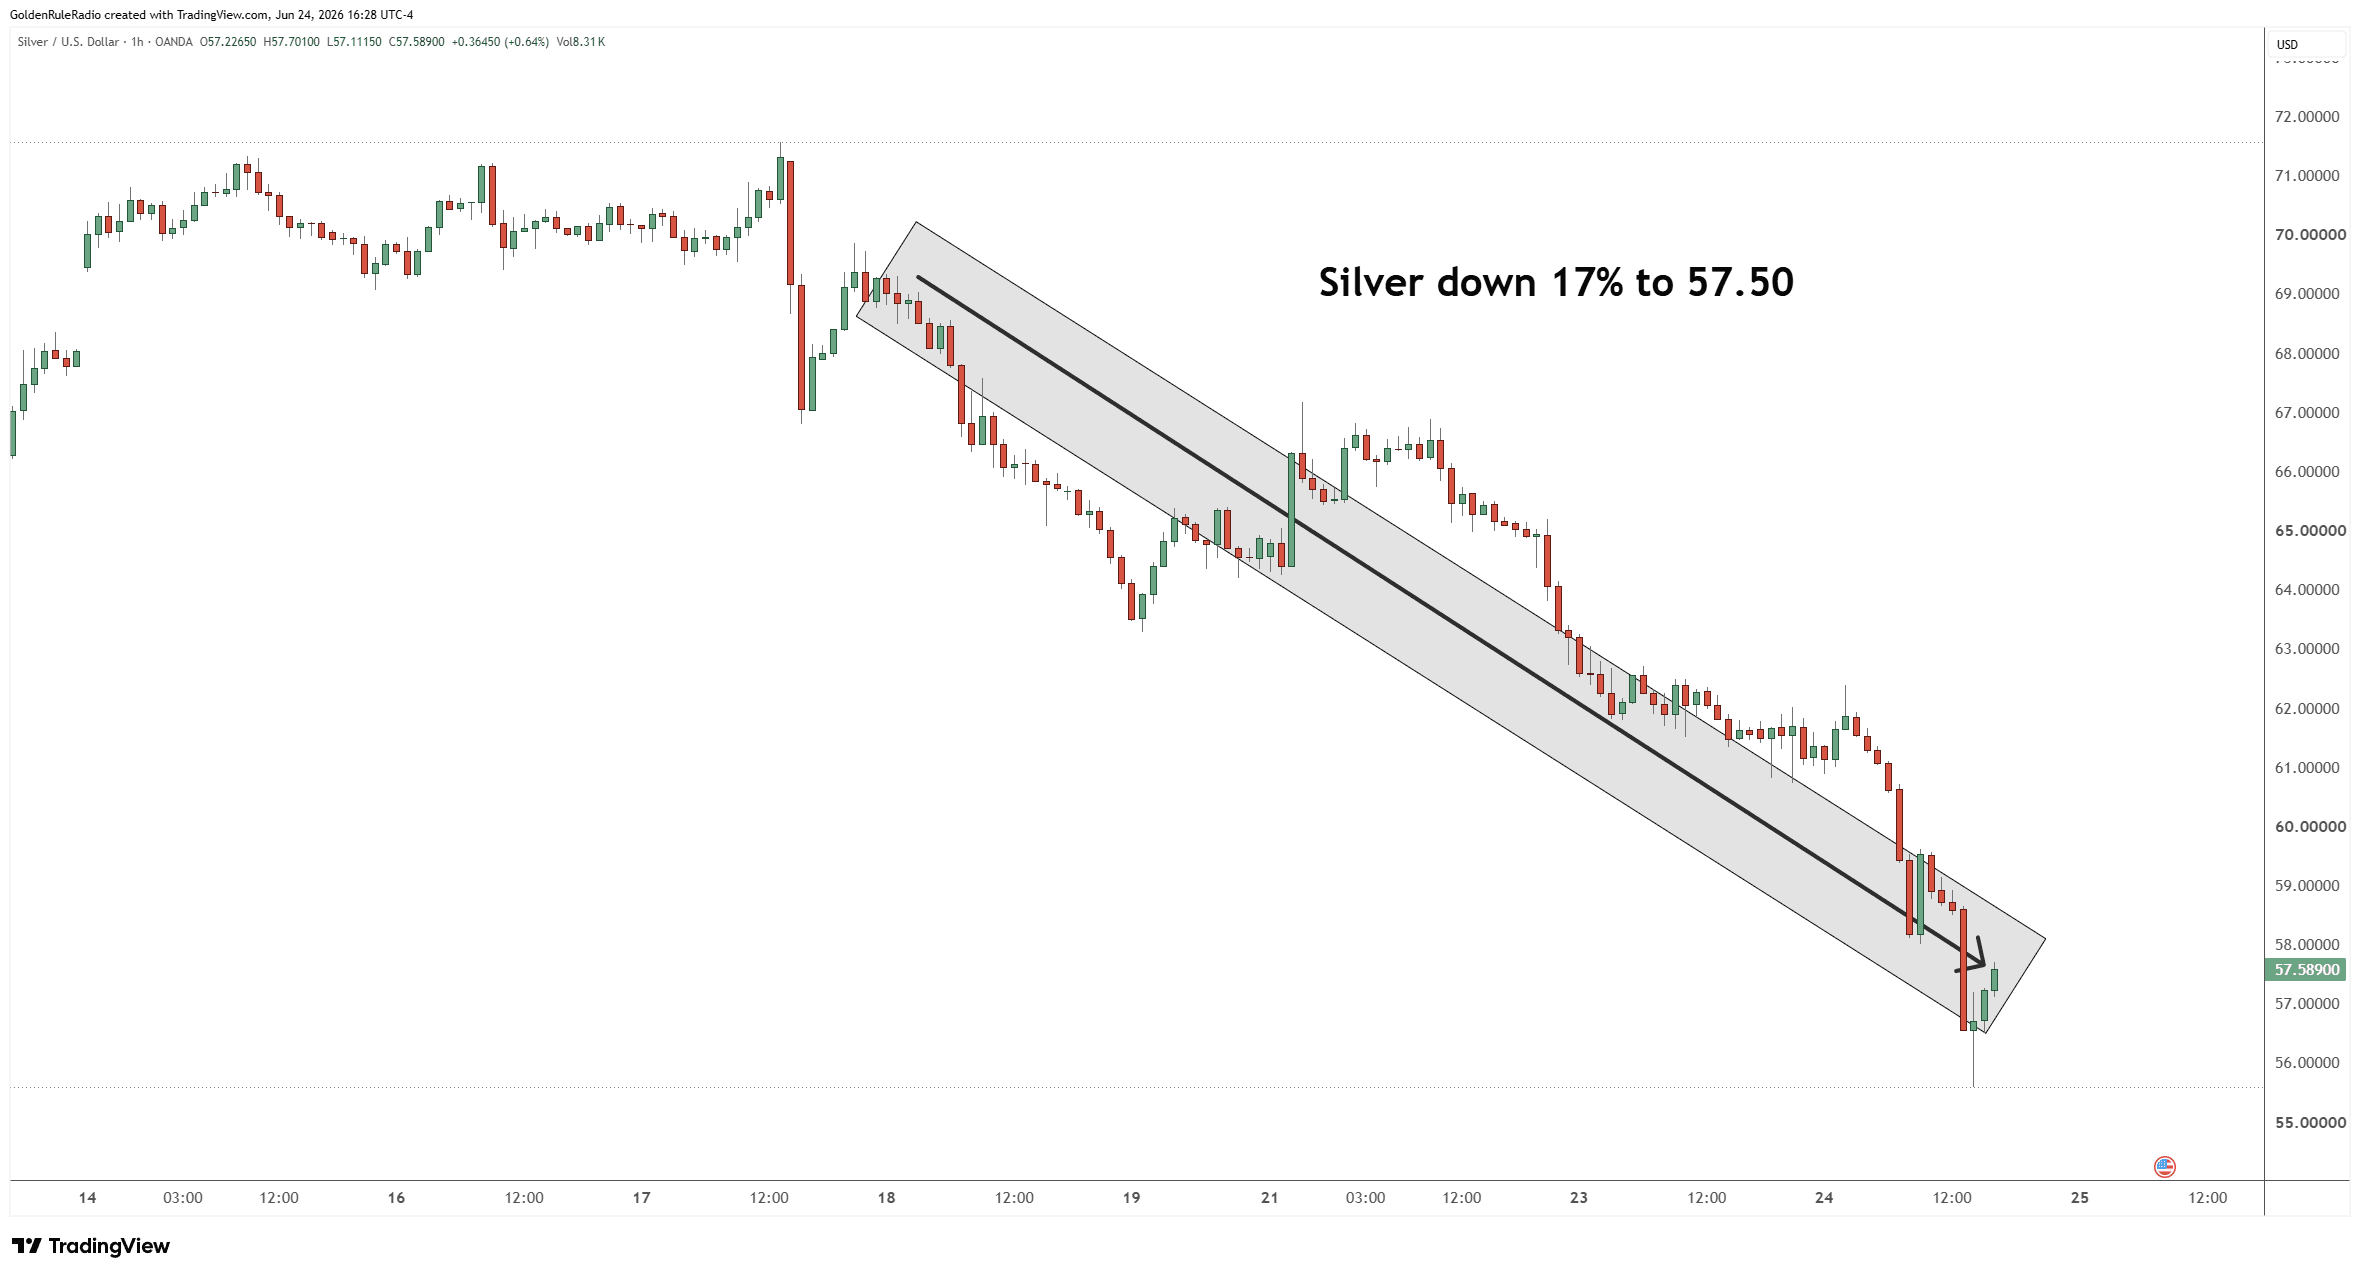 Platinum is down about 10%, sitting at $1,575.
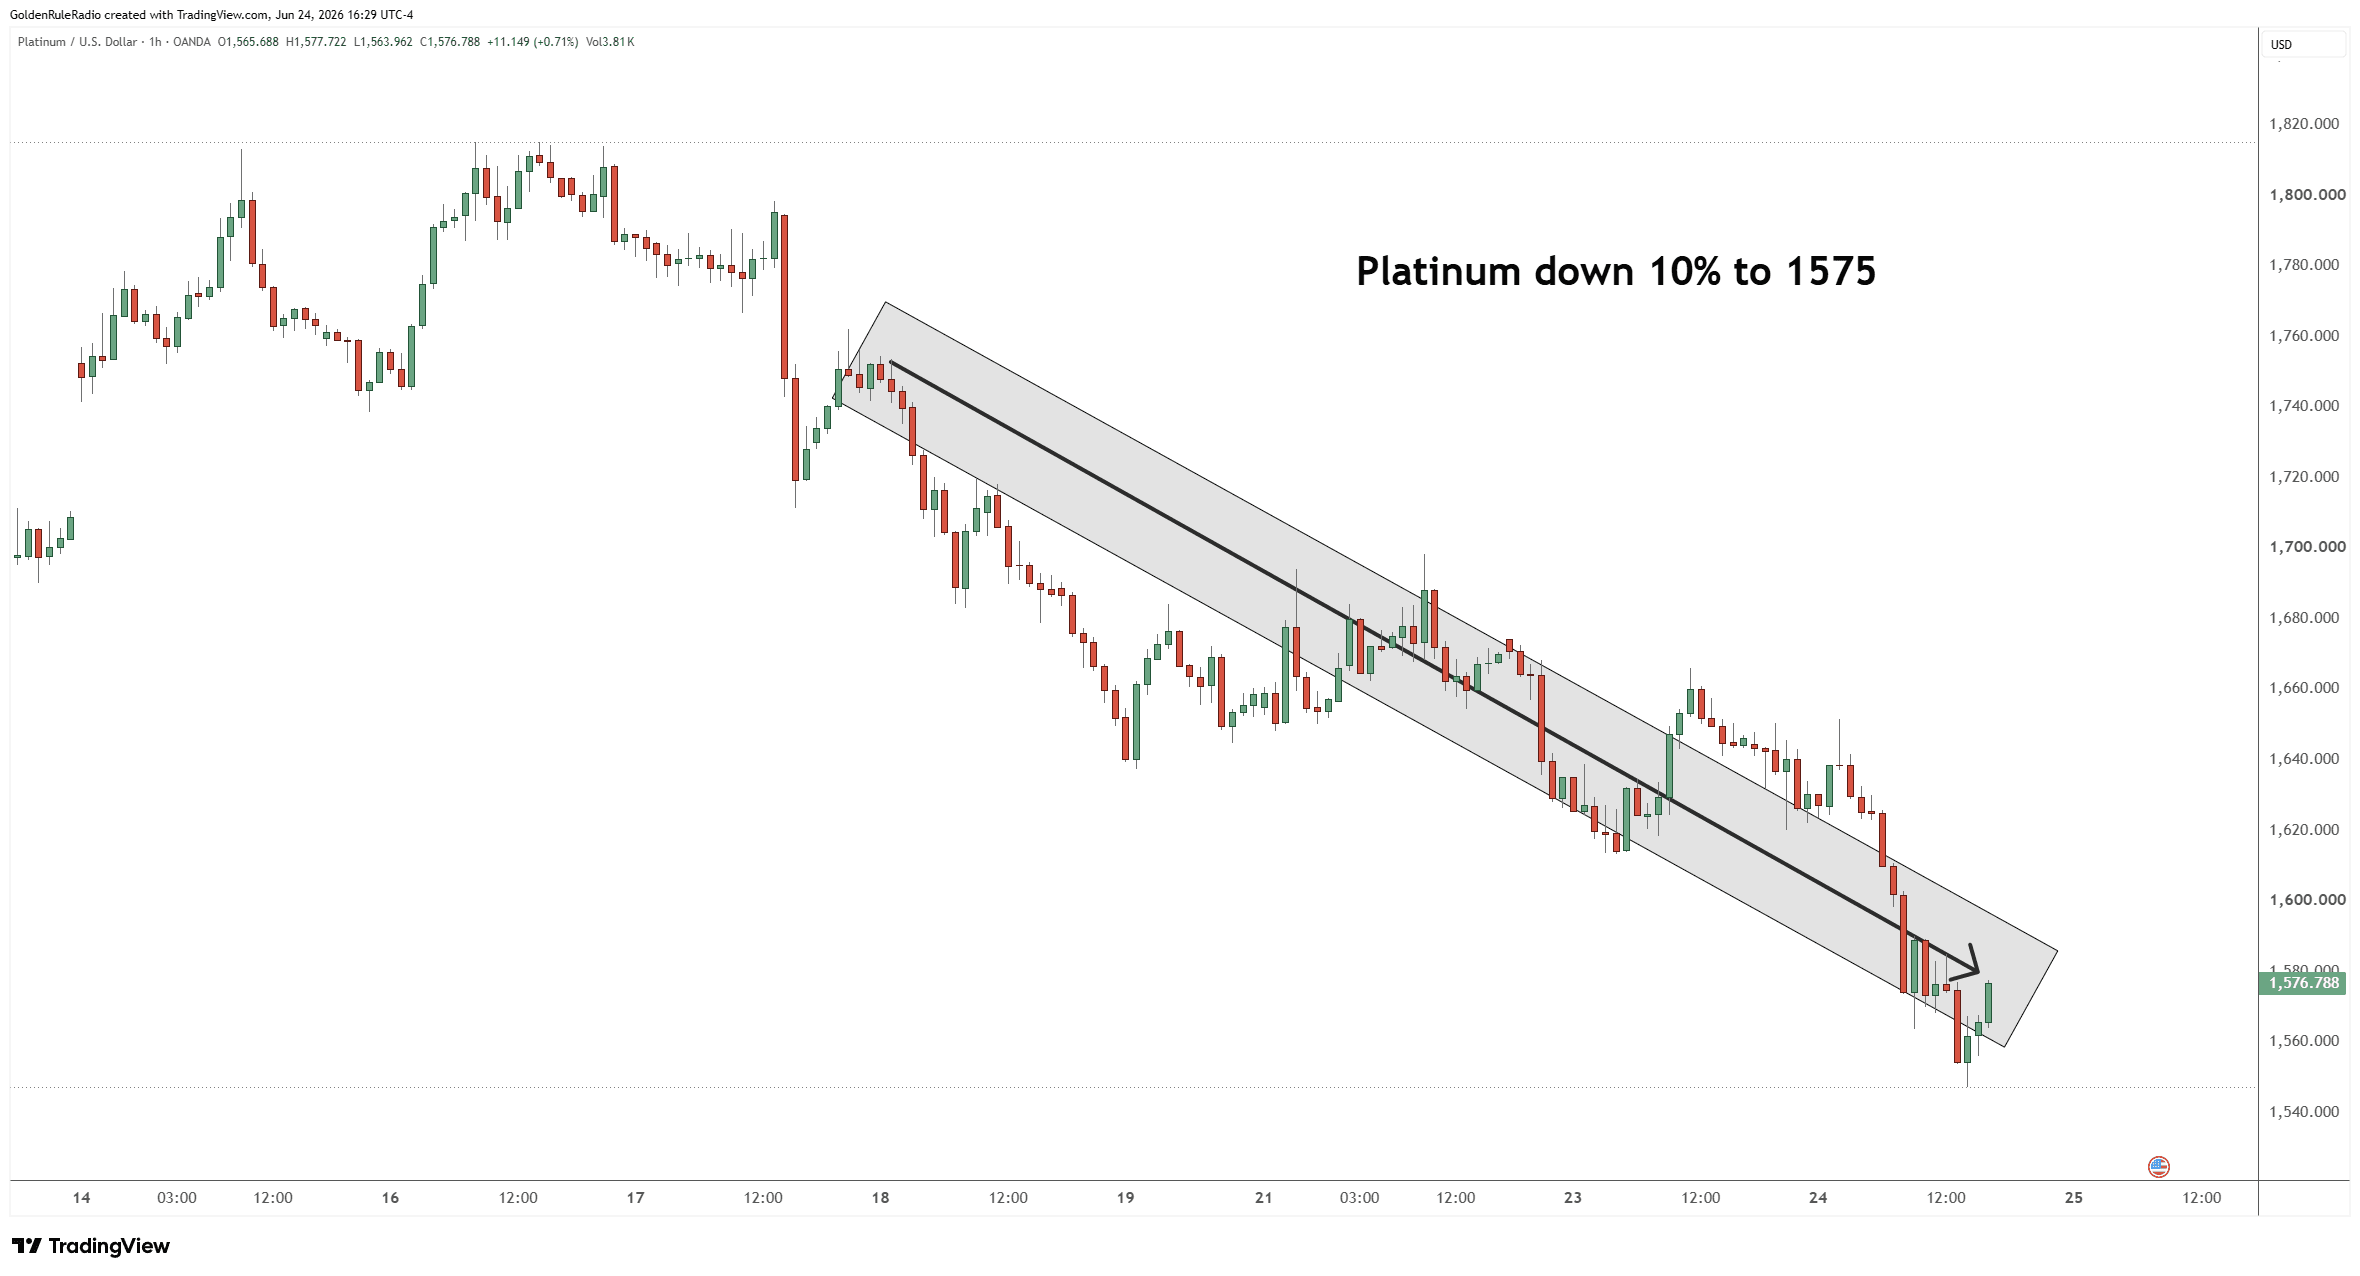 Palladium is down about 12%, currently at $1,160.
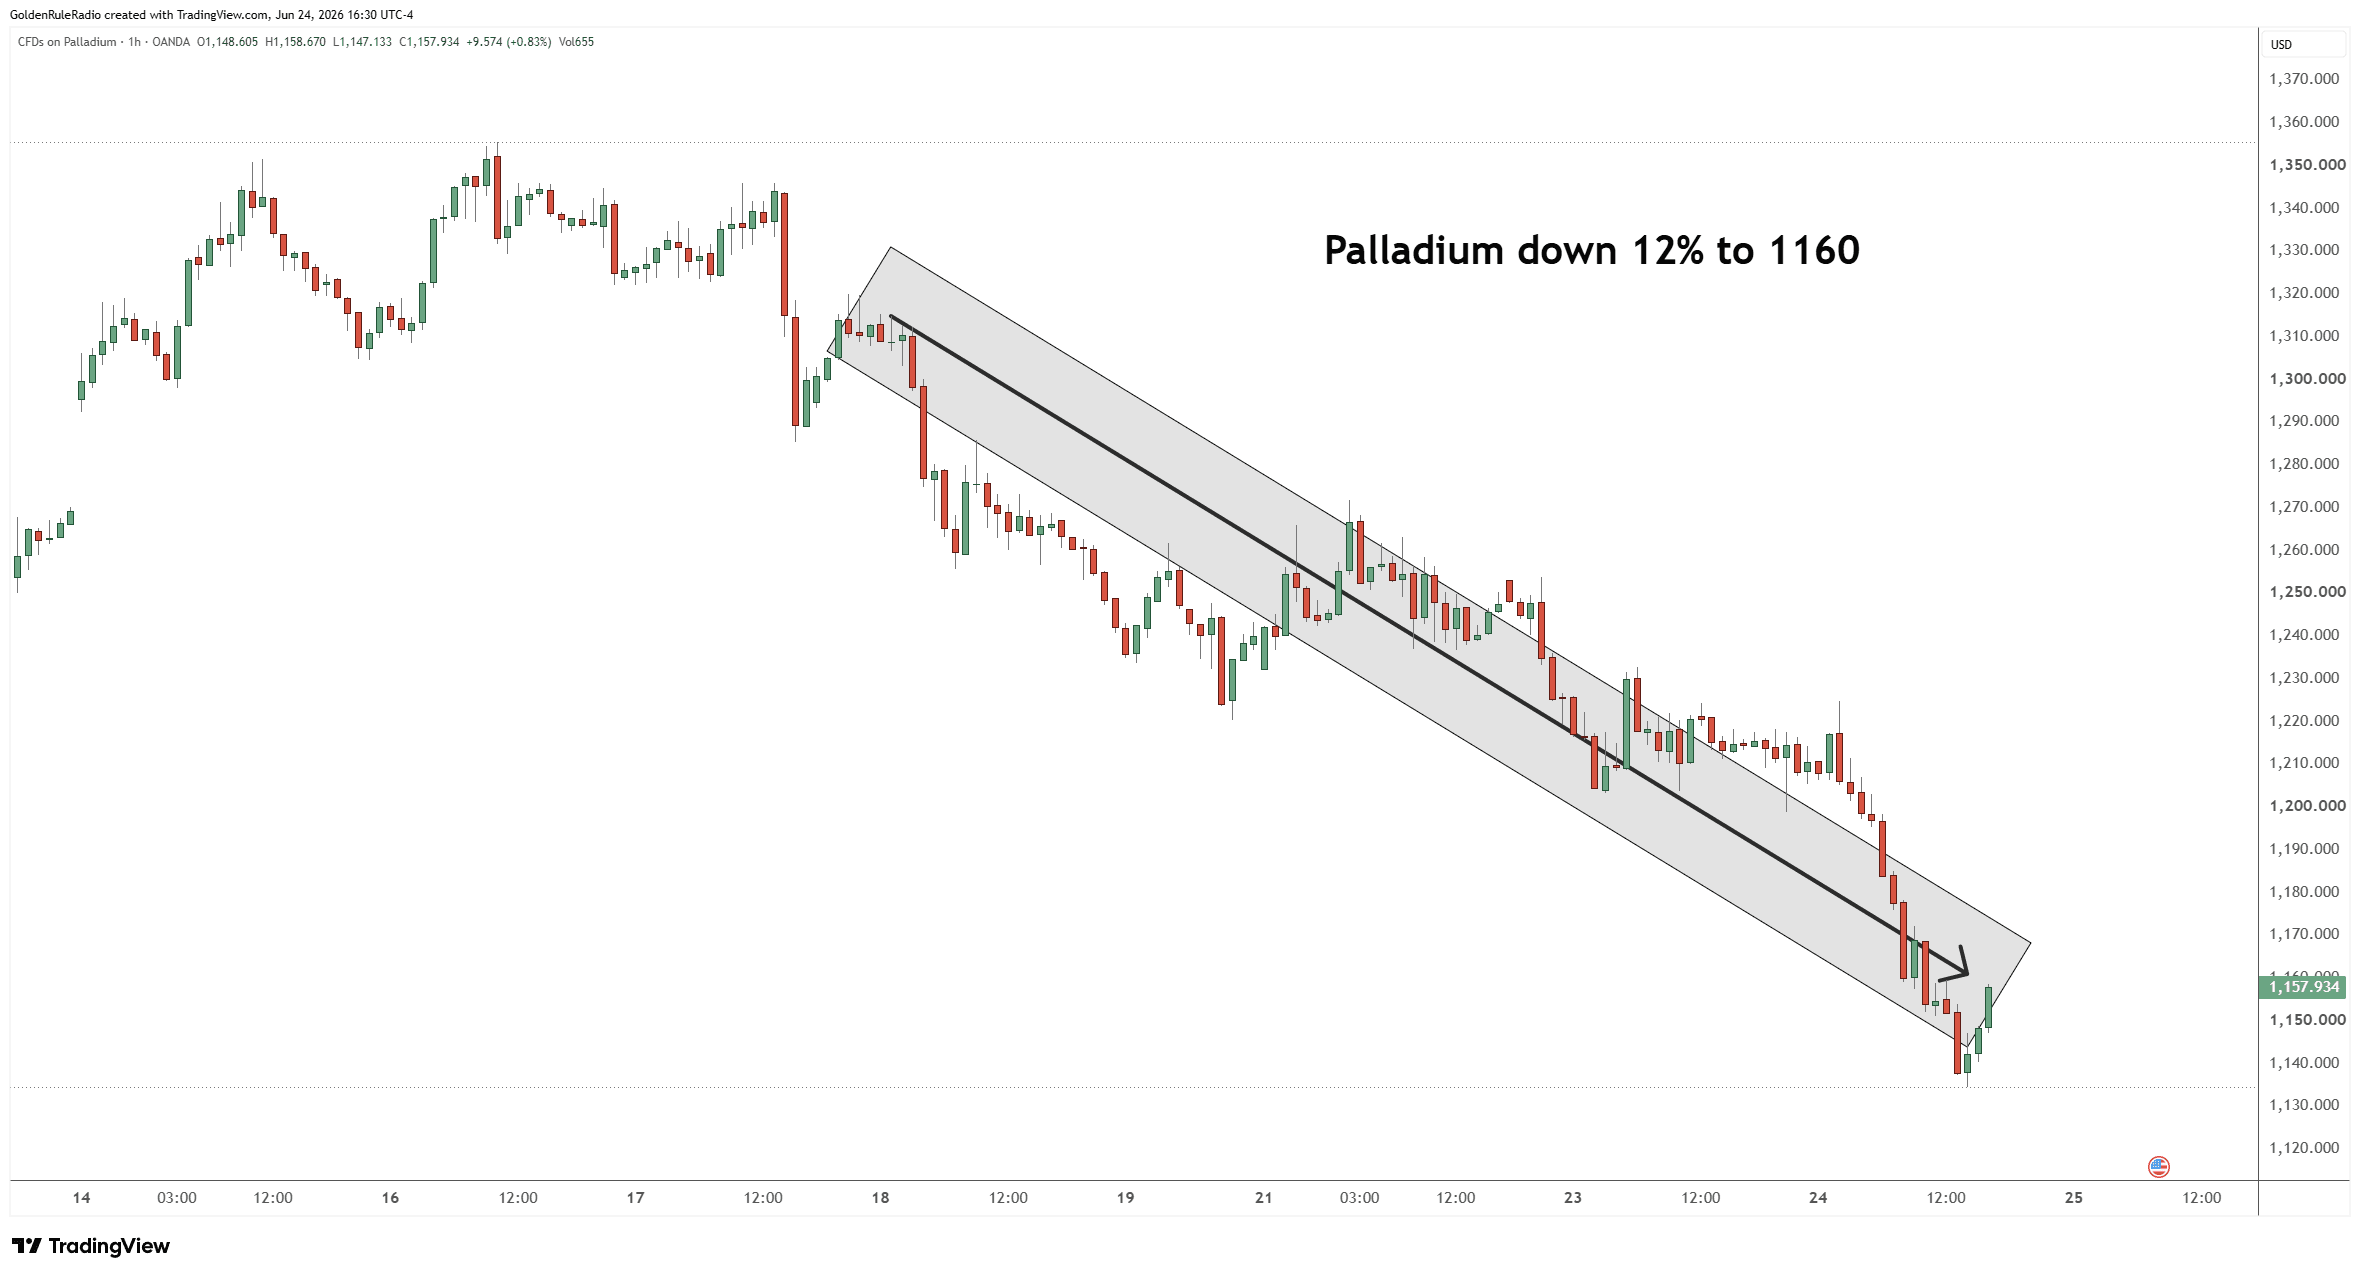 Looking over at the paper markets…The S&P 500 is down another 2% to 7,358, continuing its slide of the last couple of weeks.
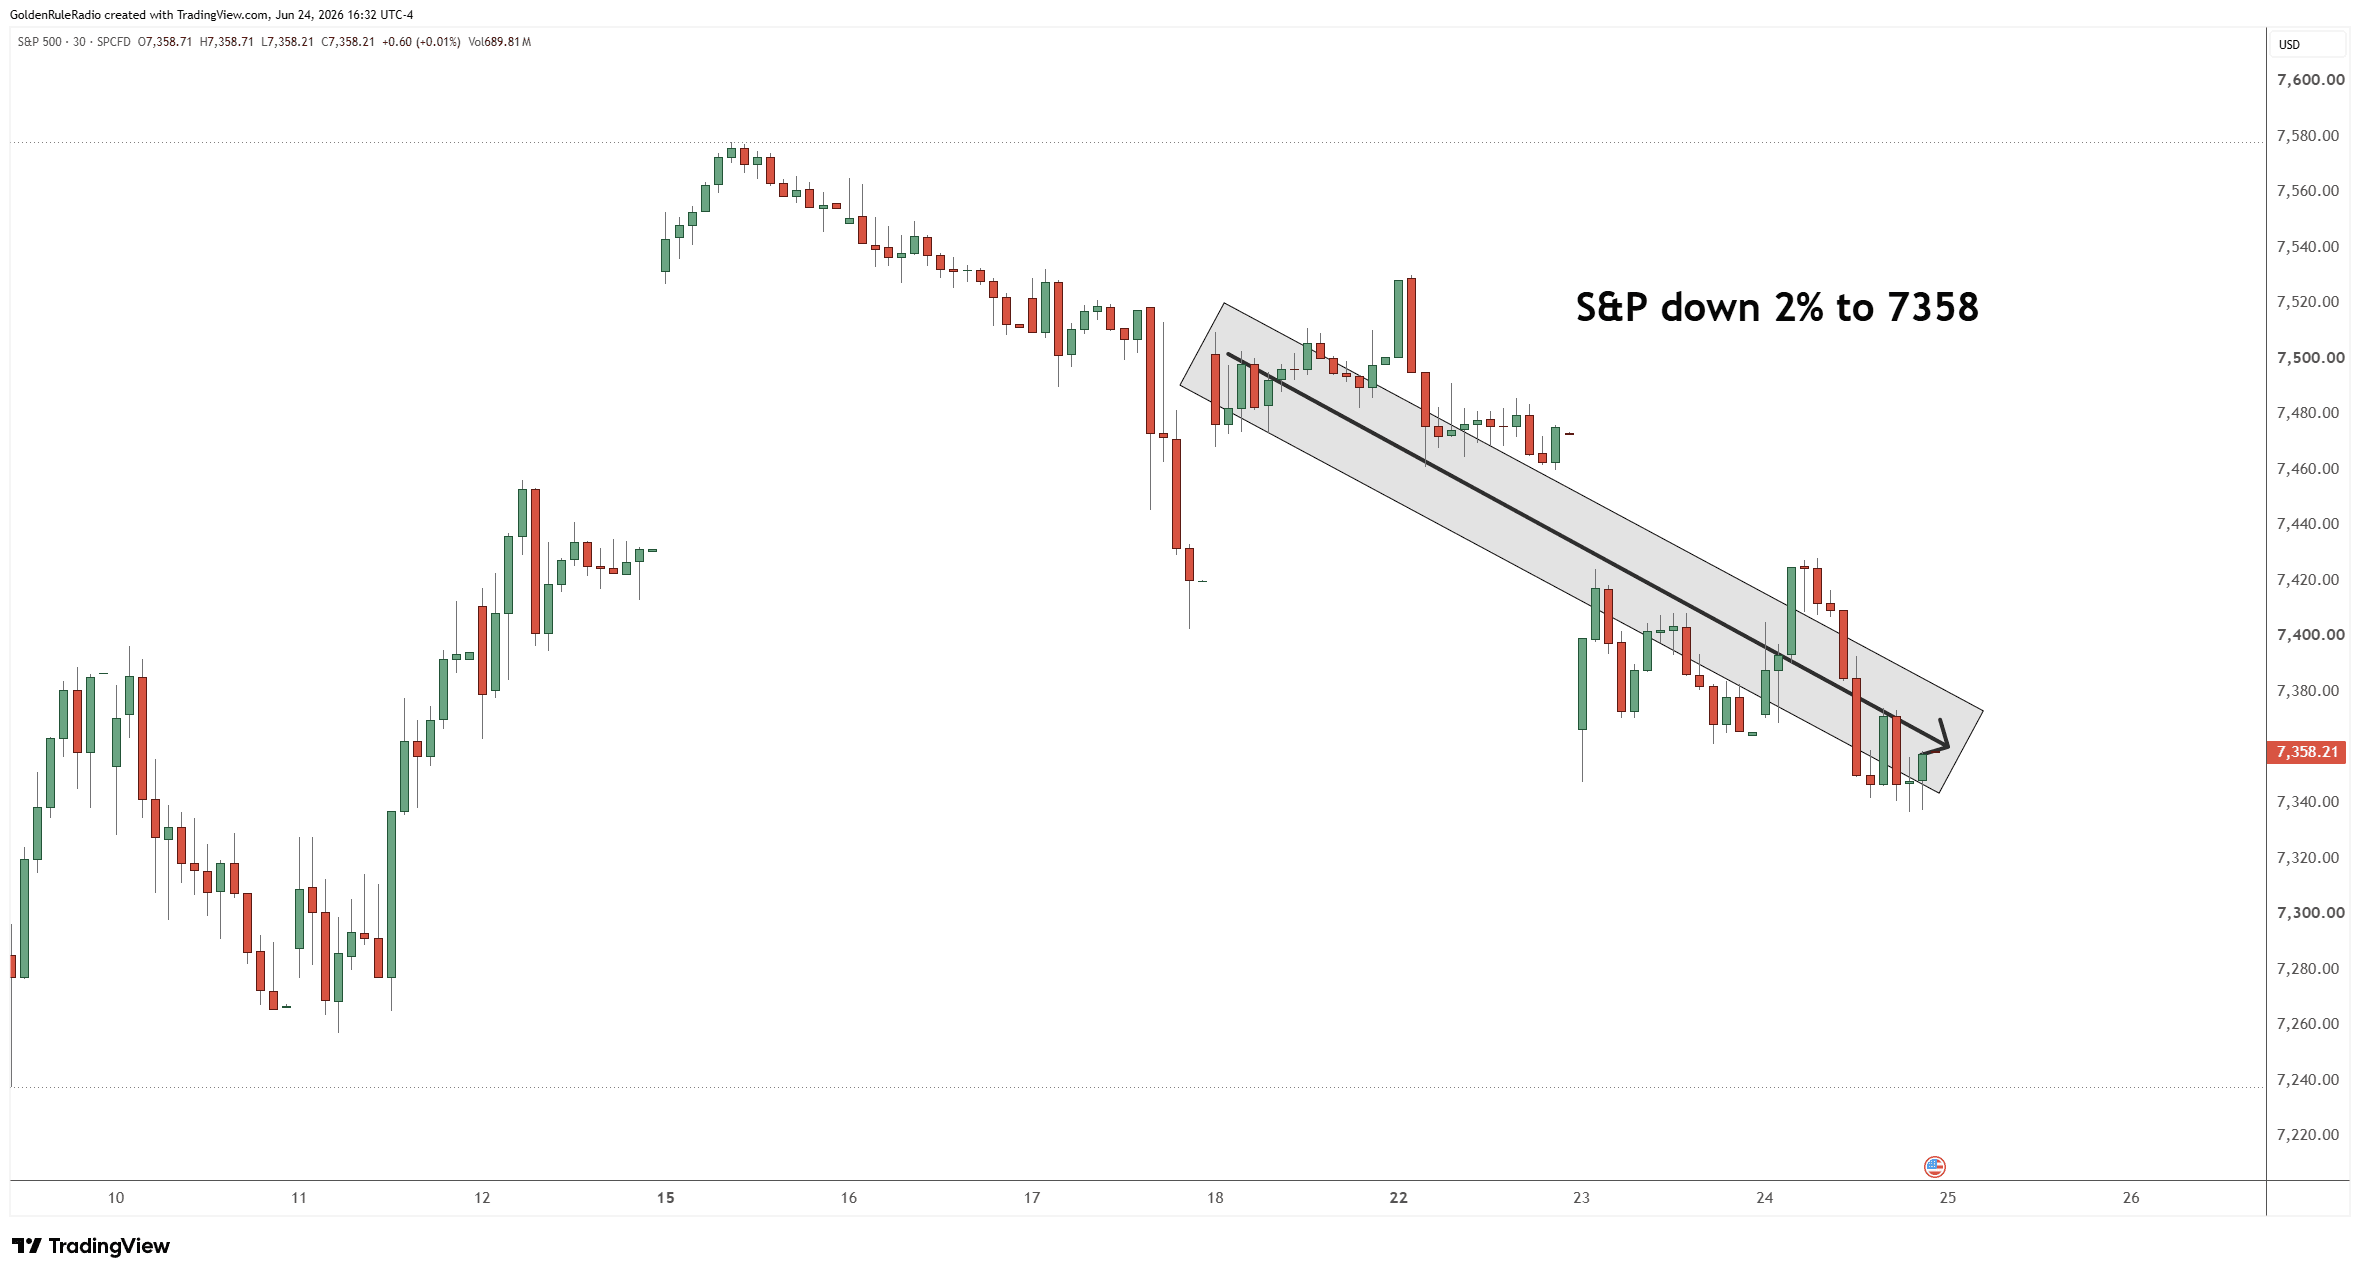 Interestingly, the Dow held up better and was roughly flat to higher on the week, though the Dow transports have continued to languish. That divergence suggests equities may be running out of steam and getting ready for a breather of their own.The U.S. Dollar Index is up about 1.5% to 101.55, now a point and a half above the 100 level and continuing its strong climb.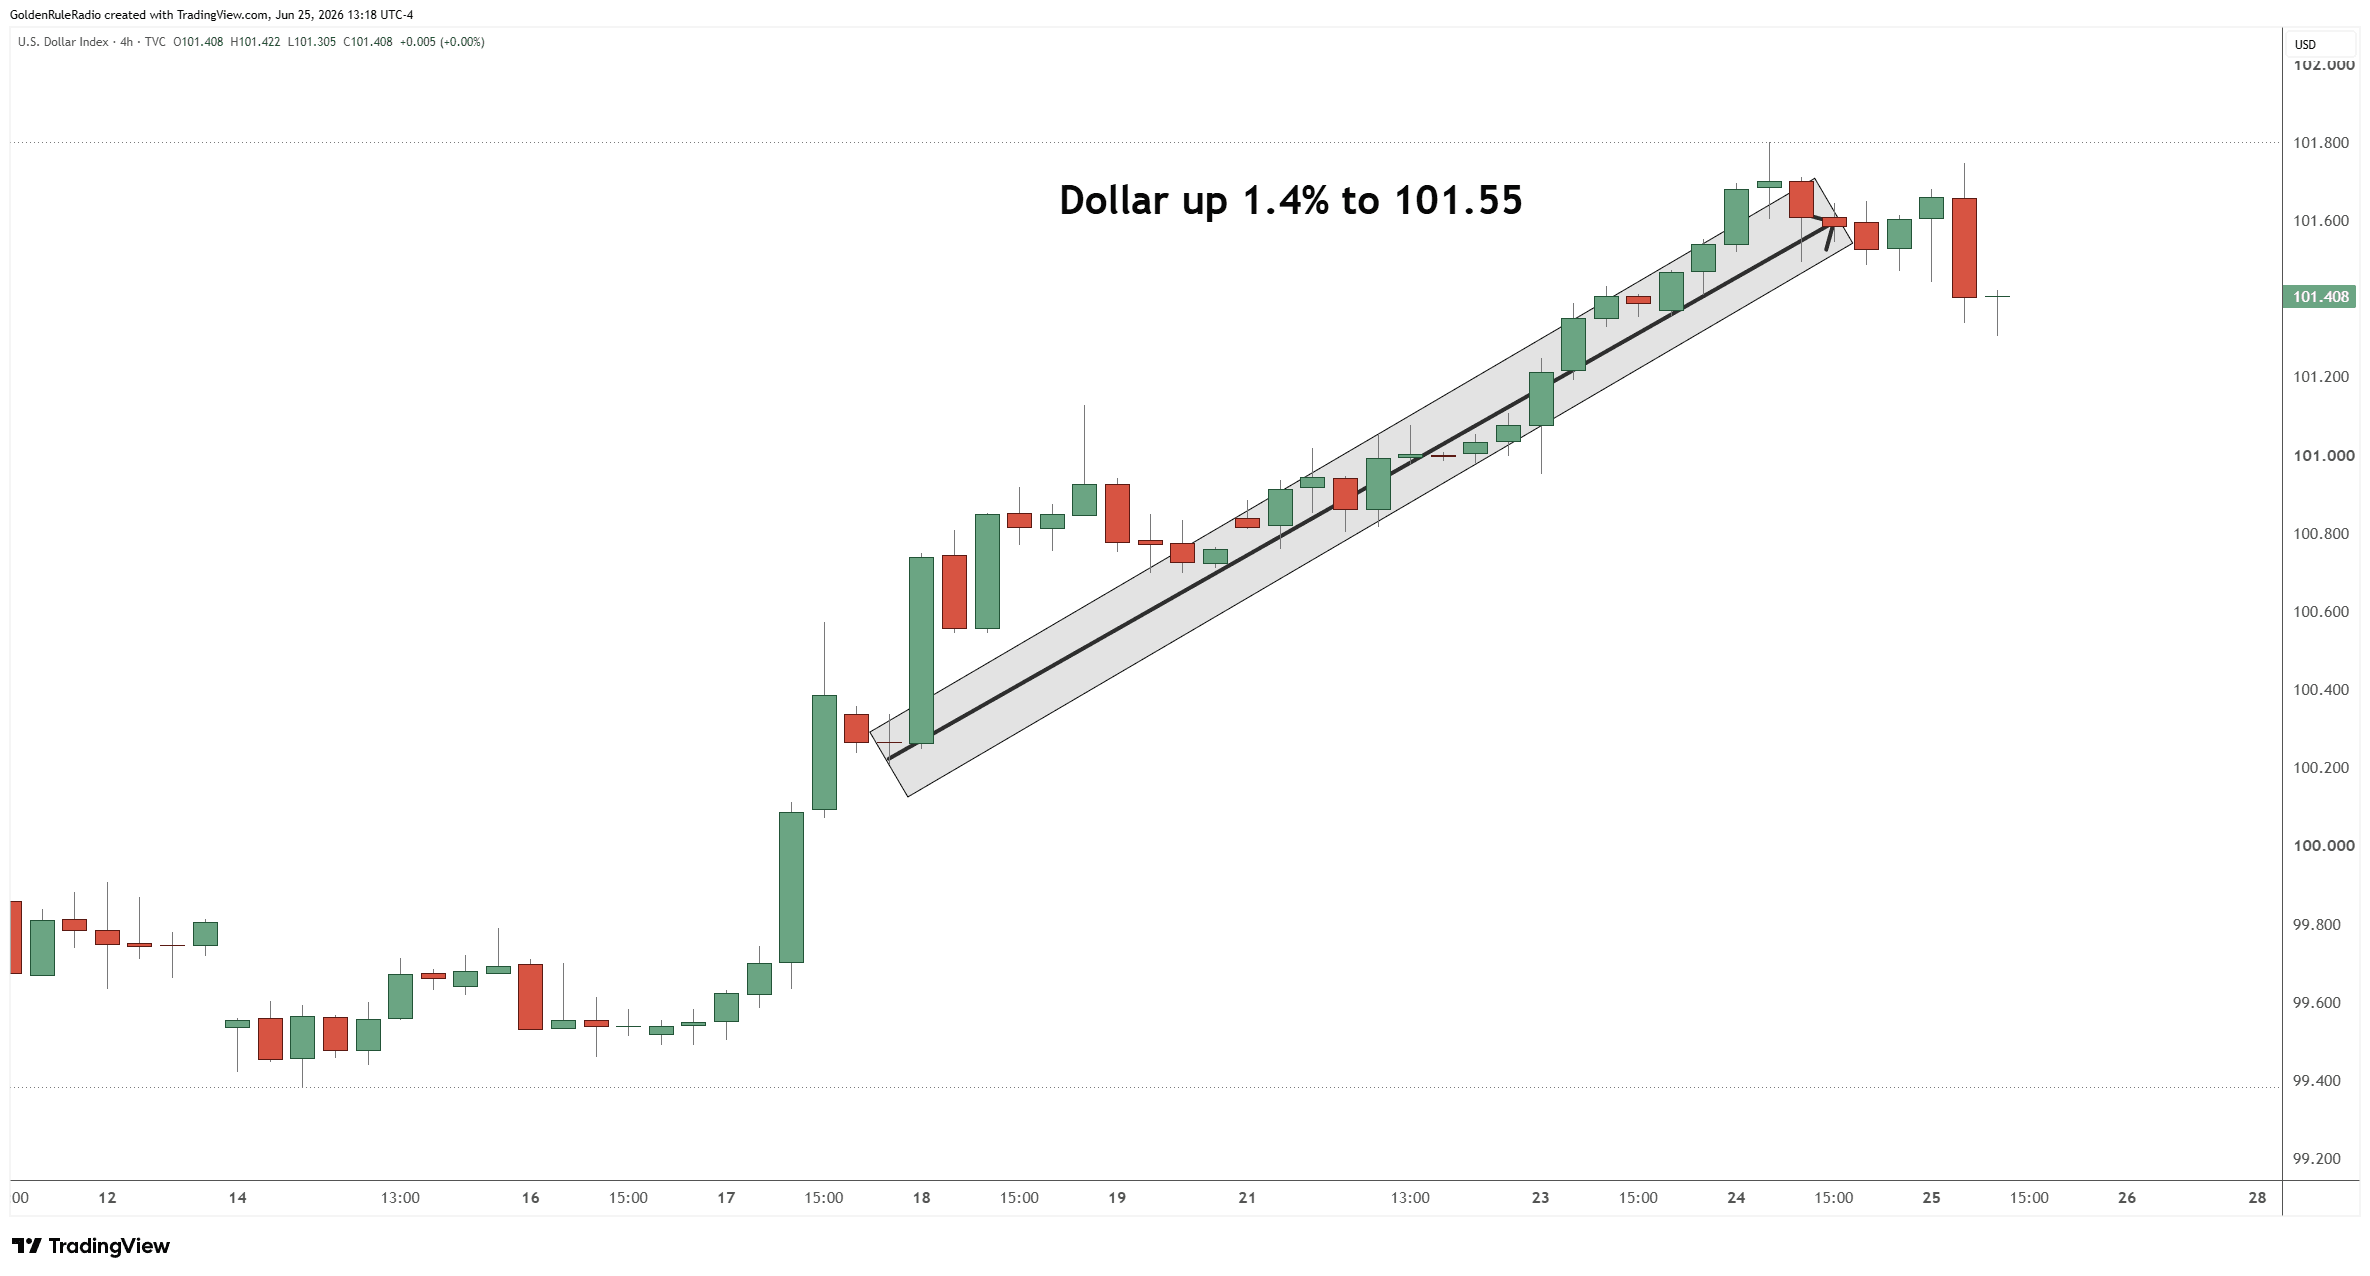

Thursday, January 19, 2023 – 4:00pm Eastern / 2:00pm Mountain



Stay connected to market trends with personalized weekly insights — custom to you!